Báo cáo hóa học: "Research Article Dynamic Object Tracking Tree in Wireless Sensor Network" pptx
Bạn đang xem bản rút gọn của tài liệu. Xem và tải ngay bản đầy đủ của tài liệu tại đây (882.56 KB, 8 trang )
Hindawi Publishing Corporation
EURASIP Journal on Wireless Communications and Networking
Volume 2010, Article ID 386319, 8 pages
doi:10.1155/2010/386319
Research Article
Dynamic Object Tracking Tree in Wireless Sensor Network
Min-Xiou Chen,
1
Che-Chen Hu,
2
and Wen-Yen Weng
2
1
Depar tment of Computer Science and Information Engineering, National Dong Hwa University, 974 Hualien, Taiwan
2
Department of Computer Science and Information Engineering, Chung Hua University, 300 Hsinchu, Taiwan
Correspondence should be addressed to Min-Xiou Chen,
Received 30 October 2009; Accepted 30 March 2010
Academic Editor: Xinbing Wang
Copyright © 2010 Min-Xiou Chen et al. This is an open access article distributed under the Creative Commons Attribution
License, which permits unrestricted use, distribution, and reproduction in any medium, provided the original work is properly
cited.
Recent advances in embedded microsensing technologies and low-energy cost sensors have made wireless sensor networks possible.
Object tracking is an important research of wireless sensor networks. However, most object tracking tree is constructed based on
a predefined mobility profile. When the real object movement behaviors are very different to the predefined mobility profile, the
object tracking tree performance will become worse. In the paper, we will propose a dynamic adaptation mechanism, referred to
as “Message-Tree Adaptive (MTA)” procedure, to improve the object tracking tree when the predefined mobility profiles do not
match. From the simulation results, the performance of the object tracking tree can be significantly improved, when the MTA
procedure is performed.
1. Introduction
Recent advances in embedded micro-sensing technologies
and low energy cost sensors, the sensors are smaller, cheaper
and more intelligent. These sensors are equipped with RF
communication module and make the killer application for
object tracking in wireless sensor network possible. These
wireless sensors have the ability to collect process and store
environmental information and can be accessed from the
network. Thus, the wireless sensor networks are used in
environmental monitoring, military surveillance, and home
and industrial security.
With the sensor’s low price and the ability of detecting at
anytime and anywhere, large-scale wireless sensor networks
can be developed with a great number of compact sensors.
Object tracking is an important research of wireless sensor
networks [1–11]. The key functions of wireless sensor node
involve the object detection, object identification, object clas-
sification, object location estimation, and object monitoring.
Inordertoefficiently collect the object information, a special
node, referred to as sink, is introduced to collect the object
location information from the sensors.
Some researches [4–11] proposed constructing a col-
lection architecture using a tree according to the mobility
profile. The mobility profile is used to denote the event rate of
each link. Thus, these researches construct the effective data
collection architecture based on the graph model transferred
from the predefined mobility profile. However, most of
these mobility profiles are obtained based on historical
statistics, such as the city mobility model. The real object
movement behavior usually does not match the predefined
mobility profile. These differences will significantly affect
the performance of the collection architecture. Thus, in
the paper, we propose a Message-Tree Adaptive procedure
(MTA) to dynamically adapt the object tracking tree to
improve the performance of the object tracking tree when the
predefined mobility profiles do not match. The simulation
results show that it is evident that the MTA procedures can
provide good performance.
The rest of this paper is organized as follows: The related
literatures are given in Section 2. The problem statement
and the Massage-Tree Adaptive procedure are presented in
Section 3. Performance studies are conducted in Section 4.
This paper concludes with Section 5.
2. Related Works
A numerous researches had been proposed to address
the collection architecture problem in the wireless sensor
network. These proposed researches can be grouped into two
2 EURASIP Journal on Wireless Communications and Networking
main approaches, cluster-based tree [1–3], hierarchy-based
tree [4–11].
The cluster-based tree will organize all sensors into
clusters and an election of cluster heads will determine which
node takes responsibility for collecting the object informa-
tion within the same cluster and report that information
back to the sink. This node is called the cluster head. When
the distance between the cluster head and sink is more than
one hop, a multiple hop path is created between the cluster
head and sink. Due to the limitation in sensor power, the
sensors near the sink will use up their power, and the wireless
sensor network will not work.
In [1], the authors proposed the LEACH algorithm to
build a hierarchy tree. The LEACH algorithm has two phases.
Thesetupphasewillrandomlyselectalocalclusterhead.The
sensor nodes will send the information to the sink through
their cluster heads. However, the LEACH algorithm assumes
that all nodes have enough power to communicate directly
with the base, but in fact, the power of the sensor nodes is
limited. The LEACH algorithm concentrates only on finding
an efficient way to forward the data report to the data center
but does not construct robust and reliable reports in an
energy efficient manner.
In [2], the authors proposed a dynamic cluster structure
to efficiently collect the object information. The proposed
structure is used to track enemy vehicles, wild fires, toxic
gases, biological activity, and so on. To provide efficient
object tracking, the boundary nodes located near the track-
ing object must be identified first. The boundary nodes
should report the tracking information to the sink. The
authors used the dynamic cluster structure to collect the
boundary node information and report to sink using cluster
heads.
The authors proposed a Heterogeneous tracking model
(HTM) for object tracking in [3]. They used Variable
memory Markov (VMM) to predict the patterns of moving
objects and used these patterns to construct the cluster
tree. The drawback is the higher computation complicity of
VMM. Moreover, when the prediction patterns are wrong,
the performance of the cluster tree will become worse.
The hierarchy-based tree can improve the cluster-based
tree drawback. The root of the hierarchy-based tree is the
sink. Kung and Vlah in [4] proposed a tree-structuring
algorithm, referred to as “drain-and-balance (DAB)” tree
that uses a hierarchy-based tree for object tacking. The DAB
tree is a logical tree and is constructed based on the event
rate cost. Thus, the DAB tree is not constructed based on the
physical structure of a wireless sensor network. Some edges
in the DAB tree may consist of multiple hops. The drawback
of DAB is that it is a binary tree, so that the tree will increase
when the number of sensor nodes increases.
The object tracking information can be divided into two
basic actions. The first is the update action and the second is
a query action. When an object moves from one sensor node
into another sensor node, the update action is triggered in
both these sensor nodes. The query action is invoked when
a user wants to find the location of an object of interest. The
update action cost was considered in [4], but the query action
cost was not considered in the DAB algorithm. To improve
the drawback of DAB, Lin et al. in [5] proposed Deviation-
Avoidance Tree (DAT). The DAT is a multiway tree that uses a
greedy tree-structuring algorithm to construct a hierarchical
tree based on the physical structure of a wireless sensor
network. All of the sensor nodes in the DAT should be used to
detect objects, store detected information and make update
reports. The query cost reduction is also considered in the
DAT algorithm. The DAT can be updated using the Query
Cost Reduction (QCR) method. Thus, the DAT performance
is better than that of DAB. In [6], the authors also proposed
a multisink tree to track objects. The multi-sink concept
reduces the query cost and also reduces the communication
cost.
In [7], the authors also proposed a protocol to track an
object in a wireless sensor network. In the proposed protocol,
the sink can quickly find a target object along a shortened
path and effectively obtain the track and position of the
target object. The performance of their proposed protocol
can be better than that of flooding-based query methods.
In [8], the TMP (Temporal Movement Patterns)—Tree was
proposed to efficiently discover the temporal movement
patterns of objects in wireless sensor networks. The data
mining algorithm was introduced in the TMP. The location
prediction strategies were also considered to reduce the
prediction errors to save power.
In [9], Liu et al. proved that establishing a minimum
object-tracking tree cost is a NP complete problem. They
also proposed the addition of a shortcut mechanism into the
existing object-tracking tree. The shortcut mechanism adds
some other edges into the object tracking tree to improve
the update and query costs. The shortcut link is downward
directed and the leaf node cannot be connected using the
shortcut link. Although the shortcut mechanism can be used
to reduce the update and query costs, the query cost for the
shortcuts mechanism is not better than that of DAT.
In [10], we proposed a tree adaptation procedure (TAP)
to improve the update cost of the object tracking tree. The
bottom-up approach was introduced in the TAP. The TAP
selects a candidate node based on the bottom-up rule and
computes the update cost using the edge connected to the
target node, but was not included in the object tracking
tree. If the update cost of the modified object tracking tree
is lower than that of the original object tracking tree, the
modified object tracking tree will be set as the new object
tracking tree. The TAP will compute the update cost for
the modified object tracking tree until all nodes except the
sink in the object tracking tree have been considered. The
simulation results show that the TAP application achieves
good performance.
Both of these mechanisms require an input mobility
profile that describes the object crossing rate between neigh-
boring sensors. This mobility profile can be obtained based
on historical statistics. However, the movements of physical
objects may vary depending on the mobility profile. In [11],
the authors proposed a mathematical model that generates
a mobility profile based on the stochastic process theory.
Their model is useful when the object mobility pattern is
unknown. However, the movements of physical objects are
unpredictable and actual object movement behaviors may be
EURASIP Journal on Wireless Communications and Networking 3
2
2
3
4
4
4
4
4
4
5
5
5
5
5
5
6
6
6
6
7
7
7
7
7
7
7
7
7
7
7
8
9
9
9
10
12
A
B
C
D
E
F
G
H
I
J
Sink
(a)
4
9
9
9
9
11
11
9
13
11
13
16
16
14
14
16
16
19
A
B
C
D
E
F
G
H
I
J
Sink
(b)
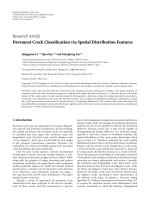
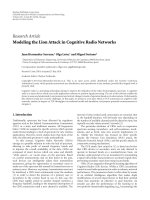
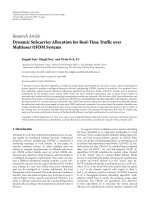
Figure 1:VoronoiGraphandObjectMovementModel.
very different from the mobility profile. The object tracking
performance may be worse when the mobility profile is not
correct.
3. System Architecture
3.1. Problem Statement. When the deployment region is fully
covering the sensing field area, the sensing area of each sensor
node can be modeled using a Voronoi graph [12], as depicted
in Figure 1(a). In the Voronoi graph, when node i and node
j share a common border in the Voronoi graph, these nodes
are called neighbors, and a link can be connected between
the neighbors. Thus, a graph G(V,E) can be obtained as the
Figure 1(b),whereV is the set of wireless sensor nodes and
link e(i, j)
∈ E for all i, j ∈ V if i and j are neighbors.
When an object moves in the sensing range of a node,
an arrival message is reported by the sensor node. Similarly,
a departure message should also be reported by the sensor
node, when an object moves out of a sensor node’s sensing
range. The arrival message and departure message are
involved in the updated message. Thus, when an object
moves between the neighbor nodes i and j, these neighboring
nodes should report the updated messages to the sink. We
call this the event rate, which is the sum of the departure
rate from the node i to node j, and the arrival rate from the
node j to node i. The event rate of the link e(i, j), is denoted
as w(i, j). As shown in Figure 1(a),thedepartureratefrom
nodes B to C is 4, and the arrival rate from nodes C to B is 5.
The event rate between nodes B and C is 9.
According to the definition in [5], the root of the object
tracking tree is the sink, and all the intermediate nodes and
leave nodes have the ability to track object. The intermediate
nodes also have to store a detected object set, and to forward
the updated reports. According to the aggregation model
proposed in DAB, when an object moves from a sensor node
to its neighbor’s sensor node, the update messages will be
forward to the lowest common ancestor of these two sensor
nodes.
These researches proposed in [4–11] require an input
mobility profile that describes the object crossing rate
between the neighbor sensor nodes. Most of these mobility
profiles are obtained based on historical statistics, such as the
city mobility model. But the movements of physical objects
are unpredictable, and the real object movement behaviors
may not match the mobility profile. The performance of
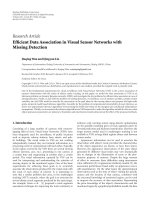
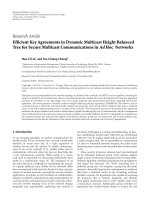
object tracking may be worse due to these differences. For
example, an assumptive object movement model is shown
in Figure 1(a), and the DAT can be constructed based on the
Figure 1(b), and is shown in the Figure 2(a). Suppose that the
event rates of w(A,B), w(A,H), w(A,J), and w(B,J) different
between the Figure 1(b) and Figure 2(a), the updated cost
of the original DAT is increased from 418 to 468. However,
suppose the object tracking can be reconstructed using DAT,
as shown in Figure 2(b), the updated cost can be improved
from 468 to 452. Thus, a dynamic adaptive mechanism for
object-tracking tree can improve the performance of object-
tracking tree.
3.2. Message-Tree Adaptive Procedure. From the discussion in
previous section, we know that a dynamic adaptive mecha-
nism for object-tracking tree can improve the performance
of object-tracking tree. In this section, we propose the
Message-Tree Adaptive (MTA) procedure. The basic concept
of the MTA procedure is that when the sensor node finds the
real object movement behaviors not matching the mobility
profile, the sensor node should perform the MTA procedure.
Thus, each sensor node should store the event rate of each
link, and has the predefined event rate of each link. When
the actual event rate and the predefine event rate are not
match, the MTA procedure will be triggered. As shown in
the Figure 2(a), the actual event rate of w(A,H) is 17, and the
predefine event rate w(A,H) is 9. Thus, the MTA procedure
will be triggered in nodes A and H.
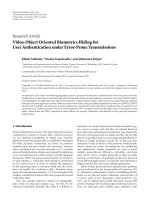
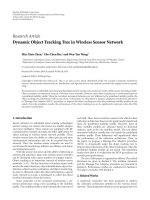
When the MTA procedure is triggered, these nodes
should send the adaptive message to the sink along the object
tracking tree. The adaptive message will contain the each
link’s actual event rate in the sensor node. As shown in
Figure 3(a), the nodes A, B, H and J will send the adaptive
messages to the sink, node C, along the object tracking
tree. When the sink receives the adaptive messages, it will
4 EURASIP Journal on Wireless Communications and Networking
5
9
17
14
9
11
11
10
13
11
13
16
16
14
14
16
16
19
A
B
C
D
E
F
G
H
I
J
Sink
(a)
5
9
17
14
9
11
11
10
13
11
13
16
16
14
14
16
16
19
A
B
C
D
E
F
G
H
I
J
Sink
(b)
Figure 2: An example of object tracking tree.
5
9
17
14
9
11
11
10
13
11
13
16
16
14
14
16
16
19
A
B
C
D
E
F
G
H
I
J
Sink
(a)
5
9
17
14
9
11
11
10
13
11
13
16
16
14
14
16
16
19
A
B
C
D
E
F
G
H
I
J
Sink
(b)
5
9
17
14
9
11
11
10
13
11
13
16
16
14
14
16
16
19
A
B
C
D
E
F
G
H
I
J
Sink
(c)
5
9
17
14
9
11
11
10
13
11
13
16
16
14
14
16
16
19
A
B
C
D
E
F
G
H
I
J
Sink
(d)
Figure 3: An example of MTA procedure.
need to send the collection message to all the intermediate
nodes in the object tracking tree to get the each link’s actual
event rate in the wireless sensor network. As shown in
Figure 3(b), the sink first sends the collection message to all
the intermediate nodes B, E, I, and J. When the intermediate
node receives the collection message, the intermediate nodes
will report their aggregation messages to the sink. As shown
in Figure 3(c), the intermediate nodes B, E, I, and J send their
aggregation messages to the sink along the object tracking
tree.
EURASIP Journal on Wireless Communications and Networking 5
When the sink has the actual event rates in the wireless
sensor network, the sink will reconstruct the object tracking
tree based on the actual event rates. The object tracking tree
can be reconstructed by DAT [5] or TAP [10]. Finally, the
sink should announce the nodes which are changed in the
new object tracking tree. As shown in Figure 3(d), the sink
should send the announced messages to the nodes A, B, H, I,
and J. The reconstructed object tracking tree is shown in the
Figure 2(b).
It is obvious that the MTA procedure cost is very high,
and should be measured. We introduce the adaptation cost to
measure the overhead of the MTA procedure. The adaptation
cost can be divided into three parts. The first one is the
number of the adaptive messages, the second part is the
number of collection and report messages, and the last one
is the number of announce message. The adaptive s is sent
from the sensor nodes, which need to perform the MTA
procedure, to the sink. The number of the adaptive message
of node I, denoted by Report (I), is the hub counts between
node I, and the sink. As shown in Figure 3(a), the nodes A,
B, H, and J will send the adaptive messages to the sink, and
the number of the adaptive message is 7.
The collection messages are sent from the sink to the
intermediate nodes, and the report messages are sent from
the intermediate node to the sink. The number of the
collection messages and report message of node I, denot by
Collection(I), is two times the hub counts between node I
and the sink. As shown in Figures 3(b), and 3(c), the sink first
sends the collection message to all the intermediate nodes B,
E, I and J, and the intermediate nodes B, E, I and J sends
their aggregation messages to the sink. Thus, the number
of the collection message and report messages is 10. The
Announce(I) can be used to denoted the hub counts between
the node I and the sink, when the sink send the announce
message to the node I. As shown in Figure 3(d), the sink send
the announce messages to the nodes A, B, H, I and J, and the
number of announce message is 7. Therefore, the adaptation
cost can be defined as follows:
Adaptation cost
=
i∈S
R
Report
(
i
)
+
i∈S
C
Collection
(
i
)
+
i∈S
A
Announce
(
i
)
, i ∈ N,
(1)
where S
R
represents the set of the sensor nodes which should
send the adaptive message, S
C
is the set of sensor nodes which
receives the collection messages sent from the sink or the
subroot, and S
A
denotes the set of sensor nodes that need
to change after the MTA procedure.
It is obvious that the adaptation cost is very high. Thus,
suppose the difference between the actual event rate and the
predefined event rate is very small. The MTA procedure will
then be not necessary to perform. The ratio of change is
introduced to decide when the MTA procedure should be
performed. The ratio of change is defined as follows:
ratio of change
=
new even trate − original event rate
original event rate
.
(2)
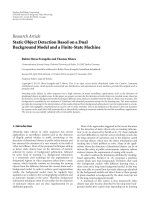
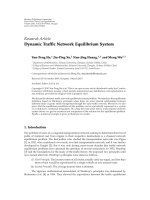
All sensor nodes record
eventrateofeachlinks
and calculate the ratio of
change
Ratio of change
≥ θ?
Does not report
Responds the request
to the sink
Sink querys the event rate of
links from all branches and
receives these information
from these branches
Sink processes the adaptation
algorithm
Sink sends adaptation messages
to the nodes which need to be
adapted
Step 1
Step 2
Step 3
Step 4
Step 5
Step 6
Ye s
No
Figure 4: Flow chart of MTA procedure on sink.
The minimal original event rate should be 1. We can
define a threshold value θ. When the link’s ratio of change
exceeds θ, the sensor node will perform the MTA procedure.
Otherwise, the MTA procedure will not be performed. The
detailed MTA procedure flowchart is shown in Figure 4.
4. Simulation Results
We implement a simulator to evaluate the performance of
the Message-Tree Adaptive procedure on a sensing field of
256
× 256. The number of deployed sensors varied from 100
to 1000, which are randomly and uniformly deployed in the
sensing field. The mobility profiles are generated based on
the city mobility model in [4]. To ensure that the mobility
profile was statistically significant, the object made 200,000
movesineachmobilityprofile.Eachsimulationran100
mobility profiles to ensure stable results.
In this paper, the object tracking tree is constructed
and reconstructed using the DAT algorithm. We compare
the performance of the object tracking tree when the MTA
procedure is performed with that of the object tracking tree
when the MTA procedure is not performed. The range of the
threshold value θ is from 5% to 95%. We randomly selected
6 EURASIP Journal on Wireless Communications and Networking
1 9 17 25 33 41 49 57 65 73 81 89 97
143
145
147
149
151
153
155
157
159
Modify links
Update cost
Without MTA
With MTA
×10
4
Figure 5: The average update cost (1–100 links).
1 6 11 16 21 26 31 36 41 46 51 56 61 66 71 76 81 86 91 96
25
45
65
85
105
125
145
165
185
205
225
×10
2
Modify links
Adaptation cost
With MTA
Figure 6: The Average Adaptation Cost using MTA Procedure (1–
100 links).
some links to randomly set its new event rate. The average
updatedcostisdefinedin[5], and the average adaptation
cost are considered in this study.
In the figures and tables, the results denoted without
MTA are the results of the original object tracking tree
affected by the changed mobility profile. The results denoted
by MTA are the results of the MTA procedure running. In the
Figures 5, 6, 7 and 8, the number of change links event rate
is from 1 to 100. The θs is 20%, and the number of sensor
node is 1000. First, as shown in Figure 5, we observe the
advantage of using MTA procedure to significant reduce the
update cost. The Figure 6 shows that the adaptation cost of
the MTA procedure is slightly increased when the number of
modify link increased. In Figure 7, we observe the improved
percentage is decreased when the number of modify link is
more than 6. From the Figure 8, we can find that the total
overhead (average update cost + average adaptation cost) is
still lower than the average update cost without using the
MTA procedure.
1 6 11 16 21 26 31 36 41 46 51 56 61 66 71 76 81 86 91 96
0.9
0.91
0.92
0.93
0.94
0.95
0.96
0.97
0.98
0.99
1
Modify links
Improvement ratio
With MTA
Figure 7: The Improvement Percentage using MTA Procedure (1–
100 links).
1 9 17 25 33 41 49 57 65 73 81 89 97
143
145
147
149
151
153
155
157
159
Modify links
Overhead
Without MTA
With MTA
With MTA (total)
×10
4
Figure 8: The total average overhead (1–100 links).
In Figures 9, 10 and 11 and Ta bl e 1, show performance
at different θ and different MTA procedures. We randomly
selected 20 links to change its event rate. The number of
sensor nodes is 1000. From Figure 9 and Ta b le 1 , when the θ
is increased, the improvement percentage for the update cost
is slightly increased. This is because when the θ increases, the
number of times the MTA procedure is triggered decreases
and the average update cost will increase. In Figure 10,we
observe that when θ is increased the average adaptation
cost is slightly decreased. It is also because that the number
of times the MTA procedure is triggered decreases when θ
increases.
In Figure 11, we analyze the message ratio for the
adaptation cost. We found that when θ increases, the number
of adaptive messages decreases. This is because when θ
increases, the number of sensor nodes that need to send
adaptive messages decreases. The number of announcement
messages does not change too greatly. It is obvious that
the most overhead for the adaptation cost come from
EURASIP Journal on Wireless Communications and Networking 7
0.05 0.15 0.25 0.35 0.45 0.55 0.65 0.75 0.85 0.95
141
141.5
142
142.5
143
143.5
144
144.5
145
×10
4
Threshold
Update cost
Without MTA
With MTA
Figure 9: The average update cost.
0.05 0.15 0.25 0.35 0.45 0.55 0.65 0.75 0.85 0.95
1
2
3
4
5
6
7
8
9
10
11
×10
3
Threshold
Adaptation cost
With MTA
Figure 10: The average adaptation cost using MTA procedure.
0.05 0.25 0.45 0.65 0.85
0
2
4
6
8
10
12
×10
3
Threshold
Adaptation cost
Collection
Announce
Report
Figure 11: The adaptation cost analysis.
Table 1: The Improvement Percentage using MTA Procedure.
Threshold with MTA on sink
5% 0.985587
10% 0.985587
15% 0.985587
20% 0.985587
25% 0.985587
30% 0.985587
35% 0.985587
40% 0.985587
45% 0.985587
50% 0.985587
55% 0.985587
60% 0.985587
65% 0.985587
70% 0.985587
75% 0.985587
80% 0.985587
85% 0.985587
90% 0.985602
95% 0.985602
the collection and report messages. With the aggregation
procedure in the sub root, the adaptation cost can be
greatly improved using the Subroot Message-Tree Adaptive
procedure.
From these results, we can see that the MTA procedure
can significantly improve the update cost when the actual
mobility model is very different from the mobility profile.
5. Conclusion
Most object tracking is constructed based on a predefined
mobility profile. When the actual object movement behav-
iors do not match the predefined mobility profiles, the
object tracking tree performance will become worse. This
paper proposed a Message-Tree Adaptive (MTA) procedure
to improve the object tracking tree structure when the
predefined mobility profiles do not match the actual object
movement behaviors. From the simulation results, the
performance of the object tracking tree can be significantly
improved using the MTA procedure. Moreover, the adapta-
tion cost is also considered in the paper. From the simulation
results, the adaptation cost is high when the MTA procedure
is performed. In the near future, we will propose new strategy
to improve the adaptation cost.
Acknowledgment
This paper was supported by the National Science Council
of Taiwan, under Grants NSC95-2221-E-216-039, NSC96-
2221-E-216-010, and NSC97-2221-E- 259-036.
8 EURASIP Journal on Wireless Communications and Networking
References
[1] W. R. Heinzelman, A. Chandrakasan, and H. Balakrish-
nan, “Energy-efficient communication protocol for wire-
less microsensor networks,” in Proceedings of the 33rd
Annual Hawaii International Conference on System Siences
(HICSS ’00), pp. 3005–3014, Maui, Hawaii, USA, January
2000.
[2] X. Ji, H. Zha, J. J. Metzner, and G. Kesidis, “Dynamic cluster
structure for object detection and tracking in wireless ad-
hoc sensor networks,” in Proceedings of IEEE International
Conference on Communications, vol. 7, pp. 3807–3811, Paris,
France, June 2004.
[3] W. C. Peng, Y. Z. Ko, and W. C. Lee, “On mining moving
patterns for object tracking sensor networks,” in Proceedings of
the 7th International Conference on Mobile Data Management
(MDM ’06), p. 41, May 2006.
[4] H.T.KungandD.Vlah,“Efficient location tracking using sen-
sor networks,” in Proceedings of IEEE International Conference
on Wireless Communications and Networking, 2003.
[5] C. Y. Lin, W. C. Peng, and Y. C. Tseng, “Efficient in-network
moving object tracking in wireless sensor networks,” IEEE
Transactions on Mobile Computing, vol. 5, no. 8, pp. 1044–
1056, 2006.
[6] C. Y. Lin, Y. C. Tseng, and T. H. Lai, “Message-efficient in-
network location management in a multi-sink wireless sensor
network,” in Proceedings of IEEE International Conference on
Sensor Networks, Ubiquitous, and Trustworthy Computing,pp.
496–502, 2006.
[7] H. W. Tsai, C. P. Chu, and T. S. Chen, “Mobile object tracking
in wireless sensor networks,” Computer Communications, vol.
30, no. 8, pp. 1811–1825, 2007.
[8] V. S. Tseng and K. W. Lin, “Energy efficient strategies for object
tracking in sensor networks: a data mining approach,” Journal
of S ystems and Software, vol. 80, no. 10, pp. 1678–1698, 2007.
[9] B. H. Liu, W. C. Ke, C. H. Tsai, and M. J. Tsai, “Constructing a
message-pruning tree with minimum cost for tracking moving
objectsinwirelesssensornetworksisNP-completeandan
enhanced data aggregation structure,” IEEE Transactions on
Computers, vol. 57, no. 6, pp. 849–863, 2008.
[10] M X. Chen and Y D. Wang, “An efficient location tracking
structure for wireless sensor networks,” Computer Communi-
cations, vol. 32, no. 13-14, pp. 1495–1504, 2009.
[11] L. H. Yen and C. C. Yang, “Mobility profiling using Markov
chains for tree-based object tracking in wireless sensor
networks,” in Proceedings of IEEE International Conference on
Sensor Networks, Ubiquitous, and Trustworthy Computing, vol.
2, pp. 220–225, 2006.
[12] F. Aurenhammer, “Voronoi diagrams—a survey of a funda-
mental geometric data structure,” ACM Computing Surveys,
vol. 23, no. 3, pp. 345–405, 1991.