Báo cáo hóa học: "Research Article Higher-Order Cyclostationarity Detection for Spectrum Sensing" pdf
Bạn đang xem bản rút gọn của tài liệu. Xem và tải ngay bản đầy đủ của tài liệu tại đây (828.41 KB, 10 trang )
Hindawi Publishing Corporation
EURASIP Journal on Wireless Communications and Networking
Volume 2010, Article ID 721695, 11 pages
doi:10.1155/2010/721695
Research Article
Higher-Order Cyclostationarity Detection for Spectrum Sensing
Julien Renard, Jonathan Verlant-Chenet, Jean-Michel Dricot,
Philippe De Doncker, and Francois Horlin
Universit
´
e Libre de Bruxelles, Avenue F. D. Roosevelt 50, 1050 Brussels, Belgium
Correspondence should be addressed to Julien Renard,
Received 30 September 2009; Revised 18 February 2010; Accepted 15 June 2010
Academic Editor: Andr
´
e Bourdoux
Copyright © 2010 Julien Renard et al. This is an open access article distributed under the Creative Commons Attribution License,
which permits unrestricted use, distribution, and reproduction in any medium, provided the original work is properly cited.
Recent years have shown a growing interest in the concept of Cognitive Radios (CRs), able to access portions of the electromagnetic
spectrum in an opportunistic operating way. Such systems require efficient detectors able to work in low Signal-to-Noise Ratio
(SNR) environments, with little or no information about the signals they are trying to detect. Energy detectors are widely used to
perform such blind detection tasks, but quickly reach the so-called SNR wall below which detection becomes impossible Tandra
(2005). Cyclostationarity detectors are an interesting alternative to energy detectors, as they exploit hidden periodicities present
in man-made signals, but absent in noise. Such detectors use quadratic transformations of the signals to extract the hidden sine-
waves. While most of the literature focuses on the second-order transformations of the signals, we investigate the potential of
higher-order transformations of the signals. Using the theory of Higher-Order Cyclostationarity (HOCS), we derive a fourth-
order detector that performs similarly to the second-order ones to detect linearly modulated signals, at SNR around 0 dB, which
may be used if the signals of interest do not exhibit second-order cyclostationarity. More generally this paper reviews the relevant
aspects of the cyclostationary and HOCS theory, and shows their potential for spectrum sensing.
1. Introduction
Many studies have shown that the static frequency allocation
for wireless communication systems is responsible for the
inefficient use of the spectrum [1]. This is so because the
systems are not continuously transmitting. Cognitive Radios
(CRs) networks try to make use of the gaps that can be found
in the spectrum at a given time. This opportunistic behavior
categorizes CR as secondary users of a given frequency band,
by contrast with the systems that were permanently assigned
this band (primary users) [2]. For the CR concept to be
viable, it is required that it does not interfere with the
primary user services. It means that the system must be able
to detect primary user signals in low signal-to-noise ratio
(SNR) environments fast enough. Efforts are being made to
improve the performance of the detectors [3].
A radiometer (also called energy detector) can be used
to detect completely unknown signals in a determined
frequency band [4]. It is historically the oldest and simplest
detector, and it achieves good performance when the SNR
is strong enough. Unfortunately, since it is based on an
estimation of the in-band noise power spectral density
(PSD), it is affected by the noise level uncertainty (due to
measurement errors or a changing environment), especially
at low SNR [5], where it reaches an absolute performance
limit called the SNR wall. Another type of detector is based
on the spectral redundancy present in almost every man-
made signal. It is called a cyclic feature detector and will be
the kind of detector of interest in this paper.
Cyclic feature detectors make use of the cyclostationarity
theory, which can be divided in two categories: the second-
order cyclostationarity (SOCS) introduced by Gardner in
[6–8] and the higher-order cyclostationarity (HOCS) intro-
duced by Gardner and Spooner in [9, 10]. The SOCS uses
quadratic nonlinearities to extract sine-waves from a signal,
whereas the HOCS is based on nth-order nonlinearities. The
idea behind this theory is that man-made signals possess
hidden periodicities such as the carrier frequency, the symbol
rate or the chip rate, that can be regenerated by a sine-wave
extraction operation which produces features at frequencies
that depend on these hidden periodicities (hence called cyclic
features and cycle frequencies resp.). Since the SOCS is based
on quadratic nonlinearities, two frequency parameters are
used for the sine-wave extraction function. The result is
2 EURASIP Journal on Wireless Communications and Networking
called the spectral correlation density (SCD), and can be
represented in a bifrequency plane. The SCD can be seen
as a generalization of the PSD, as it is equal to the PSD
when the cycle frequency is equal to zero. Therefore, the
SOCS cyclic feature detectors act like energy detectors, but
at cycle frequencies different from zero. The advantage of
these detectors comes from the absence of features (at least
asymptotically) when the input signal is stationary (such
as white noise), since no hidden frequencies are present,
or when the input signal exhibits cyclostationarity at cycle
frequencies different than the one of interest. The HOCS
cyclic-feature detectors are based on the same principles, but
the equivalent of the SCD is a n-dimensional space (n>2).
Like SOCS detectors, HOCS detectors have originally been
introduced in the literature to blindly estimate the signal
frequency parameters.
It has been shown that the second-order cyclostationarity
detectors perform better than the energy detectors in low
SNR environments [7], and this has recently triggered a
lot of research on the use of cyclostationarity detectors
for spectrum sensing in the context of cognitive radios
[11, 12]. However the second-order detectors suffer from
a higher computational complexity that has just become
manageable. First field-programmable gate array (FPGA)
implementations are presented in [13, 14].
Higher-order detectors are generally even more complex,
and since the variance of the features estimators increases
when the order rises, most research results concern second-
order detectors. We will nevertheless demonstrate that
it is possible to derive fourth-order detectors that bear
comparable performances to second-order ones to detect
linearly modulated baseband signals at SNR around 0 dB.
The paper will include a mathematical analysis of the
detection algorithm, the effects of each of its parameters and
its computational complexity. Performance will be assessed
through simulations and compared with the second-order
detector.
After introducing the system model in Section 2,wewill
briefly review the basic notions of cyclostationarity theory in
Section 3 in order to understand how second-order detectors
work and identify their limitations. Afterwards, we will move
on to HOCS theory, and present its most relevant aspects
in Section 4, which will be used to characterize the linearly
modulated signals in Section 5 and to derive an algorithm
that may be used for signal detection of linearly modulated
signals in Section 6. We will conclude by a comparison of the
new detector performance with second-order detector and
energy detector performances in Section 7.
2. System Model
This paper focuses on the detection of linearly modulated
signals, like pulse amplitude modulation (PAM) or quadra-
ture amplitude modulation (QAM) signals. The baseband
transmitted signal is usually expressed as
s
(
t
)
=
∞
m=−∞
I
m
p
(
t −mT
s
)
,
(1)
where I
m
is the sequence of information symbols transmitted
at the rate F
s
= 1/T
s
and p(t) is the pulse shaping filter
(typically a square-root Nyquist filter). After baseband-to-
radio frequency (RF) conversion, the RF transmitted signal
is given by:
s
RF
(
t
)
= R
[
s
(
t
)
]
cos
(
ω
c
t
)
− I
[
s
(
t
)
]
sin
(
ω
c
t
)
,
(2)
where ω
c
= 2πf
c
and f
c
is the carrier frequency. In the
PAM case, the symbols I
m
are real and only the cosine is
modulated. In the QAM case, the symbols I
m
are complex
and both the cosine and sine are modulated. A QAM signal
can be seen as two uncorrelated PAM signals modulated in
quadrature.
For the sake of clarity, we assume that the signal propa-
gates through an ideal channel. Our results can nevertheless
be extended to the case of multipath channels, if we consider
a new pulse shape that is equal to the convolution of
square-root Nyquist filter with the channel impulse response.
However, this would make the new pulse random. Simula-
tions have shown that both second-order and fourth-order
detectors are affected in the same way by a multipath channel
(equivalent degradation of performances). Therefore it does
not seem critical to introduce multipath channels in order to
compare the two, and it allows us to work with a constant
pulse shape. Additive white Gaussian noise (AWGN) of one-
sided PSD equal to N
0
corrupts the signal at the receiver.
Some amount of noise uncertainty can be added to N
0
.The
detection of the signal at the receiver can be either done
directly in the RF domain or in the baseband domain after
RF-to-baseband conversion.
3. Second-Order Cyclostationarity
Two approaches are used to introduce the notion of
cyclostationarity [8]. While the first approach introduces
the temporal features of cyclostationary signals, the second
approach is more intuitive and is based on a graphical
representation of spectral redundancy. Both approaches lead
to the same conclusion. This section reviews the main results
of the second-order cyclostationarity theory, which will be
generalized to higher-order cyclostationarity in the next
sections.
3.1. Temporal Redundancy. A wide-sense cyclostationary
signal x(t) exhibits a periodic autocorrelation function [6, 7]
R
x
(
t, τ
)
:
= E
[
x
(
t
)
x
∗
(
t
−τ
)
]
,
(3)
where E[
·] denotes the statistical expectation operator. Since
R
x
(t, τ) is periodic, it can be decomposed in a Fourier series
R
x
(
t, τ
)
=
α
R
α
x
(
τ
)
e
j2παt
,
(4)
where the sum is over integer multiples of the fundamental
frequencies. The coefficient R
α
x
(τ) is called the cyclic auto-
correlation function, and represents the Fourier coefficient
of the series given by
R
α
x
(
τ
)
=
1
T
0
T
0
/2
t
=−T
0
/2
R
x
(
t, τ
)
e
−j2παt
dt.
(5)
EURASIP Journal on Wireless Communications and Networking 3
When the signal is cyclo-ergodic, the expectation in the
definition of the autocorrelation can be replaced by a time
average so that
R
α
x
(
τ
)
= lim
T →∞
1
T
T/2
t
=−T/2
x
(
t
)
x
∗
(
t
−τ
)
e
−j2παt
dt .
(6)
The cyclic autocorrelation is therefore intuitively obtained
by extracting the frequency α sine-wave from the time-delay
product x(t) x
∗
(t − τ). The SCD S
α
x
( f )isdefinedasthe
Fourier transform of R
α
x
(τ)overτ. We notice that the only
cyclic frequencies α for which the SCD will not be null are
the ones corresponding to the Fourier coefficients.
3.2. Spectral Redundancy. Let X( f ) be the Fourier transform
of x(t). The SCD measures the degree of spectral redundancy
between the frequencies f
−α/2and f + α/2(α being called
the cyclic frequency). It can be mathematically expressed as
the correlation between two frequency bins centered on f
−
α/2and f + α/2 when their width tends toward zero [6, 7]
S
α
x
f
=
lim
T →∞
lim
Δt →∞
1
TΔt
Δt/2
t
=−Δt/2
X
T
t,
f + α
2
X
∗
T
t,
f
−α
2
dt,
(7)
where X
T
(t, f ) denotes the short-time Fourier transform of
the signal
X
T
t, f
=
t+T/2
u
=t−T/2
x
(
u
)
e
−j2πfu
du .
(8)
Since the SCD depends on f and α, it can be graphed as a
surface over the bifrequency plane ( f ,α). When α
= 0, the
SCD reduces to the PSD.
3.3. Baseband and RF Second-Order Features. The perfor-
mance of the cyclic feature detectors will first depend on
the strength of the features they are trying to estimate. The
two most common features exploited to detect the linearly
modulated signals are linked with the symbol rate and the
carrier frequency.
(i) The symbol rate feature is usually exploited after RF-
to-baseband conversion at the receiver. As its name
suggests it, it originates from the symbol rate at
the transmitter. Since this is a discrete signal, its
frequency spectrum is periodic, with a period equal
to the inverse of the sample rate (which is equal to the
symbol rate before RF conversion). If there is some
excess bandwidth in the system, or in other words, if
the pulse shaping filter p(t) does not totally cut off the
frequency components larger than half the inverse of
the symbol rate, some frequencies will be correlated,
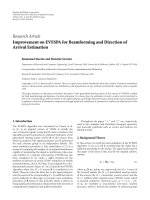
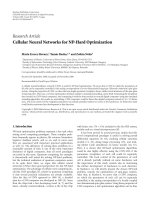
as shown in Figure 1.
(ii) The doubled-carrier frequency feature is directly
exploited in the RF domain. It is based on the
symmetry of the RF spectrum, and it is much
X
T
( f )
f
f
SCD
Figure 1: Baseband signal frequency spectrum (top) and SCD at
thesymbolrate(bottom).Thefrequencyspectrumresultsfromthe
repetitive discrete signal spectrum and the filter shaping. The SCD
is measured by the correlation between two frequency bins centered
on f
−α/2and f + α/2whereα is the symbol rate. The symbol rate
feature exists for baseband PAM/QAM signals if there is some excess
bandwidth in the system.
stronger than the symbol rate feature (it is as strong
as the PSD). Since it depends on the symmetry of the
spectrum of the baseband signal, it only exists if the
modulation used has no quadrature components. If
a real PAM scheme is used, the carrier feature exists,
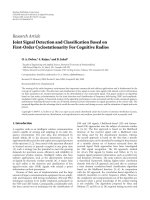
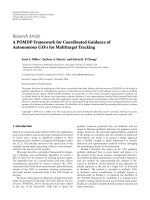
as illustrated in the left part of Figure 2. If a complex
QAM scheme is used, the carrier feature vanishes, as
illustrated in the right part of Figure 2.
Since complex modulations are quite common, it would
not be possible to implement a cyclic feature detector for CRs
based on the doubled-carrier frequency feature. On the other
hand, the symbol rate feature solely depends on the pulse
shaping filter. Provided that there is some excess bandwidth,
the symbol rate feature will exist, whatever the modulation.
Unfortunately, that feature is relatively small and depends
on the amount of excess bandwidth. We can therefore ask
ourselvesifitwouldnotbepossibletofindgreaterfeatures
using a fourth-order detector.
4. Higher-Order Cyclostationarity
The higher-order cyclostationarity (HOCS) theory is a
generalization of the second-order cyclostationarity theory,
which only deals with second-order moments, to nth-order
moments [9, 10]. It makes use of the fraction-of-time
(FOT) probability framework (based on time averages of the
signals) which is closely related to the theory of high-order
statistics (based on statistical expectations of the signals),
by ways of statistical moments and cumulants. This section
reviews the fundamentals of the HOCS theory and highlights
the metrics that can be used for spectrum sensing.
4.1. Lag-Product. We must always keep in mind that the goal
of the HOCS theory is to extract sine-waves components
4 EURASIP Journal on Wireless Communications and Networking
X
T
RF
( f )
−f
c
f
c
f
f
SCD
(a)
X
T
RF
( f )
−f
c
f
c
f
f
SCD
(b)
Figure 2: RF signal frequency spectrum (top) and SCD at twice the carrier frequency (bottom). The SCD is measured by the correlation
between two frequency bins centered on f
− α/2and f + α/2whereα is the carrier frequency. The doubled-carrier frequency feature exists
for RF PAM signals as the baseband frequency spectrum exhibits a correlation between negative and positive frequencies. In the absence of
any filtering, this correlation produces a symmetric frequency spectrum (left part). The doubled-carrier frequency feature vanishes for RF
QAM signals as the baseband frequency spectrum is uncorrelated (right part).
from a signal, in which they are hidden by random phenom-
ena. To extract, or regenerate, these frequencies, a nonlinear
operation must be called upon. The second-order theory
uses the time-delay product L(t, τ)
= x(t) · x
∗
(t − τ)which
will be transformed in the autocorrelation after averaging. A
natural and intuitive generalization of this operation to the
nth-order is called the lag-product and can be expressed as
[9]:
L
(
t, τ
)
n
= x
(∗)
(
t + τ
1
)
x
(∗)
(
t + τ
2
)
···x
(∗)
(
t + τ
n
)
(9)
=
n
j=1
x
(∗)
j
t + τ
j
, (10)
where the vector τ
is composed of the individual delays τ
j
(j = 1, , n). The notation x
(∗)
(t) indicates an optional
conjugation of the signal x(t).
4.2. Temporal Moment Function and Cyclic Temporal Moment
Function. If the signal possesses a nth-order sine-wave
of frequency α, then the averaging of the lag-product,
multiplied by a complex exponential of frequency α,must
be different from zero [9]:
R
α
x
(
τ
)
n
= lim
T →∞
1
T
T/2
−T/2
L
(
t, τ
)
n
e
−j2παt
dt.
(11)
Obviously, R
α
x
(τ)
n
is a generalization of the cyclic auto-
correlation function described in (5). It is called the nth-
order cyclic temporal moment function (CTMF). The sum of
the CTMF (multiplied by the corresponding complex expo-
nentials) over frequency α is called the temporal moment
function (TMF) and is a generalization of the autocorrelation
function described in (3):
R
x
(
t, τ
)
n
=
α
R
α
x
(
τ
)
n
e
j2παt
.
(12)
Each term of the sum in (12) is called an impure nth-
order sine-wave. This is so because the CTMF may contain
products of lower-order sine-waves whose various orders
sum to n. In order to extract the pure nth-order sine-wave
from the lag-product, it is necessary to subtract the lower-
order products. The pure nth-order sine-wave counter-part
of the CTMF, denoted by C
α
x
(τ)
n
, is called the cyclic temporal
cumulant function (CTCF). The pure nth-order sine wave
counter-part of the TMF, denoted by C
x
(t, τ)
n
, is called the
temporal cumulant function (TCF).
4.3. Temporal Cumulant Function and Cyclic Temporal Cumu-
lant Function. The CTMF and TMF have been computed by
using the FOT probability framework. In order to compute
the CTCF and TCF, it is interesting to make use of the
equivalence between the FOT probability framework and the
high-order statistics theory. More specifically, the paper [9]
demonstrates that the TMF of a signal can be seen as the
nth-order moment of the signal, and that the TCF of a signal
canbeseenasthenth-order cumulant of the signal (hence
their names). By using the conventional relations between
the moments and the cumulants found in the high-order
statistics theory, the TCF takes therefore the form:
C
x
(
t, τ
)
n
=
{P}
⎡
⎣
(
−1
)
p−1
p −1
!
p
j=1
R
x
t, τ
j
n
j
⎤
⎦
, (13)
where
{P} denotes the set of partitions of the index set
1, 2, n (10), p is the number of elements in the partition
P,andR
x
(t, τ
j
)
n
j
is the TMF of the jth-element of order n
j
of the partition P.
EURASIP Journal on Wireless Communications and Networking 5
The CTCFs are the Fourier coefficients of the TCF and
can be expressed in terms of the CTMFs:
C
α
x
(
τ
)
n
=
{P}
⎡
⎢
⎢
⎣
(
−1
)
p−1
p −1
!
β
p
j=1
R
β
j
x
τ
j
n
j
⎤
⎥
⎥
⎦
, (14)
where
{β} denotes the set of vectors of cycle frequencies for
the partition P that sum to α (
p
j
=1
β
j
= α), and R
β
j
x
(τ
j
)
n
j
is
the CTMF of the jth-element of order n
j
of the partition P
at the cycle frequency β
j
.
The CTCF is periodic in τ
: C
α
x
(τ +1
n
φ)
n
= C
α
x
(τ)
n
e
j2πφα
(1
n
is the dimension-n vector composed of ones, meaning
that φ is added to all elements of τ
). Therefore, it is not
absolutely integrable in τ
. To circumvent this problem, one
dimension is fixed (e.g., τ
n
= 0), and the CTCF becomes:
C
α
x
(u)
n
= C
α
x
([u 0])
n
.Thisfunctioniscalledreduced
dimension-CTCF (RD-CTCF). It is the key metric of the
ensuing algorithms for HOCS detectors. It should be noted
that the equivalent exists for the CTMF and is called the RD-
CTMF (
R
α
x
(u)
n
= R
α
x
([u 0])
n
). However the RD-CTMF is
generally not absolutely integrable.
4.4. Cyclic Polyspectrum. The need for integrability comes
from the desire to compute the Fourier transform of the
RD-CTCF, which gives the cyclic polyspectrum (CP). The
CP is a generalization of the SCD plane for cyclostationnary
signals. However it is not necessary to compute the CP of a
signal for sensing applications since detection statistics can
be directly derived from a single slice of the RD-CTCF. For
this reason, and the computational complexity gain, we will
put the spectral parameters aside and devote our attention to
the RD-CTCF.
5. Fourth-Order Features of Linearly
Modulated Signals
We have previously talked about the second-order cyclic
features for communication signals, and we saw that the
carrier frequency features tend to vanish from the SCD plane
if the modulation is complex. We also asked ourselves if
a fourth-order transformation of the signal may suppress
the destructive interferences of quadrature components of a
signal. We now have to gauge the potential of these fourth-
order features. In this section, we compute the RD-CTCF of
the baseband and RF linearly modulated signals and identify
the interesting features that can be used for signal detection.
5.1. Baseband Signals. The TCF of the baseband signal
(1) has been computed in paper [10]. The mathematical
derivation results in:
C
s
(
t, τ
)
n
= C
I,n
∞
m=−∞
n
j=1
p
t + mT
s
+ τ
j
(15)
in which C
I,n
is the nth-order cumulant of the symbol
sequence I
m
:
C
I,n
=
{P
n
}
⎡
⎣
(
−1
)
p
n
−1
p
n
−1
!
p
n
j=1
R
I,n
j
⎤
⎦
,
(16)
where
{P
n
} is the set of partitions of the set {1, ,n}, p
n
is the number of elements in the partition P
n
,andn
j
is the
order of the jth-element in the partition P
n
(j = 1···p
n
).
R
I,n
is the nth-order moment of the symbol sequence I
m
:
R
I,n
= lim
K →∞
1
K
K/2−1
k=−K/2
⎡
⎣
n
q=1
I
(∗)
q
k
⎤
⎦
.
(17)
The expression of the moment R
I,n
can be understood
this way: given a particular type of modulation, do the
symbol variables I
k
elevated to the power n (with optional
conjugation specified by the operator (
∗)
q
) gives a constant
result? The answer to this question is helpful in assessing if a
given signal may exhibit nth-order features and what kind
of conjugation must be used in the lag-product (10). The
appendix illustrates this result for the binary PAM and the
quaternary QAM constellations (see also [10, 15]).
Computing the Fourier transform of the TCF and
canceling τ
n
reveals the RD-CTCF in the form of:
C
α
s
(
u
)
n
=
C
I,n
T
s
∞
t=−∞
p
(∗)
(
t
)
n−1
j=1
p
(∗)
t + u
j
e
−j2παt
dt,
(18)
where the cycle frequencies are integer multiples of the
symbol rate (α
= kF
s
with k integer). The RD-CTCF of
the baseband signal is nonzero only for harmonics of the
symbol rate. The amplitude of the features tend to zero as
the harmonic number k increases.
5.2. RF Signals. The RD-CTCF of the RF signal specified by
(2) can be inferred from the RD-CTCF of the baseband signal
s(t) by noting that the RF signal is obtained by modulating
two independent PAM signals in quadrature. We need to
calculate the CTCFs of PAM, sine and cosine signals, and to
combine them using the following rules:
(i) The cumulant of the sum is equal to the sum of the
cumulants if the signals are independent. Therefore,
if y(t)
= x(t)+w(t)wherex(t)andw(t) are two
independent random signals, we have:
C
y
(
t, τ
)
n
= C
x
(
t, τ
)
n
+ C
w
(
t, τ
)
n
(19)
and, after Fourier transform, we obtain:
C
α
y
(
τ
)
n
= C
α
x
(
τ
)
n
+ C
α
w
(
τ
)
n
.
(20)
(ii) The moment of the product is equal to the product
of the moments if the signals are independent.
Therefore, if y(t)
= x(t) w(t)wherex(t)andw(t)
6 EURASIP Journal on Wireless Communications and Networking
are two independent random signals, we have:
R
y
(
t, τ
)
n
= R
x
(
t, τ
)
n
R
w
(
t, τ
)
n
(21)
and, after Fourier transform, we obtain:
R
α
y
(
τ
)
n
=
γ
R
α−γ
x
(
τ
)
n
R
γ
w
(
τ
)
n
.
(22)
Equation (22) means that we have to multiply all
CTMFs of x(t)andw(t) which sum to α. If one of the
signals is nonrandom (w(t) in our case), the CTMF
of the random signal can be replaced by its CTCF:
C
α
y
(
τ
)
n
=
γ
C
α−γ
x
(
τ
)
n
R
γ
w
(
τ
)
n
.
(23)
The CTCFs of the baseband PAM signals can be com-
puted using (18). The only difference with a QAM signal
resides in the cumulant of the symbol sequence C
I,n
,which
must be computed for PAM symbols through (16)and(17)
(see the binary PAM case in the appendix).
The CTMF of the sine and cosine signals can easily be
determined from the expression of their lag-products:
R
α
cos
(
t, τ
)
n
= lim
T →∞
1
T
T/2
−T/2
n
j=1
cos
ω
c
t + φ
j
e
−i2παt
dt
R
α
sin
(
t, τ
)
n
= lim
T →∞
1
T
T/2
−T/2
n
j=1
sin
ω
c
t + φ
j
e
−i2παt
dt,
(24)
where φ
j
= ω
c
τ
j
. The lag-product can be decomposed into
a sum of cosine signals at various frequencies using Simpson
formulas:
L
cos
(
t, τ
)
2
=
1
2
cos
2ω
c
t + φ
1
+ φ
2
+
1
2
cos
φ
1
−φ
2
L
sin
(
t, τ
)
2
=−
1
2
cos
2ω
c
t + φ
1
+ φ
2
+
1
2
cos
φ
1
−φ
2
(25)
for the second order, and:
L
cos
(
t, τ
)
4
=
1
8
cos
4ω
c
t −φ
1
−φ
2
−φ
3
−φ
4
+
1
8
cos
2ω
c
t + φ
1
+ φ
2
+ φ
3
−φ
4
+cos
2ω
c
t + φ
1
+ φ
2
−φ
3
+ φ
4
+cos
2ω
c
t + φ
1
−φ
2
+ φ
3
+ φ
4
+cos
2ω
c
t −φ
1
+ φ
2
+ φ
3
+ φ
4
+
1
8
cos
φ
1
−φ
2
+ φ
3
−φ
4
+cos
φ
1
−φ
2
−φ
3
+ φ
4
+cos
φ
1
+ φ
2
−φ
3
−φ
4
L
sin
(
t, τ
)
4
=
1
8
cos
4ω
c
t −φ
1
−φ
2
−φ
3
−φ
4
−
1
8
cos
2ω
c
t + φ
1
+ φ
2
+ φ
3
−φ
4
+cos
2ω
c
t + φ
1
+ φ
2
−φ
3
+ φ
4
+cos
2ω
c
t + φ
1
−φ
2
+ φ
3
+ φ
4
+cos
2ω
c
t −φ
1
+ φ
2
+ φ
3
+ φ
4
+
1
8
cos
φ
1
−φ
2
+ φ
3
−φ
4
+cos
φ
1
−φ
2
−φ
3
+ φ
4
+cos
φ
1
+ φ
2
−φ
3
−φ
4
(26)
for the fourth order. It is clear that the CTMF of sine or cosine
signals is made of Dirac’s deltas at cycle frequencies 4 f
c
,2f
c
,
and 0.
Since the real and imaginary parts of s(t) are two
statistically independent PAM signals, the CTCF of s
RF
(t)
is the sum of two CTCFs of modulated PAM signals in
quadrature. The CTCFs of R[s(t)] and I [s(t)] are equal and
denoted by C
α
PAM
(τ)
n
in our next results. We can finally write:
C
α
s
RF
(
u
)
n
=
γ
C
α−γ
PAM
(
u
)
n
R
γ
cos
(
u
)
n
+ R
γ
sin
(
u
)
n
.
(27)
For n
= 2, we observe the destructive interference between
the components of
R
γ
cos
(u)
2
and R
γ
sin
(u)
2
at twice the carrier
frequency, as was introduced in Section 3.
For n
= 4, we also observe that the components of
R
γ
cos
(u)
4
and R
γ
sin
(u)
4
at twice the carrier frequency cancel
out, just as they do for the second order. There only remain
the features at zero and four times the carrier frequency:
C
0
s
(
u
)
4
C
0
PAM
(
u
)
4
R
0
cos
(
u
)
4
+ R
0
sin
(
u
)
4
=
2C
0
PAM
(
u
)
4
R
0
cos
(
u
)
4
C
4 f
c
s
(
u
)
4
C
0
PAM
(
u
)
4
R
4 f
c
cos
(
u
)
4
+ R
4 f
c
sin
(
u
)
4
=
2C
0
PAM
(
u
)
4
R
4 f
c
cos
(
u
)
4
.
(28)
Since
R
0
cos
(u)
4
is a sum of cosines that depend on u and
R
4 f
c
cos
(u)
4
= (1/16)e
jω
c
(−)
i
φ
i
(the notation (−)
i
indicates an
optional sign change according to the expressions (25)-(26)),
the features
C
4 f
c
s
(u)
4
are six times smaller than the features
C
0
s
(u)
4
(at least when u is null) and are therefore less suited
for sensing scenarios.
5.3. Baseband and RF Fourth-Order Features. We have t o
choose between baseband or RF signals and decide on
the cycle frequency that will be used by the detector. We
have seen that baseband QAM signals have features at the
cycle frequencies that are multiples of the symbol rate
(0, F
s
,2F
s
), whereas RF signals have additional features
EURASIP Journal on Wireless Communications and Networking 7
−30
−20
−10
l
2
0
10
20
30
−30 −20 −10 0
l
1
10 20 30
0.1
0.2
0.3
0.4
0.5
0.6
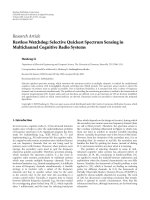
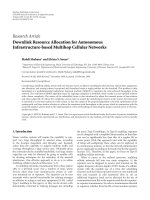
Figure 3: Fourth-order RD-CTCF of a 4-QAM baseband signal as
a function of the lag parameters l
1
and l
2
for the cycle frequency 0.
The values of l
0
and l
3
have been fixed to 0 and 3 respectively. The
system parameters are: 1 MHz symbol frequency, 10 MHz sample
frequency, normalized square-root Nyquist pulse shaping filter of
0.2 roll-off factor.
at cycle frequencies that depend on the carrier frequency
(4 fc+0,4fc+ F
s
,4fc +2F
s
). It has been shown that
these additional features are small and that the strongest
feature for both baseband and RF signals is obtained when
the cycle frequency α is equal to zero. Since noise signals
do not have any fourth-order feature (the fourth-order
cumulant of a Gaussian random variable is equal to zero),
even when α
= 0. Note that α = 0isadegenerated
cycle frequency, which is present even in stationary signals.
However, since it gives the strongest 4th-order feature, it is
the frequency that will be preferred for our sensing scenario,
even if the denomination “cyclic-feature detector” becomes
inappropriate in this case.
Simulations made with baseband or RF signals for
α
= 0 have shown that the two detectors exhibit similar
performances. From now on, we will focus on the fourth-
order feature detection for baseband signals and let aside the
fourth-order feature detection for RF signals, as it enables
a significant reduction of the received signal sampling
frequency. The feature obtained in this situation is illustrated
in Figure 3.
6. Fourth-Order Feature Detectors
6.1. RD-CTCF Estimator. In order to estimate the RD-CTCF
of the baseband QAM signal, we would have to use (14).
Luckily, the signal is complex and the second order features
disappear if we do not use any conjugation in the lag
product (see the quaternary QAM example in the appendix).
Therefore the RD-CTCF is equal to the RD-CTMF:
C
0
s
(
u
)
4
= R
0
s
(
u
)
4
= lim
T →∞
1
T
T/2
−T/2
L
s
(
t, u
)
4
dt
(29)
In practice, the RD-CTCF is estimated based on a size-
N finite observation window of the received sequence s[n]
obtained after sampling the received signal.
C
s
[
l
]
4
=
1
N
N/2−1
n=−N/2
L
s
[
n, l
]
4
(30)
with N>2max
|l
j
| and l
j
are the elements of the discrete
lag-vector l
of size n −1.
6.2. Noise Mean and Variance. When there is only noise in
the system, the mean of the RD-CTCF is equal to 0 since
the fourth-order cumulant of a Gaussian random variable is
null. On the other hand, the variance of the RD-CTCF is a
function of the lag-vector given by:
σ
2
RD-CTCF
=
⎧
⎪
⎪
⎪
⎪
⎪
⎪
⎪
⎪
⎪
⎪
⎪
⎨
⎪
⎪
⎪
⎪
⎪
⎪
⎪
⎪
⎪
⎪
⎪
⎩
1
N
σ
8
n
if all lag values are different
2
N
σ
8
n
if two lag values are equal
6
N
σ
8
n
if three lag values are equal
24
N
σ
8
n
if all lag values are equal
(31)
in which σ
2
n
is the variance of AWGN noise samples at the
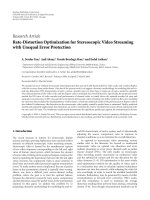
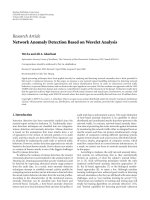
input of the RD-CTCF estimator. Simulations illustrated in
Figure 4 confirm the result (31). Every discrete lag-vector l
for which two or more values l
i
, l
j
are identical should be
avoided, since it increases the noise variance. However, to
afford the luxury of choosing lag values that are different
from zero, we would have to increase the sampling rate at
the receiver, which in turn would increase the noise power.
Simulations have shown that it is better to use the lowest
sampling rate that still satisfies Shannon’s theorem, and set
all lag values equal to zero. The RD-CTCF variance also quite
naturally decreases as the observation window N is increased.
6.3. D etector. The detector has to decide between two
hypotheses: hypothesis H
0
implying that no signal is present,
hypothesis H
1
implying that the linearly modulated signal
is present. The absolute value of the feature (here the RD-
CTCF) is compared to a threshold γ to make a decision:
C
0
s
(
l
)
4
H
1
≷
H
0
γ. (32)
The threshold is usually fixed to meet a target probability
of false alarm (decide H
1
if H
0
).Inordertocomputethe
threshold level as a function of the probability of false alarm,
we must know the distribution of the RD-CTCF. We already
know its mean and variance values and using the central-
limit theorem, we assume that the output distribution is
Gaussian (see also [16]). As a consequence, the absolute value
of the RD-CTCF takes the form of a Rayleigh distribution
and the threshold level can be found using:
γ
=
−σ
2
RD-CTCF
ln P
fa
,
(33)
where P
fa
is the probability of false alarm.
8 EURASIP Journal on Wireless Communications and Networking
−10
−5
l
2
0
5
10
−10 −50
l
1
510
1.5
2
2.5
3
3.5
4
4.5
5
5.5
Figure 4: Noise variance at the output of the RD-CTCF estimator
as a function of the lag parameters l
1
and l
2
for the cycle frequency 0.
The values of l
0
and l
3
have been fixed to 0 and 3, respectively. The
system parameters are: 1 MHz symbol frequency, 10 MHz sample
frequency, σ
2
n
= 10. The number of noise realizations is 1000.
7. Detector Comparison
We will now briefly review the principles of all detectors
previously mentioned in this paper, and compare their
performance and computational complexity. We assume that
second-order and fourth-order detectors work only at a
single location of the feature they exploit (the second-order
detector works at most favorable frequency, the fourth-order
detector works at the most favorable value of the discrete lag-
vector l
). Monte-Carlo simulations were used, each of which
used 5000 iterations.
7.1. Energy Detector. This is the most widely used detector
in wireless communication systems. It averages the square
modulus of the received sequence over time:
ρ
ED
=
1
N
N/2−1
n=−N/2
|s
[
n
]
|
2
.
(34)
Its advantages are its simplicity and its ability to perform
blind detection (since it does not require any information
about the signal it is trying to detect). Unfortunately, it
has been demonstrated that it cannot be used in low-SNR
environments due to its sensitivity to noise uncertainty [6].
7.2. Second-Order Detector. This detector computes an esti-
mation of the SCD by averaging, over time and frequency
domains, the cyclic periodogram of the signal spectrum
S
k
( f ) computed for a finite time window at time k:
ρ
CF2
=
1
K
1
F
K/2−1
k=−K/2
F/2
−1
u=−F/2
S
k
f + u −
α
2
S
∗
k
f + u +
α
2
,
(35)
where K is the number of time windows and F is the number
of frequency bins. It is a much more complex and less
efficient detector, which requires some characteristics of the
signal in order to work (e.g., the symbol rate must be known
in advance). Its advantage resides in the absence of features
(at least asymptotically) when the input signal is a white
noise, which results in the output mean of the detector always
being equal to zero in presence of noise, therefore shielding
the detector from noise uncertainty effects. Its computational
complexity evolves as N
· log
2
(1024) = N.10 if the FFTs
used to evaluate the cyclic periodogram [6] have a length of
1024 samples, and the total number of samples is equal to
N.
7.3. Fourth-Order Detector. This detector averages the lag-
product of the received sequence over time:
ρ
CF4
=
1
N
N/2−1
n=−N/2
s
[
n
]
s
[
n + l
1
]
s
[
n + l
2
]
s
[
n + l
3
]
.
(36)
This detector is simpler to implement than the previous
one (no Fourier transform of the signal is required since we
work in the time domain), which results in a computational
complexity evolving as N, the total number of samples. It
benefits from the same immunity to noise uncertainty, and
is therefore suited for operations at low SNR.
7.4. Performance Comparison. We may now take a look at
the performance of the different detectors. Figure 5 illustrates
the probability of missed detection (decide H
0
if H
1
)curves
as a function of the SNR for the three detectors under
consideration. The threshold has been set in the three cases
to achieve a target probability of false alarm equal to 10
−1
.
These curves have been obtained without adding any noise
uncertainty to the signal. In such conditions, the energy
detector is the optimal detector for blind detection, and can
be considered as a reference. It appears that the second-
order detector and the fourth-order detector, have similar
performances when the SNR is around zero dB: for the same
complexity, (that leads to an observation time ten times
longer for the fourth-order detector), both detectors exhibit
the same probability of missed detection (roughly 1 percent)
at an SNR of
−0.8 dB. However, when we consider an SNR
of
−4 dB, the fourth-order detector requires much more
samples, which makes it more complex than the second-
order. Besides, the detection-time constraints that are part of
the cognitive radios reglementation would not be met if the
observation time is too long.
If we add some amount of noise uncertainty, the
energy detector cannot perform reliable detections and must
be discarded, whereas the cyclic feature detectors remain
unaffected. In order to verify this assumption, we computed
the receiver operating characteristics (ROC) curves of the
fourth-order detector for two situations, one without any
noise uncertainty, and one with 0 dB of noise uncertainty.
The results are illustrated in Figure 6. We observe that the
energy detector, which had the best ROC curve in the first
case is a lot more affected by the noise uncertainty than
the fourth-order detector. ROC curves for the second-order
detector can be found in [7], and show the same immunity
to noise uncertainty than the fourth-order.
EURASIP Journal on Wireless Communications and Networking 9
10
−4
10
−3
P
fa
and P
md
10
−2
10
−1
10
0
−20 −16 −14−18
4th order detector Energy detector
Pfa2nd order detector
−12 −10
SNR
−8 −6 −4 −20
T
= 10000μs T = 500 μs
T
= 50μs
Figure 5: Energy, second-order and fourth-order detector proba-
bility of missed detection (the solid lines) for a fixed probability
of false alarm (the points at 10
−1
). The system parameters are:
baseband QPSK signal with 20 MHz symbol frequency, 40 MHz
sample frequency, square-root Nyquist pulse shaping filter of 0.2
roll-off factor. No noise uncertainty added. The second-order
detector is set to detect the symbol-rate feature (cf
= 20 MHz), and
the fourth-order detector works with the feature at four-times the
carrier frequency, which is equal to zero in the present situation
(cf
= 0 MHz).Two observation times are considered for the three
detectors: 50 and 500 μs. An observation time of 10 ms has been
added for the fourth-order detector
8. Conclusion
This paper has started from the need for robust detectors
able to work in low SNR environments. A brief review of
the second-order cyclostationarity and second-order cyclic
feature detectors has exposed the advantages and drawbacks
of such detectors, and explained the intuition that lead to
the study of higher-order cyclostationarity (HOCS). The
main guideline is to identify features of sufficient strength
and to design a detector able to extract it from the signal.
The most relevant aspects of HOCS theory have then been
analyzed and we have derived a new fourth-order detector
that can be used for the detection of linearly modulated
signals. Simulation results have shown that fourth-order
cyclicfeaturedetectorsmaybeusedasasubstitutefor
second-order detectors at SNR around zero dB, which could
be needed if the received signals do not exhibit second-order
cyclostationarity.
Appendices
A. Cumulants of the Binary PAM
This section computes the second- and fourth-order cumu-
lants of a binary PAM sequence. The symbols take the values
I
m
={±1}.
0
0.1
0.2
0.3
0.4
0.5
0.6
Pd
0.7
0.8
0.9
1
00.1
eng (-inf dB) eng (0 dB)
cf4 (0 dB)cf4 (-inf dB)
0.2
Pfa
0.30.40.5
Figure 6: Energy (eng) and fourth-order detector (cf4) ROC
curves for two values of the noise uncertainty (no uncertainty, 0 dB
uncertainty). The system parameters are: 1 MHz symbol frequency,
4 MHz sample frequency, square-root Nyquist pulse shaping filter
of 0.2 roll-off factor, SNR
= −2dB.
A.1. Second-Order Cumulant. There are 2 possible partitions
of the set
{1, 2}: {1, 2} and {1}{2}. Since the binary PAM
constellation is symmetric, only the first partition has a
chance to give a product of moments different from 0. We
will limit our investigations to the first partition.
The partition
{1, 2} gives R
I,2
= 1 for its single element,
so that C
I,2
= 1.
A.2. Fourth-Order Cumulant. There are 14 possible parti-
tions of the set
{1, 2,3, 4}, but only the ones that group I
k
bytwoorfourhaveachancetogiveaproductofmoments
different from 0, which reduces the number of interesting
partitions to four:
{1, 2,3, 4}; {1,2}{3, 4}; {1,3}{2, 4} and
{1, 4}{2,3}.
The first partition
{1, 2,3, 4} gives R
I,4
= 1 for its single
element, and the three last partitions
{1, 2}{3,4}; {1, 3}{2, 4}
and {1, 4}{2, 3} give R
I,2
= 1 for their two elements, so that
C
I,4
=−2.
B. Cumulants of the Quaternary QAM
This section computes the second- and fourth-order cumu-
lants of a 4-QAM sequence. The symbols take the values
I
m
={±1/
√
2 ± j/
√
2}.
B.1. Second-Order Cumulants. There are 2 possible parti-
tions of the set
{1, 2}: {1, 2} and {1}{2}. Since the 4-QAM
constellation is symmetric, only the first partition has a
chance to give a product of moments different from 0. We
limit therefore our investigations to the first partition.
Different results are obtained according to the number of
conjugations in the lag-product (10):
10 EURASIP Journal on Wireless Communications and Networking
(i) When no conjugation or two conjugations are used
in the lag-product, the partition
{1, 2} gives R
I,2
= 0
for its single element, so that C
I,2
= 0.
(ii) When one conjugation is used in the lag-product, the
partition
{1, 2} gives R
I,2
= 1 for its single element,
so that C
I,2
= 1.
B.2. Fourth-Order Cumulant. There are 14 possible parti-
tions of the set
{1, 2,3, 4}, but only the ones that group I
k
bytwoorfourhaveachancetogiveaproductofmoments
different from 0, which reduces the number of interesting
partitions to four:
{1, 2,3, 4}; {1,2}{3, 4}; {1,3}{2, 4} and
{1, 4}{2,3}.
Different results are obtained according to the number of
conjugations in the lag-product (10):
(i) When no conjugation or four conjugations are used
in the lag-product, the first partition
{1, 2,3, 4} gives
R
I,4
=−1 for its single element, and the three last
partitions
{1, 2}{3,4}; {1, 3}{2, 4} and {1, 4}{2, 3}
give R
I,2
= 0 for their two elements, so that C
I,4
=−1.
(ii) When two conjugations are used in the lag-product,
arbitrary placed for this example on the second
and fourth element of the lag-product, the partition
{1, 2,3, 4}gives R
I,4
= 1 for its single element, the two
partitions
{1, 2}{3,4} and {1, 4}{2, 3} give R
I,2
= 1
for their two elements, and the partition
{1, 3}{2,4}
gives R
I,2
= 0 for its two elements, so that C
I,4
=−1.
(iii) When one or three conjugations are used in the
lag-product, the partition
{1, 2,3, 4} gives R
I,4
= 0
for its single element, and the three last partitions
{1, 2}{3,4}; {1,3}{2, 4}and {1,4}{2, 3}give R
I,2
= 0
for at least one of their two elements, so that C
I,4
= 0.
References
[1] F. C. Commission, “FCC-03-322: Facilitating Opportunities
for Flexible, Efficient, and Reliable Spectrum Use Employing
Cognitive Radio Technologies,” December 2003.
[2] I.F.Akyildiz,W Y.Lee,M.C.Vuran,andS.Mohanty,“NeXt
generation/dynamic spectrum access/cognitive radio wireless
networks: a survey,” Computer Networks, vol. 50, no. 13, pp.
2127–2159, 2006.
[3] A. Sahai and D. Cabric, “Spectrum sensing: fundamental
limits and practical challenges,” in Proceedings of IEEE Inter-
national Symposium on New Frontiers in Dynamic Spectrum
Access Networks (DySPAN ’05), Baltimore, Md, USA, Novem-
ber 2005.
[4] H. Urkowitz, “Energy detection of unknown deterministic
signals,” Proceedings of the IEEE, vol. 55, no. 4, pp. 523–531,
1967.
[5] R. Tandra, Fundamental limits on detection in low SNR,M.S.
thesis, Berkeley, Calif, USA, 2005.
[6] W. A. Gardner, “Signal interception: a unifying theoretical
framework for feature detection,” IEEE Transactions on Com-
munications, vol. 36, no. 8, pp. 897–906, 1988.
[7] W. A. Gardner and C. M. Spooner, “Signal interception:
performance advantages of cyclic-feature detectors,” IEEE
Transactions on Communications, vol. 40, no. 1, pp. 149–159,
1992.
[8] W. A. Gardner, Statistical Spectral Analysis: A Nonprobabilistic
Theory, Prentice-Hall, Englewood Cliffs, NJ, USA, 1987.
[9] W. A. Gardner and C. M. Spooner, “Cumulant theory of cyclo-
stationary time-series, part I: foundation,” IEEE Transactions
on Signal Processing, vol. 42, no. 12, pp. 3387–3408, 1994.
[10] C. M. Spooner and W. A. Gardner, “Cumulant theory of cyclo-
stationary time series, part II: development and applications,”
IEEE Transactions on Signal Processing, vol. 42, no. 12, pp.
3409–3429, 1994.
[11] K. Kim, I. A. Akbar, K. K. Bae, J S. Um, C. M. Spooner, and
J. H. Reed, “Cyclostationary approaches to signal detection
and classification in cognitive radio,” in Proceedings of the 2nd
IEEE International Symposium on New Frontiers in Dynamic
Spectrum Access Networks (DySPAN ’07), pp. 212–215, Dublin,
Ireland, April 2007.
[12]P.D.Sutton,K.E.Nolan,andL.E.Doyle,“Cyclostationary
signatures in practical cognitive radio applications,” IEEE
Journal on Selected Areas in Communications,vol.26,no.1,pp.
13–24, 2008.
[13] A. Tkachenko, D. Cabric, and R. W. Brodersen, “Cyclostation-
ary feature detector experiments using reconfigurable BEE2,”
in Proceedings of the 2nd IEEE International Symposium on New
Frontiers in Dynamic Spectrum Access Networks (DySPAN ’07),
pp. 216–219, Dublin, Ireland, April 2007.
[14] V. Turunen, M. Kosunen, A. Huttunen et al., “Implementation
of cyclostationary feature detector for cognitive radios,” in
Proceedings of the 4th International Conference on Cogni-
tive Radio Oriented Wireless Networks and Communications
(CROWNCOM ’09), Hannover, Germany, June 2009.
[15] O. A. Dobre, Y. Bar-Ness, and W. Su, “Higher-order cyclic
cumulants for high order modulation classification,” in Pro-
ceedings of IEEE Military Communications Conference (MIL-
COM ’03), pp. 112–117, October 2003.
[16] A. V. Dandawate and G. B. Giannakis, “Statistical tests for
presence of cyclostationarity,” IEEE Transactions on Signal
Processing, vol. 42, no. 9, pp. 2355–2369, 1994.