báo cáo hóa học:" Overview of principles and implementations to deal with spatial issues in monitoring environmental effects of genetically modified organisms" pot
Bạn đang xem bản rút gọn của tài liệu. Xem và tải ngay bản đầy đủ của tài liệu tại đây (1.16 MB, 17 trang )
This Provisional PDF corresponds to the article as it appeared upon acceptance. Fully formatted
PDF and full text (HTML) versions will be made available soon.
Overview of principles and implementations to deal with spatial issues in
monitoring environmental effects of genetically modified organisms
Environmental Sciences Europe 2012, 24:6 doi:10.1186/2190-4715-24-6
Winfried Schroder ()
Gunther Schmidt ()
ISSN 2190-4715
Article type Review
Submission date 30 September 2011
Acceptance date 30 January 2012
Publication date 30 January 2012
Article URL />This peer-reviewed article was published immediately upon acceptance. It can be downloaded,
printed and distributed freely for any purposes (see copyright notice below).
For information about publishing your research in Environmental Sciences Europe go to
/>For information about other SpringerOpen publications go to
Environmental Sciences Europe
© 2012 Schroder and Schmidt ; licensee Springer.
This is an open access article distributed under the terms of the Creative Commons Attribution License ( />which permits unrestricted use, distribution, and reproduction in any medium, provided the original work is properly cited.
Overview of principles and implementations to deal with spatial issues in
monitoring environmental effects of genetically modified organisms
Winfried Schröder
†1
and Gunther Schmidt*
†1
1
Chair of Landscape Ecology, Universität Vechta, PO Box 15 53, Vechta, 49364, Germany
*Corresponding author:
†
Contributed equally
Email addresses:
WS:
GS:
Abstract
The approval of genetically modified organisms [GMO] for deliberate release and placing on
the market requires GMO environmental risk assessment [ERA] and GMO environmental
monitoring [EM]. Both GMO ERA and GMO EM are still under discussion. The goal of this
article is, firstly, to analyse principles of GMO EM as published in the Association of German
Engineers [VDI] Guideline 4330 Part 1, focusing on the characterisation of the receiving
environment affected by GMO cultivation and the representativeness of GMO EM to assess
large-scale implications of GMO cultivation. Secondly, the article introduces measures to
meet these issues by the use of map data and statistics within a geographical information
system [GIS]. Finally, three case studies exemplify the application of data and methods. To
deal with spatial issues of GMO EM as outlined in the VDI Guideline 4330 Part 1, a GIS-
based approach is presented. It relies on both spatial data collected from several sources
which were derived from sample point data and geostatistical and multivariate statistical
methods within a GIS environment. Data used for describing the receiving environment and
for planning and evaluating monitoring schemes comprise information about land use,
climate, phenology, soil coverage, species distribution and ecoregions. The case studies deal
with (1) ecological land classification for characterisation of GMO-receiving environments
and representative EM, (2) selection of representative sites for modelling GMO dispersal, and
(3) delineation and mapping of segregation distances. Even a systematic and stepwise-
structured risk assessment cannot cover all risk relevant questions, especially large-scale,
long-term and combinatory effects which may not occur before the conventional application
of the respective GMO. Hence, GMO EM is crucial to deal with unanticipated and
undesirable effects. The article gives an overview of a GIS implementation and relevant
geodata promoting GMO EM.
Background
In the European Union [EU], the release of genetically modified organisms [GMO] into the
environment is regulated by EU Directive 2001/18/EC [1]. Accordingly, post-market
environmental monitoring of genetically modified plants [GMP EM] has to be implemented
to detect and prevent adverse effects on human health and the environment. However, no
general strategies for GMP EM have been established so far. In Germany, one EM strategy
discussed is the Guideline 4330 Part 1 published by the Association of German Engineers
[VDI] [2]. It applies to the monitoring of ecological effects of GMP, but does not address
possible effects of GMP on human health. Contrary to the directive of the European
Community [1] and the study of Sanvido et al. [3], the guideline of the VDI [2] does not
differentiate between case-specific monitoring [CSM] and general surveillance [GS]. CSM
should focus on anticipated effects of a specific GMP based on pre-market risk assessment,
whereas GS is designed to detect unanticipated adverse effects which were not covered by
risk assessment comprising, for instance, cumulative and long-term effects.
The VDI [2] covers ecological effects of GMP encompassing direct, indirect, immediate and
delayed as well as cumulative long-term effects. Environmental effects of GMP can occur on
several levels of ecological organization in terms of structures and underlying functions, and
correlated levels of time and space which have to be covered by GMP EM [4]. The VDI [2]
provides planning and implementation criteria for GMP EM and forms the framework for
technical instructions with respect to the levels mentioned above, items to be protected,
protection targets and checkpoints. GMP EM should allow evaluating the condition of the
items to be protected and to track the accomplishment of protection targets. The required
parameters have to be collected using validated and standardised methods.
Since protection targets and checkpoints may not only be influenced by GMP, it is necessary
to differentiate between GMP-related effects and those that are not related to GMP.
Accordingly, data on items to be protected and protection targets without influence of GMP
must also be compiled. To reach this requirement, temporal and spatial comparisons are
needed: The environmental baseline status prior to the introduction of GMP has to be
compared to the situation after GMP release regarding the selected checkpoints. The
reliability of reference data depends on the period within the reference conditions were
monitored before introducing GMP (temporal comparison). Additionally, GMP-free regions
have to be compared to those where GMP are cultivated. This requires a reference system
where both conditions are monitored simultaneously (spatial comparison). Reference sites
should be as similar as possible to GMP-influenced areas considering the receiving
agricultural environment. GMP areas and reference areas, however, can also be subjected to
changes that are not caused by GMP. Thus, a thorough selection of monitoring areas is
essential for monitoring potential ecological effects due to GMP cultivation. Besides the GMP
fields and their surroundings, representative types of ecosystems that will potentially be
affected should be considered as well. EM areas should be selected using a statistically
substantiated procedure according to technically suitable representation criteria. The EM areas
should be linked to other appropriate EM networks. In the long term, spatial rearrangement of
EM areas is necessary regarding new effect relationships and spatial arrangement of land use
patterns.
The GMP EM measuring data should be analysed on the basis of metadata describing them
and by suitable (geo)statistical procedures. The documentation of measured variables,
methods, survey intervals and areas must be carried out according to standard methods and
using a main meta-database or several interrelated databases. Meta-databases should help
evaluate on to what extent the data records can be compared with one another for assessment.
Based on the basic considerations as laid down in the guideline of the VDI [2] and
summarised above, some research projects aimed at dealing with GMP EM at a landscape
level and at developing techniques for supporting the application of the respective EM
strategies. In the following, we refer to some of the respective methods and results and,
thereby, concentrate on the setting in Germany as an example.
Methods and data
The following sections contain an overview of procedures implemented in a geographic
information system [GIS] including geostatistics, multivariate statistics and geodata to (1)
characterize the GMP-receiving environment, (2) to assess the spatial representativeness of
GMP EM sites and (3) to assess large-scale and long-term effects of GMP cultivation. In
Germany, several research projects dealt with these issues, and some of the methods applied
and results achieved are outlined. It is shown that geodata are useful to describe the receiving
environment in the near and far vicinities of GMP fields. Statistical analyses and classification
of geodata are presented which serve to derive ecoregions, e.g. climatic and agricultural
patterns and, thereby, help for assessing the representativeness of running or planned GMP
EM sites and for investigating adverse ecological effects of GMP release on different spatial
scales and for different agricultural regimes [5-11].
Geostatistics is a point-pattern analysis that generates surface predictions from data points.
This relies on investigating and modelling the spatial autocorrelation among sample data by
variogram analysis. In order to apply kriging for interpolation, it is necessary to adapt a
defined variogram model to the experimental variogram. Based on the variogram model,
several kriging methods can be used for spatial predictions which finally are mapped [12]. For
the interpretation of the kriging estimations, a cross-validation has to be performed.
Multivariate statistics such as cluster analysis or tree-based models, two of them are the
classification and regression trees [CART] and chi-squared automatic interaction detection
(CHAID), serve to spatially differentiate the multiple relationships between geodata stored in
a GIS. Based on these relations, predictions in time and space become possible as well as the
characterisation of the receiving environment in terms of ecoregions [13-18]. In the context of
GMP dispersal, cluster analysis can be used to integrate measurement data from different
meteorological networks with different coverage in a GIS environment for defining
representative climatic regions. Climatic regions together with an ecological land
classification were used to stratify the receiving environment in order to select a
representative number of sites for modelling the GMP dispersal [10].
Geodata on meteorology, land use, local biodiversity and agricultural management schemes
are needed for monitoring and modelling dispersal and persistence of GMP as well as
planning GMP EM with respect to coexistence issues in agricultural landscapes. The data
described in the following have been collected from several sources or have been calculated
from sample point data by the use of the above mentioned statistical methods in a GIS
environment described by Kleppin et al. [19].
Land use data can be obtained from either satellite images, GIS data collected during field
experiments, cadastral surveys provided by local land registries, vertical air photographs or
the Common Agricultural Policy notifications, each type of source being used at different
scales and consequently provide different spatial and semantic resolutions. To some extent,
data on field geometries providing detailed information on agricultural land use can be
obtained from the Integrated Administration and Control System (InVeKoS) database, which
is an important tool for the EU member states to regulate agricultural subsidies. In fact, due to
legal restrictions and inconsistencies in data harmonisation which is due to federal
responsibilities, this dataset is not available for public use [9]. Based on satellite images, data
on land use patterns are offered by the European Topic Centre on Land Use and Spatial
Information [20], where the distribution of the CORINE Landcover maps is administrated
[21]. Data on the cultivation of crops in Europe are available at the Statistical Office of the
European Communities [22], which offers data on various topics, among of which is also
agriculture. The main cropping areas of oilseed rape are located in northeast Germany as well
as in the Alsace in France. In these regions, oilseed rape is cultivated on up to 25% of the
arable land. Due to the increased cultivation of energy plants, it can be assumed that the
cultivation of maize (biogas) and oilseed rape (biodiesel) will be intensified in the future. For
Germany, it can be stated that in 2007, there was an increase in maize cultivation of 9.6% and
of 8.8% for oilseed rape cultivation compared to those in 2006.
For large-scale analyses of GMP impacts, meteorological data are needed. These are, for
example, data on precipitation, air temperature, sunshine duration, the number of frost days
and wind conditions. Climate affects the growth, persistence and dispersal of GM crops and
their pollen and seeds. These data could be retrieved from meteorological stations, which are
usually widespread in Europe. However, depending on the required climatic element
(precipitation, air temperature, wind or solar radiation), the number of monitoring sites and,
thus, the validity of assumptions based on these data are different. For example, in France, the
spatial density of monitoring sites collecting data on precipitation is two times more dense
than on temperature, four times more than on wind and ten times more than on solar radiation.
In Germany, the number of meteorological monitoring sites differs quite more. The German
Weather Service operates about 4,400 precipitation sites, but only 660 stations for air
temperature and 220 for solar radiation. Therefore, interpolations or extrapolations may be
necessary, covering the whole territory of a country. For Europe, free datasets with a
resolution of 10 arc min (approximately 20 × 20 km) are available at the Climatic Research
Unit (CRU) [23, 24]. For modelling the pollen transport, phenological data on the flowering
of GM crops should be considered, too. It should be taken into account that global warming
might have changed the temperature-induced beginning of rape and maize bloom [18, 25].
Furthermore, modelling pollen dispersal requires data on wind regimes. The dynamics of
pollen transport can be described by compiling and processing data on wind direction and
velocity. The wind direction influences the transport direction of the pollen and, thus,
potential areas of exposure. Given a constant emission rate, the wind velocity affects the
range and the transport speed of airborne pollen and leads to a dilution (stretching); as with
higher wind velocities, a larger air volume passes the source surface, and the concentration
per unit volume is reduced [26].
Data on soil texture and soil types are available from the Food and Agriculture Organization
[FAO]: (1) the Digital Soil Map of the World (about 10 × 10 km
2
) [27] and (2) the
Harmonized World Soil Database (about 1 × 1 km
2
) [28]. Data on the potential natural
vegetation which can be used for ecological land classification can be obtained from the
Federal Agency of Nature Conservation (BfN) in Germany [29]. The potential natural
vegetation [PNV] map stratifies Europe into more than 700 PNV units. The PNV can be
defined as the vegetation that could be established without human interference under present
climatic and soil conditions and is an integral indicator for the ecological conditions in
terrestrial ecosystems [16].
For biodiversity data in the detection of adverse effects on biodiversity, a link between GMP
and biodiversity monitoring is imperative [30, 31]. It has to be expected that due to a large-
scale commercial use of GMP, adverse effects on biodiversity become substantial.
Biodiversity monitoring schemes could provide information on potential threats induced by
GMP. For instance, biodiversity monitoring is able to detect the potential invasiveness of GM
crops and the potentially enhanced mortality of non-target organisms, and it may also draw a
more general picture on potential effects on the countryside biodiversity. In Europe, several
biodiversity monitoring networks exist due to the Convention on Biodiversity, which commits
its signatory countries to identify and monitor national biodiversity. However, these
monitoring networks are poorly connected, and data are usually available only on a local or
national level [32], whereas the monitoring of birds and butterflies is well established over
long periods in some European countries (e.g. >30 years in the UK), allowing an assessment
of changes at several trophic and geographical scales [33, 34]; monitoring is not in the same
quality established across taxonomic groups relevant for GMP EM. Only few larger scale
monitoring schemes of plants exist [35]. As of September 2007, the EuMon database
comprised 552 complete monitoring schemes covering approximately 4,000 species and 145
different habitat types and addresses of 239 monitoring coordinators and institutions.
Furthermore, the database contains information on sampling methods.
Changes of biodiversity due to GMP cultivation must be extractable from the background
noise of sampling variability and population fluctuations. This is only possible if a
considerable amount of sites is frequently and accurately monitored and if reference areas, i.e.
areas without potential influence of GMP, are monitored at the same time and with the same
accuracy. Even though the EuMon database is the largest collection of metadata on
biodiversity monitoring available, it is not comprehensive and might be confounded by biases
in observation accuracy [36]. Besides the EuMon database, there are only few more data
sources where information on biodiversity or distribution of plant species - that may, for
instance, serve as crossbreeding partners of GMP - may be obtained. The Global Biodiversity
Information Facility [37] enables free and open access to biodiversity data worldwide via the
Internet to support sustainable development. An information system was built to allow the
linkage of diverse data types from disparate sources, promoting capacity building and
catalysing development of analytical tools for improved decision-making. A special
application concerning forest data and the distribution of forest tree species is available
through the European Forest Genetic Resources Programme [38], which is a collaborative
programme among European countries to promote conservation and sustainable use of forest
genetic resources. There is information available describing the spatial distribution of about
40 tree species occurring all over Europe. Data are stored as JPEG files but also as shape files
for usage within a GIS environment. DIVA-GIS [39] is a free and open-source GIS to
generate and analyse worldwide maps on species distribution data. DIVA-GIS was developed
at the International Potato Center [40]. In Germany, the Federal Agency for Nature
Conservation (BfN) maintains the web application FloraWeb [41], where information on
about 3,500 plant species are stored containing details on e.g. taxonomy, biology and spatial
distribution of plants in Germany. An interactive web application illustrates the distribution of
the PNV [29] in Germany. A Java applet allows mapping selected plant species in a spatial
differentiation based on cadastre maps (scale 1 is 25,000; ≈11 × 11 km
2
).
A crucial problem for spatial analyses is the availability of data on the distribution of present
pests. For the federal state of Brandenburg, there were data collected on a district level
regarding the spatial distribution of the European corn borer (Ostrinia nubilalis) which was
one reason for the introduction of Bt maize. Figure 1 depicts the distribution of the corn borer
in the federal state of Brandenburg for the years 2005, 2006 and 2007.
Some of the data and methods presented above have been used in several case studies which
have been conducted according to selected aspects of the VDI Guideline 4330 Part 1 [2].
Three of them are summarised below: (1) ecological land classification for characterisation of
GMP-receiving environments and representative EM, (2) selection of representative sites for
modelling GMP dispersal and (3) delineation and mapping of isolation zones.
Results and discussion
Case study 1: ecological land classification for characterisation of the GMP-receiving
environment and implementation representative EM
The VDI Guideline 4330 Part 1 [2], the German Federal Nature Protection Law (Section 6 of
the Bundesnaturschutzgesetz), the environmental monitoring concept of the Federal Ministry
for the Environment, Nature Conservation and Nuclear Safety [42] as well as the preamble of
the administrative agreement between the German government and the federal states on the
exchange of environmental data specify the following targets that should be complied with
when carrying out environmental monitoring: The monitoring should be coordinated and
based on harmonised or standardised methods [43] so that the data can be compared and used
for statistical analysis and modelling. The monitoring data should allow for spatial
extrapolation in order to bridge geographical gaps and for supporting long-term research on
environmental changes. The flow of data should be efficient, and the data should be available
for scientists, especially for statistical testing of hypotheses and modelling data. The latter
aspect also implies important technical issues because of the enormous amount of information
and data collected. For example, environmental monitoring networks require information
exchange, which has to be supported by an adequate and efficient information platform that
handles documentation and exchange of metadata (site descriptions, quality control data),
measuring data and geodata. An appropriate tool to achieve these goals is the implementation
of a web-based GIS that contains relevant geodata and offers tools for integration of
information of related environmental monitoring networks and tools for data analysis. Such
information platforms help in reducing GMP EM costs and enable data and information
exchange between different stakeholders, involving farmers, legal authorities and the public.
Long-term and indirect effects of any new technology present a challenge to risk assessment.
Post-release GMP EM provides mechanisms for the early detection of any adverse effects, but
the challenge for scientific committees, applicants and regulators is to identify the key areas
of uncertainty and to design appropriate monitoring and surveillance methods. Small plots and
laboratory studies are unlikely to prove useful in such an evaluation. Therefore, appropriate
large-scale monitoring, experimentation and modelling are needed to determine the impact on
the landscape from GMP trait characteristics [44]. GMP monitoring should cover both the
GMP concerned and the potential receiving environment. GMP ERA and EM should
comprise the evaluation of the characteristics of the GMP and its effects and stability in the
environment, combined with ecological characteristics of the environment in which the
introduction will take place. Thus, EM of GMP impacts should be implemented regarding
description, explanation and modelling of environmental changes potentially due to GMP
cultivation.
The requirements mentioned above imply that the EM network should cover the ecologically
defined land classes in the respective country without gaps by a statistically adequate number
of EM sites. This ecological representativeness is crucial for the validity of the EM sampling
data [45, 46]. Thus, monitoring and modelling of GMP dispersal should be performed at
locations which are representative for larger areas with respect to those factors which
potentially influence the dispersal, as for instance natural land characteristics such as wind
conditions. Following this concept, ecoregions can be used to extrapolate modelling results
(up-scaling) calculated for specific agricultural and environmental conditions at single
locations to those areas where similar conditions exist, i.e. regions belonging to the same
ecoregion. Additionally, GMP EM should take place in areas exposed to GMP, preferably
cultivated fields and their environment, but should also include regions with no or unknown
GMP exposure as reference areas. On a case-by-case basis, depending on the GMP
characteristics, the selected indicators, checkpoints and related analytical methods should
consider different relevant spatial and temporal scales [2, 6]. The number of monitoring sites
and regions needs to be sufficient to support statistical analysis of results based on good
scientific practice [47-49]. For each GMP monitoring, design and data analyses should be
based on appropriate scales of space and time, and the quality and quantity of data should be
representative and interpretable. Criteria for selecting monitoring sites and regions include
representativeness of sites cultivated with specific GMP, with emphasis on regions repeatedly
cultivated with GMP; representativeness of ecological regions containing the spectrum of
relevant indicators; availability of sites already monitored within other environmental
programmes; and areas with environmental conditions facilitating spread or survival of GMP
[4, 50].
In order to check the representativeness of existing EM networks which might be appropriate
for EM GMP or for establishing specific EM GMP networks, ecoregionalisations are
appropriate measures. For Europe and Germany, ecological land classifications were
calculated by means of multivariate statistics and based on digital maps depicting the spatial
patterns of ecologically relevant land characteristics. For both Germany and some federal
states, ecoregions were calculated by applying CART and using surface maps on climate,
altitude, soil and potential natural vegetation [6, 16]. The resulting maps have a spatial
resolution of 2 × 2 and 1 × 1 km
2
. The land classification calculated for Europe by means of
CART [13] subdivides the whole territory into ecoregions mapped in a grid with a cell size of
about 20 × 20 km
2
. Data used for calculating the ecoregions are maps on the PNV [29], on
altitude (Global Land One-kilometer Base Elevation/GLOBE) [51], on soil texture (Digital
Soil Map of the World/DSMW) [27] as well as on monthly averages on air temperature,
sunshine duration, relative humidity and precipitation (Global Climate Dataset CL 2.0) [23].
The PNV was set as the target variable, whereas the above mentioned maps on altitude, soil
texture and climate were chosen as predicting variables. In order to obtain a concise amount
of ecoregions, the most detailed map depicting the spatial pattern of about 200 ecoregions was
reduced to 40 ecoregions (Figure 2). Each of them can be described statistically and by the
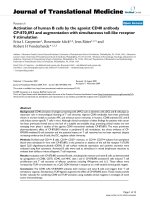
use of annual course diagrams and histograms as it is demonstrated for selected ecoregions
(D_7 to D_22) in Figure 3.
Case study 2: selection of representative sites for modelling GMP dispersal
For modelling pollen dispersal of genetically modified oilseed rape [GM OSR], representative
locations should be determined [5, 10]. Accordingly, a method was developed that includes
both the determination of representative OSR locations for modelling the dispersal at a field
scale and the subsequent generalisation of the modelling result to the landscape level at a
regional scale (up-scaling). Accordingly, land characteristics which are relevant for dispersal
and persistence of GM OSR were regionalised within a GIS environment. The beginning of
flowering of OSR was mapped by means of geostatistics. The resulting maps were used to
select satellite images for the detection of OSR fields and to determine the period for the
individual-based modelling. The monthly means (1961 to 1990) of precipitation [P], air
temperature [T] and sunshine duration [S] were regionalised by the Ward cluster analysis
[52], which has a wide range of applications in landscape ecology [53-55]. The PTS clusters
were combined to four climatic regions which, together with Ward clusters on wind speed and
direction as well as with land use clusters (crop rotation and management) [56], enabled to
define eight regions in Northern Germany with a maximum of internal homogeneity. A
distinct meteorological station was selected to represent each of these regions. Data on wind
speed and direction (hourly means), precipitation, sunshine and air temperature (daily)
measured at that location were provided for modelling the growth, dispersal and persistence
of GM OSR on selected fields on the local level [57]. Linking each of the modelled sites with
a map on German ecoregions [16], which integrates the spatial patterns of soils, elevation,
vegetation and climate, the modelling results were anticipated by analogy reasoning to be
valid for all those ecoregions which are represented by the modelling sites and, thus, could be
spatially generalised for up-scaling [58].
Case study 3: delineation and mapping of isolation zones
Concerning the protection of non-target organisms that might be harmed due to GMP
cultivation, a methodology was developed to classify the susceptibility/sensitivity of nature
reserves [NSG] in Germany as being part of the receiving environment that might be affected
due to GMP cropping in their vicinity. Within the joint research project ‘Recommendations
for isolation distances concerning the cultivation of genetically modified plants in the
neighbourhood of protected areas’ funded by the Federal Agency for Nature Conservation
(BfN), possible risks for biocoenoses in protected areas were evaluated as well as measures
which could mitigate or hinder negative effects [7]. According to Section 23 of the German
Federal Nature Protection Law [BNatSchG], NSG are to protect nature and landscape
properties by preserving and developing as well as by re-establishing existing biotopes of wild
and endangered species. According to Section 34a of the BNatSchG, the use of GMP has to
be accompanied by an environmental impact analysis of possible risks like it has to be done in
projects affecting the integrity of Flora-Fauna-Habitats (FFH) or European bird sanctuaries. In
order to classify NSG according to their potential endangerment by GMP invasion, a
methodology based on GIS techniques and statistical measures was developed. Additionally,
it examined what implications would emerge when introducing different isolation distances
concerning the cultivation of herbicide-resistant OSR and insect-resistant maize near
protection areas [9]. Both should help in monitoring and modelling GMP impacts. Within a
GIS environment, geometries of conservation areas, land use data (CORINE Landcover) [21],
agricultural information on the district level (Easystat: Statistik Regional 1999) as well as a
map of German ecoregions [16] were integrated. All NSG were classified with respect to
geometric properties and different intensities of cultivation area in their vicinity. The
classification was realised by calculating a geometric coefficient [GC] which described the
ratio of the buffer zone and the NSG area in order to parameterize the risk of GMP invasion.
The smaller and/or the narrower the NSG, the larger is the buffer zone, relatively, and the
higher is the risk for GMP invasion. According to frequency analyses of the GC, three
percentile classes (low/medium/high) were derived. The cultivation area of maize and OSR
cropping in the buffer zone around the NSG was expressed by a cultivation coefficient [CC].
This was calculated by adding up the area of maize and OSR cropland within a radius of 800
m (maize) and 4,000 m (OSR) around the NSG. Considering GMP cultivation in the future,
these GMP fields are likely to be located in those regions where cultivation of conventional
crops already has taken place. On the other hand, conventional maize or OSR fields might act
as stepping stones to establish transgenes from GMP fields far off by cross-breeding with
conventional stands, volunteers or ferals. Again, three percentile classes were built by
frequency analyses. They describe the spectrum from a low to a high cultivation intensity of
maize or OSR in the neighbourhood of each of the 7,338 NSG in Germany. The combination
of GC and CC resulted in a total of nine risk categories [RC], describing the potential risk of
endangerment by GMP cultivation in the vicinity of NSG. Areas with the highest risk were
grouped in RC 9: Here, those NSG were assembled showing the smallest acreage and the
highest cultivation rate of the respective crop (maize, OSR) in the neighbourhood of the NSG.
With a numerical proportion of 7%, those sites cover only 0.4% of the total area of all NSG.
All NSG showing the highest CC values had a total proportion of 60% [9].
Conclusions
The GMP EM is an important element of the regulatory framework for GMO cultivation in
Europe and needs to be conducted according to scientifically sound methods and quality
criteria to generate data which have to be robust and conclusive. The choice of parameters,
methods and experimental designs of the locations and the timeframe for GMP EM needs to
ensure that adverse effects of GMP and their use can be detected reliably and as early as
possible. To reach this end, guidelines such as that of the VDI [2] are needed in attempting to
harmonise and standardise the GMP EM design.
The VDI [2] recognizes that the environmental effects of GMP may vary with the
characteristics of different receiving environments in terms of e.g. climate, soils, land use
patterns or geographic distribution of wild relatives of certain GMP. Therefore, data derived
by ERA or EM should be collected in those regions which are representative for respective
ecological and agronomic characteristics which potentially could influence the spread and
impacts of GMP. Thus, spatially differentiated monitoring schemes are needed, in particular
with regard to biodiversity (e.g. non-target organisms) and ecological processes and functions
(e.g. soil functions) in which these organisms are involved. However, access to relevant
geodata is a prevalent problem. In this context, the EU directive Infrastructure for Spatial
Information in Europe [INSPIRE
a
] is an ambitious initiative to promote standardised data
retrieval. In Germany, PortalU
b
is a first step to achieve the INSPIRE goals. However, the
problem so far is that only few geodata sets are available, less of them being appropriate for
GMP EM use. Exposure assessment is crucial for GMP EM, aiming to assess whether
relevant parameters, e.g. certain non-target species, have to be in focus in the course of the
monitoring. In combination with an effect assessment, the exposure assessment allows the
evaluation of species which may be at risk. Geodata, ecological land classification, spatial
estimation and GIS techniques in combination with dynamic modelling are fundamental to
address effects on a landscape scale and long-term implications, to analyse and evaluate the
appropriateness of existing monitoring programs or data for GMP EM, to design adaptations
or extensions of the scope of GMP EM if they are inappropriate and to address the specific
requirements for GMP EM.
Competing interests
The authors declare that they have no competing interests.
Authors' contributions
GS performed the GIS and statistical analysis. WS conceived the study, participated in its
design and coordination, and drafted the manuscript. Both authors read and approved the final
manuscript.
Endnotes
a
b
.
References
1. European Community (EC): Directive 2001/18/EC of the European Parliament and of the
Council of 12 March 2001 on the Deliberate Release into the Environment of Genetically
Modified Organisms and Repealing Council Directive 90/220/EEC. Brussels; 2001.
2. Association of German Engineers (VDI): Monitoring the Effects of Genetically Modified
Organisms–Genetically Modified Plants. Basic Principles and Strategies. VDI 4330 Part
1. Düsseldorf; 2006.
3. Sanvido O, Widmer F, Winzeler M, Bigler F: A conceptual framework for the design of
environmental postmarket monitoring of genetically modified plants. Environ
Biosafety Res 2005, 4:13-27
4. Züghart W, Breckling B: Konzeptionelle Entwicklung eines Monitoring von
Umweltwirkungen transgener Kulturpflanzen, Teil 1 und 2. UBA-Texte 2003,
50/03:1-543.
5. Breckling B, Reuter H, Middelhoff U, Glemnitz M, Wurbs A, Schmidt G, Schröder W,
Windhorst W: Risk indication of genetically modified organisms (GMO): modelling
environmental exposure and dispersal across different scales: oilseed rape in
Northern Germany as an integrated case study. Ecol Ind 2011, 11:936-941.
6. Graef F, Schmidt G, Schröder W, Stachow U: Determining ecoregions for
environmental and GMO monitoring networks. Enviro Monit Assess 2005, 108:189-
203.
7. Menzel G, Lünsmann I, Middelhoff U, Breckling B, Schmidt G, Tillmann J, Schröder W,
Filser J, Reuter H: Abstandsregelungen beim Anbau gentechnisch veränderter
Pflanzen (GVP) in der Nähe von Schutzgebieten. Naturschutz und Biologische Vielfalt
2005, 10:1-227.
8. Reuter H, Middelhoff U, Graef F, Verhoeven R, Batz T, Weis M, Schmidt G, Schröder W,
Breckling B: Information system for monitoring environmental impacts of genetically
modified organisms. Environ Sci Pollut Res 2010, 17:1479-1490.
9. Schmidt G, Schröder W: GIS analyses on possible risks for nature reserves due to
genetically modified crops. In Geospatial Crossroads @ GI_Forum '08: Proceedings of
the Geoinformatics Forum Salzburg. Edited by Car A, Griesebner G, Strobl J. Heidelberg:
Wichmann; 2008:240-245.
10. Schmidt G, Schröder W: Regionalisation of climate variability used for modelling the
dispersal of genetically modified oil seed rape in Northern Germany. Ecol Ind 2011,
11:951-963.
11. Schmidt G, Kleppin L, Schröder W, Breckling B, Reuter H, Eschenbach C, Windhorst W,
Höltl K, Wurbs A, Barkmann J, Marggraf R, Thiel M: Systemic risks of genetically
modified organisms in crop production: interdisciplinary perspective. Gaia 2009,
18:119-126.
12. Olea RA: Geostatistics for Engineers and Earth Scientists. Boston: Kluwer; 1999.
13. Hornsmann I, Pesch R, Schmidt G, Schröder W: Calculation of an Ecological Land
Classification of Europe (ELCE) and its application for optimising environmental
monitoring networks. In Geospatial Crossroads @ GI_Forum '08: Proceedings of the
Geoinformatics Forum Salzburg. Edited by Car A, Griesebner G, Strobl J. Heidelberg
Wichmann; 2008:140-151.
14. Pesch R, Schmidt G, Schröder W, Aden C, Kleppin L, Holy M: Development
implementation and application of the WebGIS MossMet. In The Geospatial Web:
How Geobrowsers, Social Software and the Web 2.0 are Shaping the Network Society.
Edited by Tochtermann K, Scharl A. London: Springer; 2007:191-200.
15. Pesch R, Schmidt G, Schröder W, Weustermann I: Application of CART in ecological
landscape mapping: two case studies. Ecol Ind 2011, 11:115-122.
16. Schröder W, Schmidt G: Defining ecoregions as framework for the assessment of
ecological monitoring networks in Germany by means of GIS and classification and
regression trees (CART). Gate to EHS 2001, 1-9.
17. Schröder W, Schmidt G, Pesch R: Harmonization of environmental monitoring tools
for examination of methodical comparability and spatial representativity. Gate to
EHS 2003, 1-13.
18. Schröder W, Pesch R, Schmidt G: Analysis of climate change affecting German forests
by combination of meteorological and phenological data within a GIS environment.
Sci World 2007, 7:84-89.
19. Kleppin L, Schmidt G, Schröder W: Cultivation of GMO in Germany: support of
monitoring and coexistence issues by WebGIS technology. Environ Sci Eur 2011,
23:1-11.
20. EIONET [
21. Keil M, Kiefl R, Strunz G: CORINE Land Cover 2000–Germany. Final Report.
Oberpfaffenhofen: German Aerospace Center, German Remote Sensing Data Center;
2005.
22. EUROSTAT []
23. Climatic Research Unit (CRU) CL 2.0
[
24. New M, Lister D, Hulme M, Makin I: A high-resolution data set of surface climate
over global land areas. Clim Res 2002, 21:1-25.
25. Englert C, Pesch R, Schmidt G, Schröder W: Analysis of spatially and seasonally
varying plant phenology in Germany. In Geospatial Crossroads @ GI_Forum '08:
Proceedings of the Geoinformatics Forum Salzburg. Edited by Car A, Griesebner G,
Strobl J. Heidelberg: Wichmann; 2008:81-89.
26. Oke TR: Boundary Layer Climates. London: Routledge; 1987.
27. FAO Digital Soil Map of the World [ />of-the-world/en]
28. FAO Harmonized World Soil Database v1.1
[
29. Bohn U, Hettwer C, Gollub G: Anwendung und Auswertung der Karte der natürlichen
Vegetation Europas./Application and Analysis of the Map of the Natural Vegetation of
Europe. Bonn: BfN-Skripten (Bundesamt für Naturschutz); 2005.
30. Secretariat of the Convention on Biological Diversity (SCBD): Cartagena Protocol on
Biosafety to the Convention on Biological Diversity; Montreal; 2000.
31. Secretariat of the Convention on Biological Diversity (SCBD): Global Biosafety: from
Concepts to Action. Decisions Adopted by the First Meeting of the Conference of the
Parties to the Convention on Biological Diversity Serving as the Meeting of the Parties to
the Cartagena Protocol on Biosafety. Montreal; 2000.
32. Vieno M, Toivonen T: Report of Analysis of Observational Biodiversity Information
Needs and Products to Support the European Biodiversity Strategy and Parallel
Activities. Turku: European Network for Biodiversity Information (ENBI); 2005.
33. Gregory RD, Van Strien A, Vorisek P, Meyling AWG, Noble DG, Foppen RPB, Gibbons
DW: Developing indicators for European birds. Philos Trans Roy Soc B Biol Sci 2005,
360:269-288.
34. Thomas JA: Monitoring change in the abundance and distribution of insects using
butterflies and other indicator groups. Philos Trans R Soc B Biol Sci 2005, 360:339-
357.
35. EuMon database [
36. Schmeller DS, Henry PY, Julliard R, Clobert J, Gruber B, Dziock F, Lengyel S, Nowicki
P, Déri E, Budrys E, Kull T, Tali K, Bauch B, Settele J, van Swaay C, Kobler A, Babij V,
Papastergiadou E, Henle K: Advantages of volunteer-based biodiversity monitoring in
Europe. Conserv Biol 23:307-316.
37. Global Biodiversity Information Facility (GBIF) []
38. European Forest Genetic Resources Programme (EUFORGEN)
[
39. DIVA-GIS []
40. International Potato Center (CIP) []
41. FloraWeb []
42. Bundesministerium für Umwelt, Naturschutz und Reaktorsicherheit (BMU):
Umweltbeobachtung. Stand und Entwicklungsmöglichkeiten. Bonn; 2000.
43. Keune H, Mandry P: Harmonization of environmental data. The requirements for
developing a consistent view of the environment world-wide. In Global Monitoring of
Terrestrial Ecosystems. Edited by Schröder W, Fränzle O, Keune H, Mandry P. Berlin,
Ernst & Sohn; 1996:51-56.
44. Craig W, Tepfer M, Degrassi G, Ripandelli D: An overview of general features of risk
assessments of genetically modified crops. Euphytica 2008, 164:853-880.
45. Cao Y, Williams DD, Larsen DP: Comparison of ecological communities: the problem
of sample representativeness. Ecol Monogr 2002, 72:41-56.
46. Tirler W, Donega M, Voto G, Kahr G: Quick evaluation of long term monitoring
samples and its representativeness. Organohalogen Compounds 2003, 60:509-512.
47. Bühler C: Biodiversity monitoring in Switzerland: what can we learn for general
surveillance of GM crops? J Verbr Lebensm 2006, 1:37-41.
48. Leigh RA, Johnston AE: Long-term Experiments in Agricultural and Ecological Sciences:
Proceedings of a Conference to Celebrate the 150th Anniversary of Rothamsted
Experimental Station, Held at Rothamsted, 14-17 July 1993. Wallingford: CAB
International; 1994.
49. Stein A, Ettema C: An overview of spatial sampling procedures and experimental
design of spatial studies for ecosystem comparisons. Agric Ecosyst Environ 2003,
94:31-47.
50. Wilkinson MJ, Davenport IJ, Charters YM, Jones AE, Allainguillaume J, Butler HT,
Mason DC, Raybould AF: A direct regional scale estimate of transgene movement
from genetically modified oilseed rape to its wild progenitors. Mol Ecol 2000, 9:983-
991.
51. Hastings DA, Dunbar PK, Elphingstone GM, Bootz M, Murakami H, Maruyama H,
Masaharu H, Holland P, Payne J, Bryant NA, Logan TL, Muller J-P, Schreier G,
Macdonald JS: The Global Land One-kilometer Base Elevation (GLOBE) Digital
Elevation Model, Version 1.0. Boulder: National Oceanic and Atmospheric
Administration, National Geophysical Data Center; 1999.
52. Ward JH: Hierarchical grouping methods to optimise an objective function. J Am Stat
Assoc 1963, 58:236-244.
53. Knapp PA, Grissino-Mayer HD, Soule PT: Climatic regionalization and the spatio-
temporal occurrence of extreme single-year drought events (1500-1998) in the
Interior Pacific Northwest, USA. Quaternary Res 2002, 58:226-233.
54. Shwartz M, Payne SMC, Restuccia JD, Ash AS: Does it matter how small geographic
areas are constructed? Ward's algorithm versus the plurality rule. Health Serv
Outcomes Res Methodol 2001, 2:5-18.
55. Zhou Y, Narumalani S, Waltman WJ, Waltman SW, Palecki MA: A GIS based spatial
pattern analysis model for ecoregion mapping and characterization. Int J Geogr
Inform Sci 2003, 17:445-462.
56. Glemnitz M, Wurbs A, Roth R: Derivation of regional crop sequences as an indicator
for potential GMP dispersal on large spatial scales. Ecol Indicat 2011, 11:964-973.
57. Middelhoff U, Reuter H, Breckling B: GeneTraMP, a spatio-temporal model of the
dispersal and persistence of transgenes in feral, volunteer and crop plants of oilseed
rape and related species. Ecol Indicat 2011, 11:974-988.
58. Reuter H, Schmidt G, Schröder W, Middelhoff U, Pehlke H, Breckling B: Regional
distribution of genetically modified organisms (GMOs)—up-scaling the dispersal
and persistence potential of herbicide resistant oilseed rape (Brassisca napus). Ecol
Indicat 2011, 11:989-999.
Figure 1. Distribution of the corn borer (O. nubilalis) in Brandenburg between 2005 and
2007. Mapping is based on data handed over by Dr. Werner Kratz, Landesumweltamt
Brandenburg.
Figure 2. Ecoregions of Europe calculated by CART [13].
Figure 3. Annual course of precipitation (monthly means, 1961 to 1990) for some
ecoregions in Europe [13].
Figure 1
Figure 2
0
10
20
30
40
50
60
70
80
90
January
February
March
April
May
June
July
August
September
October
November
December
Precipitation [mm]
D_14
D_7
D_8
D_10
D_12
D_13
D_16
D_17
D_18
D_19
D_21
D_22
Europe
Figure 3