Mobile and Wireless Communications-Physical layer development and implementation 2012 Part 15 docx
Bạn đang xem bản rút gọn của tài liệu. Xem và tải ngay bản đầy đủ của tài liệu tại đây (849.43 KB, 20 trang )
TowardsPerformanceEnhancementofShortRange
WirelessCommunicationsinReliability-andDelay-CriticalApplications 271
2. Communication System Design and Testing
2.1 Choosing wireless technologies
Many different wireless technologies have been considered for use in the robots. The main
ones are: RadioMetrix 433 MHz and 869 MHz RF, IEEE 802.11a/b, IEEE 802.15.4, DECT,
Linx, etc. While making decision which technology to choose, we also need to keep in mind
about RoboCup’s rules and regulations and also compliance with regulations of the country
hosting the competition. Before the competition all teams should notify the local organizing
committee of the wireless communication technology, power and frequency. To avoid direct
interference, each team should be able to select between at least two carrier frequency bands
before the match.
After experienced unsatisfied performance from the RF modules, the prospective choices are
from IEEE 802.11a/b, IEEE 802.15.4, DECT and Linx. Among these wireless technologies,
IEEE 802.11a/b is based on CSMA/CA and therefore considered not to be optimum
solution for real-time applications. According to Tse et al (2005), the performance of IEEE
802.15.4 drops significantly where there are many 802.11 terminals connected to access
points, which is the case at the competition site, and therefore this is not considered as
optimum solution either. Both DECT and Linx are designed to support voice transmission
capability and optimized for real-time performance, so the communication system for the
new generation robot design will use these two and choose the one which will perform
better during the competition, according to the opponent team’s radio to be used.
2.2 Designing the test bed
The purpose of this testing is to observe and study wireless communication performance of
Linx modules such as round trip delay, bit error, packet error, RSSI (Received Signal
Strength Indication), and how they are affected by interference. A test bed has been built to
carry out the tests and collect data to a PC. Both wireless transmitter and receiver modules
are connected to an ARM7 microcontroller UART port. The packets which have been
transmitted over wireless link are compared by ARM7 with the packages that have been
received. The testing data are sent to PC for further processing. The timer feature is used to
record the transmission time per each byte, and the result are also read by the
microprocessor and sent to PC. Linx HP3 RF modules also provide a RSSI function which is
connected to ADC so that a digital RSSI value can be read to indicate each byte’s signal
strength. The test bed simulates a full-duplex wireless transmission. Linx transmitter A will
send data through channel A to Linx receiver B. Transmitter B will send what receiver B
received through channel B to receiver A. In such way, we could measure the time delay for
the round trip, RSSI for both channel A and B, error rate of the data, etc.
Much attention has been put to design PCB carefully following the standard industrial
practices and choosing high quality components.
For testing purposes a test bed has been designed and implemented which will be able to
work with both DECT and Linx modules. Here we present briefly some board design issues
with some theoretical background when needed. The testing board is made of two parts: the
mother board and the daughter board for LCD display and buttons, which will be mounted
on top of the mother board.
The board can support both serial communication (through its DB9 female connector) and
Ethernet connection (using RJ-45 XPort jack). Serial connection is left for downwards
compatibility with the old server. It’s connected directly to DECT and Linx modules. In the
near future only Ethernet interface will be used to communicate with the server, and
therefore in the testing board we use two XPort devices. One is connected directly to
communication modules. The other one is connected to microcontroller to be able to set and
control communication parameters, like RSSI values and communication channel number
for monitoring and data logging to be used for further analysis.
Linx HP3 Series transmitter and receiver are high-performance RF modules (Linx 2007a,
Linx 2007b) commonly used in wireless data transfer and industrial automation. They use
popular 902-928 MHz frequency band. On the PCB we have possibility for serial channel
selection of 100 channels by using microcontroller’s I/O ports. Anyway in case of problems
with microcontroller’s operation during the competition we have provided also parallel
selection of 8 channels using octal rotary DIP switches. For digital data transmission, Linx
uses FSK modulation to ensure reliable performance. Equation (1) shows the FSK
modulation formula. In FSK the modulating signal shifts the output frequency between two
discrete values so called mark and space frequencies:
1)(),2cos(
1)(),2cos(
)(
2
1
bc
bc
nTmtfA
nTmtfA
ts
(1)
Therefore comparing to On-Off Keying modulation, FSK has increased noise immunity and
ability to capture in the presence of multiple signals which is really helpful especially in
such crowded band. Using those SIP style Linx modules we don’t need any additional RF
components (except of the antenna of course). Receiver has an exceptional sensitivity of -100
dBm typical.
The critical requirement for both modules performance was big ground plane on lower layer
of PCB. To minimize losses we had to stick to the rules of designing microstrip as shown in
Figure 1, the trace running between module and antenna.
Fig. 1. Microstrip (Linx 2007b)
Microstrip design is based on Equation (2) and (3):
Wd
r
E
r
E
e
E
/121
1
2
1
2
1
(2)
MobileandWirelessCommunications:Physicallayerdevelopmentandimplementation272
1
d
W
For
1.444))
d
W
ln(0.6671.393
d
W
(
e
E
120π
1
d
W
For)
4d
W
W
8d
ln(
e
E
60
0
Z
(3)
r
E
=Dielectric constant of PCB material
Another important thing is antenna’s length. We have decided to use whip style antenna. Its
optimal length can be calculated using Equation (4):
MHz
f
L
234
(4)
L is length in feet of quarter-wave length and
MHz
f is the operating frequency in MHz.
Therefore in our case we will need two 8 cm long whip style antennas. The antennas are
located as far as possible from each other and in the same line facing to the field with
playing robots.
2.3 EMC and wireless performance testing
We have measured the testing board for radiated E-field emissions using European Union
standard EN 55022 in EMC laboratory. This test measures unintentional E-field emissions
from product in normal operating mode. Linx modules including a transmitter and a
receiver have been tested. Simple application written in C and running on ATMega8535L
microcontroller displays on LCD screen actual RSSI values. The board is connected with
laptop computer outside EMC room with cross-over CAT5e cable. Client-server application
written in Java constantly sends a packet which is passed to Linx transmitter and waits for
response from the receiver, to check if the received value is correct. At the end of the
measurement there is a table showing in percentage how many errors occurred at which
particular frequencies.
The channel is set to 69. For these settings transmitter frequency should be 919.87 MHz. In
EMC laboratory, jamming signals are feed at fine steps from 915 to 925 MHz. We were
observing error rate occurring for different frequencies and in the same time we were
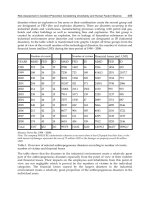
recording Received Signal Strength Indicator (RSSI) value. The results from the
measurements are shown in Table 1 and plotted in Figure 2.
F [MHz] Errors [%] RSSI
915 0.00 140
916 0.05 142
917 0.17 139
918 0.69 135
919 96.71 120
920 0.56 125
921 0.14 130
922 0.00 135
923 0.13 129
924 0.23 127
925 1.32 130
Table 1. Error rate and RSSI measurements
TowardsPerformanceEnhancementofShortRange
WirelessCommunicationsinReliability-andDelay-CriticalApplications 273
1
d
W
For
1.444))
d
W
ln(0.6671.393
d
W
(
e
E
120π
1
d
W
For)
4d
W
W
8d
ln(
e
E
60
0
Z
(3)
r
E
=Dielectric constant of PCB material
Another important thing is antenna’s length. We have decided to use whip style antenna. Its
optimal length can be calculated using Equation (4):
MHz
f
L
234
(4)
L is length in feet of quarter-wave length and
MHz
f is the operating frequency in MHz.
Therefore in our case we will need two 8 cm long whip style antennas. The antennas are
located as far as possible from each other and in the same line facing to the field with
playing robots.
2.3 EMC and wireless performance testing
We have measured the testing board for radiated E-field emissions using European Union
standard EN 55022 in EMC laboratory. This test measures unintentional E-field emissions
from product in normal operating mode. Linx modules including a transmitter and a
receiver have been tested. Simple application written in C and running on ATMega8535L
microcontroller displays on LCD screen actual RSSI values. The board is connected with
laptop computer outside EMC room with cross-over CAT5e cable. Client-server application
written in Java constantly sends a packet which is passed to Linx transmitter and waits for
response from the receiver, to check if the received value is correct. At the end of the
measurement there is a table showing in percentage how many errors occurred at which
particular frequencies.
The channel is set to 69. For these settings transmitter frequency should be 919.87 MHz. In
EMC laboratory, jamming signals are feed at fine steps from 915 to 925 MHz. We were
observing error rate occurring for different frequencies and in the same time we were
recording Received Signal Strength Indicator (RSSI) value. The results from the
measurements are shown in Table 1 and plotted in Figure 2.
F [MHz] Errors [%] RSSI
915 0.00 140
916 0.05 142
917 0.17 139
918 0.69 135
919 96.71 120
920 0.56 125
921 0.14 130
922 0.00 135
923 0.13 129
924 0.23 127
925 1.32 130
Table 1. Error rate and RSSI measurements
0
10
20
30
40
50
60
70
80
90
100
Errors [%]
915 916 917 918 919 920 921 922 923 924 925
Frequency [MHz]
Error rate measurements with jamming signal
Fig. 2. Error rate measurements with jamming signal
As expected, most errors have occurred on transmitter frequency 919 MHz which is better
visible in Figure 2 showing percentage of errors for given frequency. The value of RSSI was
much lower around 919 and 920 MHz and it was varying rapidly around the values shown
in Table 1, but the value has never gone below 120. The adjacent channels, although affected
by the jamming frequencies too, have significantly lower error rates. This indicates that
frequency hopping can be used as one very effective solution to improve the immunity to
jamming signals.
Signal to Noise Ratio (SNR) variable in the formula below is defined as the signal to noise
ratio. The probability of error can be calculated for a receiver system using non-coherent
FSK modulation. The system is modelled with two matched filters which are centred at f1
and f2 with envelope detectors summed to a decision circuit. Equation (5) can be used to
calculate the probability of error for non-coherent FSK modulation:
)
4
exp(
2
1 SNR
fskP
SNR
(5)
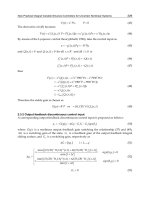
Real-life performance of Linx wireless communication has been also intensively investigated
in terms of round trip delay, bit error rate and packet error rate, etc, by interfering with
simulated jamming signals, and results are shown in Figure 3.
The typical round trip time delay for Linx wireless transmission is around 209 μs to 809 μs
after deducting the processing time. Under heavy interference (10 V/m) the most common
bit error rate is 3 bits per byte. Hence, a 3-bit error correction scheme should be sufficient to
significantly improve the reliability of wireless performance. Besides error correction,
frequency hopping is also employed to resist interferences. The RSSI levels of all channels
are scanned and a black list is generated so that all the bad channels are excluded from the
random frequency hopping sequence to ensure the hopping channel quality, and therefore
improve the communication performance even further.
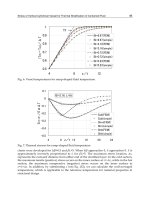
Figure 4 shows a detailed snapshot of good quality channels. The sequences of the plot are
RSSI, Delay, Bit Error Rate, and Packet Error Rates. The data cursor tells that while jam
frequency are located among channel 40 to channel 48, the transmission give a better
performance with strong RSSI, evenly distributed time delay, low bit error rate and low
MobileandWirelessCommunications:Physicallayerdevelopmentandimplementation274
packet loss rate. Among channel 53 to channel 74, the transmission gives an even better
performance. It can be concluded that, if the transmission is allocated from 1 to 10 channels
below or above the jamming frequency, the wireless performance is significantly better. This
has proved again that frequency hopping scheme will be quite effective to improve the
existing wireless transmission.
Fig. 3. Performance evaluation of RSSI, delay, bit error rate, packet loss rate
Fig. 4. Performance of RSSI, delay, bit error rate, packet loss rate in good quality channels
TowardsPerformanceEnhancementofShortRange
WirelessCommunicationsinReliability-andDelay-CriticalApplications 275
packet loss rate. Among channel 53 to channel 74, the transmission gives an even better
performance. It can be concluded that, if the transmission is allocated from 1 to 10 channels
below or above the jamming frequency, the wireless performance is significantly better. This
has proved again that frequency hopping scheme will be quite effective to improve the
existing wireless transmission.
Fig. 3. Performance evaluation of RSSI, delay, bit error rate, packet loss rate
Fig. 4. Performance of RSSI, delay, bit error rate, packet loss rate in good quality channels
3. Analysis and Enhancement of Wireless Communication Performance
3.1 General analysis of improvements proposals
Reliable communication is critical for success in the competition. Most intelligence and all
tactics are processed on the centralized server so if there is excessive data error or delay in
the communication with the server, robots cannot achieve reliable real-time performance. In
case of this application, propagation delay in the communication is much more critical than
the throughput. Specific data transmission doesn’t require high throughput but working
with real-time systems means that information which will come to receiver too late is
useless, and will result in foul or loosing a goal during competition.
During the tests it has been noticed that 96.71% of errors occur on the same frequency as the
one set on Linx module. Any concurrent transmission on that frequency causes excessive
errors and decreases reliability. In case of very small SNR the system doesn’t work at all.
Because the described communication system has to work in very noisy environment we
have to consider use of additional error detection and correction algorithms to improve
communication’s reliability. One of the improvements could be dynamic checking for
channel with the highest SNR and choosing the best channel for communication purpose.
Other idea is to use two antennas inside the robots making use of antenna diversity, the fact
that fading is space dependant and one of the antennas will receive stronger signal than the
other. This is important especially that the robots move fast and can change position and
orientation rapidly.
Because the data is sent to robots using broadcast, not point to point, so there are more than
one channel which could be used. Therefore there is possibility to use frequency diversity,
using two channels to communicate with robots (to broadcast the same data). The channel
which is more probable to have correct data is the one with the highest SNR.
Finally, from the measurement results obtained from the test bed, it can be concluded that
utilizing frequency hopping is probably the most effective solution to improve the wireless
communication performance without changing much existing communication system
structure.
3.2 Adaptive frequency hopping
An adaptive frequency hopping scheme with duplex link is proposed as an improvement
solution. Frequency hopping is a powerful solution towards to interference and multi-path
fading. As normal frequency hopping system, a hop-sequence generator has to be
determined, so that the frequency hopping system will avoid the congested channel and
transmit the data in clear channel. The hop-sequence generator is determined based on the
link quality testing results as well as the analysis of wireless communication theory.
Frequency hopping is categorized into slow hopping and fast hopping. By slow hopping,
more than one data symbol is transmitted in same channel. Fast hopping change frequency
several times during one symbol (Rappaport, 2001). The pattern of channel usage is called
the hopping sequence (Jochen, 2001). Explain the notion of hopping sequences in a more
practical way is that how to determine the next channel to hop. There are two types of
hopping sequence: random hopping sequences and the deterministic hopping sequences. In
this study a hopping system with slow deterministic frequency hopping sequence is focused.
Compare with other kinds of wireless communications, HF communication selectively
fading because of the multi-path propagation and abundance interference from others.
MobileandWirelessCommunications:Physicallayerdevelopmentandimplementation276
Hence, a channel with sustaining stable signal-to-interference ratio, SIR is normally used for
a narrowband communication, and new channel is used according to the same SIR criteria
when the previous channel quality changes. Narrowband schemes will not work as
expected when there is noise burst although it is very efficient while slowing changing
interference and fading environment is engaged. For wideband communication, a random
frequency hopping schemes together with forward error correction, FEC method, the short
noise burst will not effect wideband transmission; it is protected from jamming transmission
and has low probability of interception.
The improvement proposal is meant to combine the advantage in of both narrowband and
wideband schemes. Additionally, from previews EMC test results in RSSI tells each
channel’s quality so that a “bad channel” list can be generated. Therefore, the improvement
proposal is determined, using a wideband frequency hopping scheme that would avoid
known interference: the “bad channels”. This can be done by functionalized one of the
duplex channel as the feedback channel. The feedback information contains the channel
numbers which are in use. The selection of active channels is based from EMC RSSI testing
results, the channel RSSI which is lower than -95 dBm is considered as “bad channel”. This
system is an adapted frequency hopping system which can utilize the existing hardware
functionalities to achieve the optimized wireless performance.
For this duplex communication system, the selection of which frequencies to be used is
based on the feedback from uplink. As motioned before, the downlink transmitter A
transmit the data, at the receiver B side the RSSI value of downlink which in this case is
equivalent as SIR, is measured. At the receiver side a link quality analysis scheme is
implemented, once the SIR is below the criterion, for instance, -95 dBm, LQA will determine
that the channel needs to be switched. After the performance of the hopping sequence
generator, the new channel number is send to the transmitter over the uplink.
In this proposed system, the uplink can be immobile and used for only sending feedback to
downlink. If the downlink sends a packet with chips with each chip contain one channel
symbol, and the uplink will send chips as feedback. Since the uplink’s feedback is not totally
reliable, therefore assume that the transmission with one bit per chip in Equation (6):
RCNNC
OHaf
2
log
(6)
LOADelaynTimepropogatio
ChipRateR
erheadFeedbackOvC
dbackChipsOnFeeC
nelsActiveChanN
lsableChanneTotalAvialN
OH
f
a
100
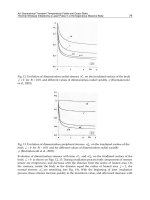
During the EMC test, an RSSI testing for each channel is also measured. This can indicate
each channel’s quality from SIR aspect. The test is done by setting the jamming frequency at
channel 27 and let the transmission carry out from channel 1 to channel 100, and then the
same procedure while jamming frequency is set at channel 75. The result is shown in Figure
5. The green curve in Figure 3 presents the RSSI curve based on 100 channels’ transmission
while jamming frequency is set at channel 75, and the red curve in Figure 3 presents the
RSSI curve while jamming frequency is set at channel 27. From this data, a “bad channel”
black list can be generated.
TowardsPerformanceEnhancementofShortRange
WirelessCommunicationsinReliability-andDelay-CriticalApplications 277
Hence, a channel with sustaining stable signal-to-interference ratio, SIR is normally used for
a narrowband communication, and new channel is used according to the same SIR criteria
when the previous channel quality changes. Narrowband schemes will not work as
expected when there is noise burst although it is very efficient while slowing changing
interference and fading environment is engaged. For wideband communication, a random
frequency hopping schemes together with forward error correction, FEC method, the short
noise burst will not effect wideband transmission; it is protected from jamming transmission
and has low probability of interception.
The improvement proposal is meant to combine the advantage in of both narrowband and
wideband schemes. Additionally, from previews EMC test results in RSSI tells each
channel’s quality so that a “bad channel” list can be generated. Therefore, the improvement
proposal is determined, using a wideband frequency hopping scheme that would avoid
known interference: the “bad channels”. This can be done by functionalized one of the
duplex channel as the feedback channel. The feedback information contains the channel
numbers which are in use. The selection of active channels is based from EMC RSSI testing
results, the channel RSSI which is lower than -95 dBm is considered as “bad channel”. This
system is an adapted frequency hopping system which can utilize the existing hardware
functionalities to achieve the optimized wireless performance.
For this duplex communication system, the selection of which frequencies to be used is
based on the feedback from uplink. As motioned before, the downlink transmitter A
transmit the data, at the receiver B side the RSSI value of downlink which in this case is
equivalent as SIR, is measured. At the receiver side a link quality analysis scheme is
implemented, once the SIR is below the criterion, for instance, -95 dBm, LQA will determine
that the channel needs to be switched. After the performance of the hopping sequence
generator, the new channel number is send to the transmitter over the uplink.
In this proposed system, the uplink can be immobile and used for only sending feedback to
downlink. If the downlink sends a packet with chips with each chip contain one channel
symbol, and the uplink will send chips as feedback. Since the uplink’s feedback is not totally
reliable, therefore assume that the transmission with one bit per chip in Equation (6):
RCNNC
OHaf
2
log
(6)
LOADelaynTimepropogatio
ChipRateR
erheadFeedbackOvC
dbackChipsOnFeeC
nelsActiveChanN
lsableChanneTotalAvialN
OH
f
a
100
During the EMC test, an RSSI testing for each channel is also measured. This can indicate
each channel’s quality from SIR aspect. The test is done by setting the jamming frequency at
channel 27 and let the transmission carry out from channel 1 to channel 100, and then the
same procedure while jamming frequency is set at channel 75. The result is shown in Figure
5. The green curve in Figure 3 presents the RSSI curve based on 100 channels’ transmission
while jamming frequency is set at channel 75, and the red curve in Figure 3 presents the
RSSI curve while jamming frequency is set at channel 27. From this data, a “bad channel”
black list can be generated.
0 10 20 30 40 50 60 70 80 90 100
-95
-90
-85
-80
-75
-70
-65
-60
-55
-50
-45
channel number
RSSI/dBm
Fig. 5. Channel quality measurement: RSSI
3.3 Interference model and performance analysis
Interference always exists to any wireless system, in the improved system RSSI and the bit
error rate is still important in aspect to determine whether if proposal is an improvement.
In this system, channel hops due to the SIR changes. Some of the channels are crowed while
others are clear. Therefore, in the analyses, a simple two state channel model, “Gilbert-Elliot
Model” (Gilbert, 1960 and Elliot, 1963) is used. “Gilbert-Elliot Model” is a two-state Markov
chain (Wang et al, 1995) with states named “Good” and “Bad”. According to this model,
each of the channels may either be in a congested condition or clear. The classification is
made due to received signal quality which means that except the interference, the two-state
model also includes other transmission aspects, such as the signal strength. The bad state
will be described as a channel (BSC) with a high bit error probability while the good state
corresponds to a channel with a low bit error probability. Assume that all the transitions
between the two states may be modelled by a Markov chain as shown in Figure 6.
Fig. 6. A two-state Gilbert-Elliot model (Kanal et al, 1978)
MobileandWirelessCommunications:Physicallayerdevelopmentandimplementation278
The probability of leaving bad or good states will denote as n, m, and the occupancy of the
frequency band by Q. Also assume that the average duration the transmission stay in the
bad state is t (Andersson et al 1991 and Bröms 1991). As we know that the congestion of the
channel is based on the SIR, the noise level and also the transmit power, higher the
transmission power the lower the occupancy. According to Zander et al (1995) the
probability of using a bad state channel is:
;
mn
n
PQ
B
(7)
;
1
t
m
(8)
;
1
1
Q
Q
t
n
(9)
Estimating the performance of the proposed system, the bit error probability is time-
dependent, so assume that M channels being in a bad state at chip i, and the probability of
error in chip i is
i
P
:
mn
mn
nNmnxxMME
i
a
i
i
11
1
0
(10)
Assuming random hopping schemes select each of the active channels with equal
probability, therefore:
B
a
i
GB
a
i
G
a
ia
xi
P
N
xMME
PP
N
xMME
P
N
xMMEN
P
000
(11)
And assume that:
aiBG
NxMMEPP
0
;
Combining Equation (10) and (11) yields:
i
a
BBG
i
a
BBG
B
i
i
a
Gxi
tQN
x
QPQPP
mn
N
x
mn
n
P
mn
n
PP
P
nm
nm
nnm
N
x
PP
1
1
1
1
11
1
Removing the condition x and can see that the probabilities of error in chip i:
tQN
ME
QPQPPP
a
BBGi
1
1
1
0
(12)
If i approximately is linear, than error probability would be:
aa
BG
L
i
i
N
mnME
n
L
N
ME
PPP
L
P
00
1_
2
1
(13)
Equation (13) is dependent on the value of M
0
and if assume that B is the number of bad
channels in active channels, and L
f
is the duration of the bad states may change, then:
faa
L
aa
LBEQNQN
tQ
BEQNQNME
f
1
1
1
1
0
(14)
TowardsPerformanceEnhancementofShortRange
WirelessCommunicationsinReliability-andDelay-CriticalApplications 279
The probability of leaving bad or good states will denote as n, m, and the occupancy of the
frequency band by Q. Also assume that the average duration the transmission stay in the
bad state is t (Andersson et al 1991 and Bröms 1991). As we know that the congestion of the
channel is based on the SIR, the noise level and also the transmit power, higher the
transmission power the lower the occupancy. According to Zander et al (1995) the
probability of using a bad state channel is:
;
mn
n
PQ
B
(7)
;
1
t
m
(8)
;
1
1
Q
Q
t
n
(9)
Estimating the performance of the proposed system, the bit error probability is time-
dependent, so assume that M channels being in a bad state at chip i, and the probability of
error in chip i is
i
P
:
mn
mn
nNmnxxMME
i
a
i
i
11
1
0
(10)
Assuming random hopping schemes select each of the active channels with equal
probability, therefore:
B
a
i
GB
a
i
G
a
ia
xi
P
N
xMME
PP
N
xMME
P
N
xMMEN
P
000
(11)
And assume that:
aiBG
NxMMEPP
0
;
Combining Equation (10) and (11) yields:
i
a
BBG
i
a
BBG
B
i
i
a
Gxi
tQN
x
QPQPP
mn
N
x
mn
n
P
mn
n
PP
P
nm
nm
nnm
N
x
PP
1
1
1
1
11
1
Removing the condition x and can see that the probabilities of error in chip i:
tQN
ME
QPQPPP
a
BBGi
1
1
1
0
(12)
If i approximately is linear, than error probability would be:
aa
BG
L
i
i
N
mnME
n
L
N
ME
PPP
L
P
00
1_
2
1
(13)
Equation (13) is dependent on the value of M
0
and if assume that B is the number of bad
channels in active channels, and L
f
is the duration of the bad states may change, then:
faa
L
aa
LBEQNQN
tQ
BEQNQNME
f
1
1
1
1
0
(14)
where:
tQ
1
1
Because bad channels are binomially distributed so that:
iN
i
N
i
a
i
N
iNBE
a
1
0
(15)
Imagine more complex case which there is a probability P
f
that a feedback message may be
lost and no changes will be made until the last packet is send. Therefore an extended
feedback time is assumed as
f
LL 2
, this gives:
fffaa
faa
f
faaf
LLPLBEQNQN
LLBEQNQNPLBEQNQNPME
1
2111
0
(16)
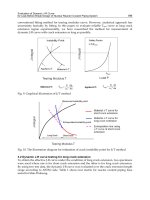
From the equations above, the frequency hopping has been implemented and simulated
with Matlab. Figure 7 shows the performance comparison with and without frequency
hopping. With the proposed frequency hopping solution, the BER can be significantly
reduced especially in bad channel conditions with low RSSI, compared to the performance
without frequency hopping. This has proved the proposed system can well perform the
transmission, and the best performance will be obtained if using fixed rate block codes with
ideal interleaving and a soft decoder. Also the smaller the packet size gets, the lower the
probability of error rate.
-92 -91 -90 -89 -88 -87
10
-2
10
-1
RSSI/(dbm)
BER
Performance Comparison: with and without FH
With FH Median
With FH discrete
Without FH Median
Without FH discrete
Fig. 7. Performance comparison: with and without frequency hopping
MobileandWirelessCommunications:Physicallayerdevelopmentandimplementation280
4. Conclusion
In this chapter, we have investigated different wireless technologies in order to optimize the
wireless communication performance in application of RoboCup. Linx wireless
communication technology is intensively tested using self developed test bed and EMC
measurements, and its performance has been analyzed.
Reliable and low latency wireless communication ensures smooth and accurate control of
fast dynamic process and is critical for success not only in RoboCup competition but also in
many industrial automation applications where short range wireless communication
technologies are used to replace existing cables. The prototype test bed with EMC
measurements along with RoboCup application forms an ideal real world testing and
analytical environment for various wireless communication technologies, to find out how
different jamming signals affect their performances and therefore to make further
improvements possible.
An adaptive frequency hopping scheme has been proposed to improve the immunity of
interference of commercial short range wireless communication and therefore enhance the
wireless communication performance. With the test bed to evaluate the wireless
communication performance, the adaptive frequency hopping scheme can significantly
reduce the bit error rate and packet loss rate. In future research, the proposed adaptive
frequency hopping scheme will be adopted to other wireless links to be evaluated further.
5. References
Andersson, A. & Bergzen, H. (1991). “HF-interference measurements”, TELUB internal
report, TR914109, 1991
Anthes, J. (2007). “OOK, ASK and FSK Modulation in the Presence of an Interfering signal“,
RF Monolithics, Dallas, Texas
Bröms, M. (1991). “Some results from measurements of interference in Sweden”, IEE
conference publication 339, pp. 337-342
Elliot, E. O. (1963). “Estimates of Error Rates for Codes On Burst-Noise Channels”, Bell Syst.
Tech. J, pp. 1977-1997
Gilbert, E. N. (1960). “Capacity of a burst-noise channel”, Bell Syst. Tech. J, pp. 1253-1265
Jochen, S. (2001). Mobile Communication, Addison Wesley
Kanal, L. N. & Sastry, A. R. K. (1978). “Models for channels with memory and their
application to error and control”, IEEE, Proceedings, Vol. 66, July 1978, pp. 724-744
Linx transmitter Data Guide (2007a). Linx Technologies, Inc., www.linxtechnologies.com/
documents/TXM-900-HP3-xxx_Data_Guide.pdf
Linx receiver Data Guide (2007b). Linx Technologies, Inc., www.linxtechnologies.com/
documents/RXM-900-HP3-xxx_Data_Guide.pdf
Liu, Y.; Mazurkiewicz, M. & Kwitek, M. (2007). “A Study towards Reliability- and Delay-
Critical Wireless Communication for RoboCup Robotic Soccer Application”,
Proceedings of 3rd IEEE International Conference on Wireless Communications,
Networking and Mobile Computing, Shanghai, China
Liu, Y. (2008). ”Enhancement of Short Range Wireless Communication Performance Using
Adaptive Frequency Hopping”, Proceedings of 4th IEEE International Conference on
Wireless Communications, Networking and Mobile Computing, Dalian, China
TowardsPerformanceEnhancementofShortRange
WirelessCommunicationsinReliability-andDelay-CriticalApplications 281
4. Conclusion
In this chapter, we have investigated different wireless technologies in order to optimize the
wireless communication performance in application of RoboCup. Linx wireless
communication technology is intensively tested using self developed test bed and EMC
measurements, and its performance has been analyzed.
Reliable and low latency wireless communication ensures smooth and accurate control of
fast dynamic process and is critical for success not only in RoboCup competition but also in
many industrial automation applications where short range wireless communication
technologies are used to replace existing cables. The prototype test bed with EMC
measurements along with RoboCup application forms an ideal real world testing and
analytical environment for various wireless communication technologies, to find out how
different jamming signals affect their performances and therefore to make further
improvements possible.
An adaptive frequency hopping scheme has been proposed to improve the immunity of
interference of commercial short range wireless communication and therefore enhance the
wireless communication performance. With the test bed to evaluate the wireless
communication performance, the adaptive frequency hopping scheme can significantly
reduce the bit error rate and packet loss rate. In future research, the proposed adaptive
frequency hopping scheme will be adopted to other wireless links to be evaluated further.
5. References
Andersson, A. & Bergzen, H. (1991). “HF-interference measurements”, TELUB internal
report, TR914109, 1991
Anthes, J. (2007). “OOK, ASK and FSK Modulation in the Presence of an Interfering signal“,
RF Monolithics, Dallas, Texas
Bröms, M. (1991). “Some results from measurements of interference in Sweden”, IEE
conference publication 339, pp. 337-342
Elliot, E. O. (1963). “Estimates of Error Rates for Codes On Burst-Noise Channels”, Bell Syst.
Tech. J, pp. 1977-1997
Gilbert, E. N. (1960). “Capacity of a burst-noise channel”, Bell Syst. Tech. J, pp. 1253-1265
Jochen, S. (2001). Mobile Communication, Addison Wesley
Kanal, L. N. & Sastry, A. R. K. (1978). “Models for channels with memory and their
application to error and control”, IEEE, Proceedings, Vol. 66, July 1978, pp. 724-744
Linx transmitter Data Guide (2007a). Linx Technologies, Inc., www.linxtechnologies.com/
documents/TXM-900-HP3-xxx_Data_Guide.pdf
Linx receiver Data Guide (2007b). Linx Technologies, Inc., www.linxtechnologies.com/
documents/RXM-900-HP3-xxx_Data_Guide.pdf
Liu, Y.; Mazurkiewicz, M. & Kwitek, M. (2007). “A Study towards Reliability- and Delay-
Critical Wireless Communication for RoboCup Robotic Soccer Application”,
Proceedings of 3rd IEEE International Conference on Wireless Communications,
Networking and Mobile Computing, Shanghai, China
Liu, Y. (2008). ”Enhancement of Short Range Wireless Communication Performance Using
Adaptive Frequency Hopping”, Proceedings of 4th IEEE International Conference on
Wireless Communications, Networking and Mobile Computing, Dalian, China
Rappaport, T. S. (2001). Wireless Communication: Principles and Practice, 2nd ed., Prentice Hall
Tse, D. & Viswanath, P. (2005). Fundamentals of Wireless Communication, Cambridge
University Press
Wang, H. S. & Moayeri, N. (1995). “Finite State Markov Channel – A Useful Model for radio
communication channels”, Proceedings of IEEE Transactions on Vehicular Technology,
pp. 163-171
Zander, J. & Malmgren, G. (1995). “Adaptive frequency hopping in HF communications”,
IEE Proceedings Communications, Vol. 142, Apr 1995, pp. 99-105
MobileandWirelessCommunications:Physicallayerdevelopmentandimplementation282
CapacityDimensioningforWirelessCommunicationsSystem 283
CapacityDimensioningforWirelessCommunicationsSystem
XinshengZhaoandHaoLiang
X
Capacity Dimensioning for
Wireless Communications System
Xinsheng Zhao and Hao Liang
Southeast University
P.R.China
1. Introduction
With the development of mobile communications system, lots of novel techniques in
wireless link had been invented by research institutes and adopted by different kinds of
mobile communications system standards[1-2]. Meanwhile, there are still many new
technologies emerging for standardization of next generation mobile communications
system [3].
Capacity dimensioning methods have been continuously exploited for the system capacity
performance evaluation and wireless network planning in development process of any
generation of mobile communications system. All of the capacity dimensioning approaches
can be divided into two main groups, i.e. the analytical methods and the simulation
methods. Analytical methods give the close-form expression of system capacity with system
parameters, transmission techniques and wireless network architecture, user distribution
and wireless services by establishing mathematical models and get the capacity solutions by
computer calculations. The simulation methods simulate the system process by precisely
establishing simulation platform and analyze the system capacity through Monte Carlo
simulation procedure. Performance comparisons of the two kinds of methods are shown in
table X.1.1.
simulation method
anal
y
tical method
Precision Precise under any condition Accuracy of the result depends
on the mathematical methods
Time cost Much time
Less time
Complexity
Cost a lot of computations.
Powerful computer is
necessar
y
Cost less computations
Convenience
It is not easy to establish
simulation platform
If using accurate mathematical
models, it will be convenient
to solve
p
ractical
p
roblems
Table X.1.1 Comparisons of simulation method and analytical method
16
MobileandWirelessCommunications:Physicallayerdevelopmentandimplementation284
2 Analytical Methods of Capacity Dimensioning
Analytical capacity dimensioning methods include approaches of limited system
resources-based capacity dimensioning, system interference model-based capacity
dimensioning and queue-based capacity dimensioning.
2.1 Limited System Resources-Based Analytical Approaches
Ignoring the factors of self-interference and supposing all of the radio resources be
orthogonal, limited system resources-based analytical method considers radio resources like
spectrum bandwidth in FDMA system, time slots in TDMA system, code channels in CDMA
system, subcarriers in OFDMA system, antennas in MIMO system or mixture of the radio
resources in multi-dimensions radio resource mobile communications system. By taking the
total number of radio resources occupied by system as system states and constructing
Markov chain, the system capacity can be calculated based on the stationary state
distribution of Markov chain. If system resources are modeled properly, this approach is
applicable for any kind of mobile communications system. But, it is not accurate for CDMA
system due to its self-interference.
[4] extended the Erlang B/C law to multi-service as multi-service Erlang B law and hybrid
multi-service Erlang B/C law for the performance evaluation of UMTS with multi-services.
By using Markov chain-based system resources modeling method for estimation of Erlang
capacity of CS domain voice service and recursive algorithm proposed by Kauffman and
Roberts for calculating the stationary state distribution of the Markov chain, it obtained a
closed-form expression to calculate the blocking rate for each service in a multi-service
context. And also, it got a UMTS radio dimensioning flow chart for offering more accurate
dimensioning.
[5] presented a multi-service dimensioning procedure for evaluation of the number of
CDMA cells needed in a given area based on the analysis of an original CDMA multi-service
uplink capacity estimation model and the multi-service Erlang-B formula.
[6] made a contribution to the generic problem of having simple and accurate models to
estimate radio cells with data traffic on a GPRS or EDGE network for avoiding the derivation
of any multi-dimensional Markovian (or semi-Markovian) model. On the basis of ON/OFF
modeled service, the number of time slots occupied by system could be modeled as
first-order Markov chain. Capacity of GPRS/EDGE was figured out by calculating stationary
state distribution of the Markov chain.
2.2 System Interference Model-Based Analytical Approaches
System interference model-based analytical method calculates the system capacity based on
uplink/downlink interference model in the system and Shannon information capacity
theorem. Markov chain can be used to model the number of users in the system. This method
is applicable for any kind of mobile communications system with consideration of system
interference and especially for CDMA system as the number of users in CDMA system is
restricted by the interference of uplink and the transmit power of downlink.
[7] evaluated the cell capacity of the HS-DSCH channel in HSDPA in the presence of circuit
switched (CS) services based on description of the SIR expression of an HSDPA user in the
presence of CS users and power consumption and code tree resources consumption of CS
services. Hybrid Automatic Repeat Request (HARQ), Fast Cell Selection, Adaptive
CapacityDimensioningforWirelessCommunicationsSystem 285
2 Analytical Methods of Capacity Dimensioning
Analytical capacity dimensioning methods include approaches of limited system
resources-based capacity dimensioning, system interference model-based capacity
dimensioning and queue-based capacity dimensioning.
2.1 Limited System Resources-Based Analytical Approaches
Ignoring the factors of self-interference and supposing all of the radio resources be
orthogonal, limited system resources-based analytical method considers radio resources like
spectrum bandwidth in FDMA system, time slots in TDMA system, code channels in CDMA
system, subcarriers in OFDMA system, antennas in MIMO system or mixture of the radio
resources in multi-dimensions radio resource mobile communications system. By taking the
total number of radio resources occupied by system as system states and constructing
Markov chain, the system capacity can be calculated based on the stationary state
distribution of Markov chain. If system resources are modeled properly, this approach is
applicable for any kind of mobile communications system. But, it is not accurate for CDMA
system due to its self-interference.
[4] extended the Erlang B/C law to multi-service as multi-service Erlang B law and hybrid
multi-service Erlang B/C law for the performance evaluation of UMTS with multi-services.
By using Markov chain-based system resources modeling method for estimation of Erlang
capacity of CS domain voice service and recursive algorithm proposed by Kauffman and
Roberts for calculating the stationary state distribution of the Markov chain, it obtained a
closed-form expression to calculate the blocking rate for each service in a multi-service
context. And also, it got a UMTS radio dimensioning flow chart for offering more accurate
dimensioning.
[5] presented a multi-service dimensioning procedure for evaluation of the number of
CDMA cells needed in a given area based on the analysis of an original CDMA multi-service
uplink capacity estimation model and the multi-service Erlang-B formula.
[6] made a contribution to the generic problem of having simple and accurate models to
estimate radio cells with data traffic on a GPRS or EDGE network for avoiding the derivation
of any multi-dimensional Markovian (or semi-Markovian) model. On the basis of ON/OFF
modeled service, the number of time slots occupied by system could be modeled as
first-order Markov chain. Capacity of GPRS/EDGE was figured out by calculating stationary
state distribution of the Markov chain.
2.2 System Interference Model-Based Analytical Approaches
System interference model-based analytical method calculates the system capacity based on
uplink/downlink interference model in the system and Shannon information capacity
theorem. Markov chain can be used to model the number of users in the system. This method
is applicable for any kind of mobile communications system with consideration of system
interference and especially for CDMA system as the number of users in CDMA system is
restricted by the interference of uplink and the transmit power of downlink.
[7] evaluated the cell capacity of the HS-DSCH channel in HSDPA in the presence of circuit
switched (CS) services based on description of the SIR expression of an HSDPA user in the
presence of CS users and power consumption and code tree resources consumption of CS
services. Hybrid Automatic Repeat Request (HARQ), Fast Cell Selection, Adaptive
Modulation and Coding (AMC) were revisited for the capacity calculation of the HS-DSCH
channel. Monte Carlo simulation was performed for the verification of the correction of the
analytical expressions.
[8] analytically estimated the cell throughput of HSDPA based on the analysis of distribution
of SNR and influence of AMC, HARQ and different scheduling algorithms, analyzed the
TCP model and effect of TCP on wireless network on condition of different scheduling
algorithm.
[9] presented an analytical model for the evaluation of UMTS HSDPA capacity based on the
analytical estimation of SINR for quality of service guarantee, used the model for the
capacity performance comparison of different MIMO transmission scheme (space time
coding and BLAST) and proposed the use of adaptive MIMO in the HSDPA system with the
aim of increasing cell capacity.
[10] estimated the MIMO/HSDPA cell capacity for UMTS by a proposed semi analytical
model and analytical framework. The model included the effect of fast fading, mobility and
coverage by establishing interference model with fast fading, mobility model and coverage
model. The performances of MIMO with different transmission scheme were also
investigated.
[11] compared the cell capacity of HSDPA with adaptive modulation and coding, Hybrid
ARQ, fast scheduling, fast cell selection and different MIMO transmission schemes (space
time coding and Blast) by introducing an analytical method based on the interference model
establishment.
[12] compared the cell capacity of a proposed scheduling algorithm to the cell capacity of
other scheduling algorithms in HSDPA by introducing an analytical interference model with
the assumption of a dense multipath frequency selective channel with uncorrelated signal
envelope following a Rayleigh distribution and Wide-sense Stationary Uncorrelated
Scattering (WSSUS) radio channel.
[13] evaluated the reverse link capacity of a CDMA cellular voice system by analysis of
system interference and blocking probability.
[14] defined downlink multiservice loading as performance parameter of system capacity, set
up a comprehensive downlink dimensioning framework for capacity and coverage analysis
of downlink in WCDMA system, analyzed the influence of offered bandwidth,
non-orthogonal factor, soft handover and diversity gain, output power, shadowing to system
capacity.
[15][16][17] derived the close-form expression of outage probability and the forward-link
Erlang capacity for CDMA system forward link with mixed multi-rate sources based on the
establishment of data traffic model, system interference model, introduction of the
forward-link power factor and impact of soft handoff.
[18] designed a recursive procedure for calculation of system throughput and blocking
probability in the presence of power control error in CDMA system based on the
establishment of a three-dimensional Markov chain for the integrated CS/PS system model,
intercell and intracell interference model in different conditions of perfect power control and
imperfect power control.
[19] extended the notion of capacity for the consideration of wireless service quality of
service requirements influence, evaluated the uplink capacity for single cell scenario and
multi-cell scenario of a multi-service WCDMA system based on the analysis of system
interference model, real time service model and best effort model.
MobileandWirelessCommunications:Physicallayerdevelopmentandimplementation286
[20] presented a capacity dimensioning flow chart of for WCDMA with HSDPA and HSUPA
based on the analysis of link level capacity and system level capacity. Supposing that
HSDPA system work in a TDM mode and each user has sufficient services to transmit, only
one user be scheduled during each time slot in system level capacity analysis, interference
model was established directly according to the interference model, PDF of user’s receiving
SNR used in capacity dimensioning was derived by using different scheduling algorithms.
Then, the system performances including the sector throughput and user satisfied
percentage of WCDMA with HSDPA and capacity with HSUPA were calculated.
2.3 Queue-Based Analytical Approaches
Queue-based analytical method combines Markov chain modeling of the wireless
transmission channel states in air interface and Markov chain modeling of the wireless
service transmission buffer states into a multi-dimensional Markov chain. The system
capacity can be calculated by solving the stationary state distribution of the
multi-dimensional Markov chain. Theoretically, this method is qualified to any system if the
mathematical model of Markov chain can be properly constructed for the mobile
communications system and wireless service transmission buffers.
[21] extended RIO (random early drop routers with in/out bit) algorithm to 5 class wireless
services by continuous-time 2-D Markov chain including wireless link state and wireless
services states, derived the state transition probability for the calculation of the stationary
state distribution of Markov chain by matrix analysis, obtained system performance like
system throughput and queuing delay time.
[22] compared the system performance like relative system throughput and average queued
packets number of a proposed dynamic rate allocation technique with traditional static rate
allocation technique in HSDPA system by derivation of a discrete time Markov model of the
system and establishment of three kinds of traffic models, verified the analytical method by
simulation process.
[23] [24] established system model for wireless system with adaptive modulation and coding
(AMC), analyzed system performance by Markov chain diagram describing the transition of
the pair containing both service queues and channel states, and given a cross layer design
example.
[25] developed two discrete time Markov chain for the quality of service (QoS) evaluation of
TCP-Friendly Rate Control protocol (TFRC) in hybrid wireless/wired networks, one is for
analysis of link utilization and packet loss rate, and the other is for delay performance
analysis.
[26] proposed a four-dimensional discrete time Markov chain (DTMC) model to describe the
system behavior of HSDPA system with different PS wireless services, investigated the
effect of AMC, HARQ and the packet multimedia traffics by a discrete Markov modulated
Poisson process (D-MMPP), derived closed-form expressions for the system performance
metrics such as throughput, delay and packet loss rate based on the stationary state
distribution of the DTMC, provided analytical and simulation results for the validation of
the analytical method.
CapacityDimensioningforWirelessCommunicationsSystem 287
[20] presented a capacity dimensioning flow chart of for WCDMA with HSDPA and HSUPA
based on the analysis of link level capacity and system level capacity. Supposing that
HSDPA system work in a TDM mode and each user has sufficient services to transmit, only
one user be scheduled during each time slot in system level capacity analysis, interference
model was established directly according to the interference model, PDF of user’s receiving
SNR used in capacity dimensioning was derived by using different scheduling algorithms.
Then, the system performances including the sector throughput and user satisfied
percentage of WCDMA with HSDPA and capacity with HSUPA were calculated.
2.3 Queue-Based Analytical Approaches
Queue-based analytical method combines Markov chain modeling of the wireless
transmission channel states in air interface and Markov chain modeling of the wireless
service transmission buffer states into a multi-dimensional Markov chain. The system
capacity can be calculated by solving the stationary state distribution of the
multi-dimensional Markov chain. Theoretically, this method is qualified to any system if the
mathematical model of Markov chain can be properly constructed for the mobile
communications system and wireless service transmission buffers.
[21] extended RIO (random early drop routers with in/out bit) algorithm to 5 class wireless
services by continuous-time 2-D Markov chain including wireless link state and wireless
services states, derived the state transition probability for the calculation of the stationary
state distribution of Markov chain by matrix analysis, obtained system performance like
system throughput and queuing delay time.
[22] compared the system performance like relative system throughput and average queued
packets number of a proposed dynamic rate allocation technique with traditional static rate
allocation technique in HSDPA system by derivation of a discrete time Markov model of the
system and establishment of three kinds of traffic models, verified the analytical method by
simulation process.
[23] [24] established system model for wireless system with adaptive modulation and coding
(AMC), analyzed system performance by Markov chain diagram describing the transition of
the pair containing both service queues and channel states, and given a cross layer design
example.
[25] developed two discrete time Markov chain for the quality of service (QoS) evaluation of
TCP-Friendly Rate Control protocol (TFRC) in hybrid wireless/wired networks, one is for
analysis of link utilization and packet loss rate, and the other is for delay performance
analysis.
[26] proposed a four-dimensional discrete time Markov chain (DTMC) model to describe the
system behavior of HSDPA system with different PS wireless services, investigated the
effect of AMC, HARQ and the packet multimedia traffics by a discrete Markov modulated
Poisson process (D-MMPP), derived closed-form expressions for the system performance
metrics such as throughput, delay and packet loss rate based on the stationary state
distribution of the DTMC, provided analytical and simulation results for the validation of
the analytical method.
3 Simulation Methods of Capacity Dimensioning
Simulation methods of capacity dimensioning can provide more accurate results and involve
the approaches of event driven-based simulation platform and time driven-based simulation
platform. Both of the simulation methods can be applied to any wireless communications
system with time consuming work.
3.1 Event Driven-Based Approaches
Event driven-based simulation method describes the system’s behavior by state machine
mechanism in simulation environment like OPNET or C/C++. The communications
procedures in the wireless communications system are simulated by the event drive
transitions among the established states. The average throughput, packet loss rate, custom
satisfaction and service transmission delay can be calculated in the simulation process.
[27] carried out extensive system level simulation for WCDMA system with various real time
wireless service and mixed wireless services of real time service and non-real time service by
event-based simulation implemented in OPNET platform, studied the single service capacity,
average session throughput of mixed wireless services, custom satisfaction and session
outage.
3.2 Time Driven-Based Approaches
Time driven-based simulation method simulates system behavior based on time-shift.
According to the continuous of different simulation scenarios, time driven-based simulation
methods can be divided into three groups, i.e. static, dynamic and hybrid simulation-based
capacity dimensioning.
In static simulation method, system behavior is modeled as discrete actions by a series of
irrelevant snapshot procedures.
[28] described statistic relations among the system and environment parameters
(propagation, terminal distribution within the cells, base station distribution) by the linear
equations for wireless network modeling, got the characteristics results of
transmitting/receiving power and system capacity (number of users in a cell) for UMTS
WCDMA system by simulation method.
In dynamic simulation method, the communications scenarios are relative with each other.
System parameters are treated as the functions of time which can be used to describe the
communications behavior.
[29] described a detailed simulation methodology consideration to HSDPA system based on
the analysis of key techniques in HSDPA, gave the simulation results of transmitted cell
power distribution, cell throughput, per HSDPA-user throughput by dynamic simulation in
a standard three sector network topology, and discussed environment sensitivity of
simulation platform.
[30] compared the achievable throughput performance of three different scheduling
algorithms, analyzed the influence of the number of access users and traffic on throughput
by establishing a dynamic simulation platform for HSDPA system.
[31] presented physical layer performance and system performance of HSDPA by dynamic
simulation method.
MobileandWirelessCommunications:Physicallayerdevelopmentandimplementation288
[32] established a comprehensive simulation tools for evaluation of URTRA FDD system
with mixed services of circuit switching domain and packet domain by using pipeline
mechanism for modeling of wireless channel to dynamic simulation procedure.
Hybrid simulation method is a mixture of static and dynamic simulation method. This
method usually uses static simulation method as main simulation process and embeds
dynamic simulation method into part of simulation platform. It can get more detail
simulation results than static simulation method and save time than dynamic simulation
method.
[33] presented a novel simulation method by using short-term dynamic (STD) simulation
concept, divided simulation process into two stages i.e. snapshot stage for static simulation
of system and establishment of HSDPA components for dynamic simulation in order to
make a fast UMTS HSDPA planning simulation.
[34] evaluated various performance indicators (capacity, coverage, call blocking and dropout
probabilities, packets delay and performance of burst admission) of forward link in CDMA
cellular systems with mixed services of voice and high speed packet-switched service by
using static simulation for static system capacity and cell coverage and dynamic simulations
for the influence of shadow fading in an urban environment, mobility and soft handoff
events.
4 Conclusions and Discussions
Capacity dimensioning methods can be divided into analytical approaches and simulation
approaches for wireless network in mobile communications system. Previous contributions
showed that analytical methods establish mobile communications system model by using
mathematical expressions of limited radio resources, system interference and transmission
queues for fast capacity dimensioning and simulation methods set up simulation platform by
using static, dynamic and hybrid ways to simulate the action of mobile communications
system for accurate capacity dimensioning. Both methods can be used for correctness
verification of each other.
With the development of mobile communications system and the appearance of novel
technologies in physical layer (like MIMO, OFDM and etc.), wireless network architecture
(such as flat wireless network, mesh wireless network, relay wireless network, cooperative
wireless network) and wireless services, capacity dimensioning is still an open issue for
further investigations.
5. Reference
[1] Subramanya, S.R.; Yi, B.K., ‘Mobile communications - an overview’, Potentials, IEEE
Volume 24, Issue 5, Dec. 2005 Page(s): 36–40.
[2] Erik Dahlman, Stefan Parkvall, Johan Skold and Per Beming, 3G Evolution: HSPA and
LTE for Mobile Broadband, Academic Press, October 3, 2008.
[3]
[4] Adiego D, Cordier C. ‘Multi-service radio dimensioning for UMTS circuit-switched
services’, IEEE 54th VTC, 2001, pp. 2745–2749.
CapacityDimensioningforWirelessCommunicationsSystem 289
[32] established a comprehensive simulation tools for evaluation of URTRA FDD system
with mixed services of circuit switching domain and packet domain by using pipeline
mechanism for modeling of wireless channel to dynamic simulation procedure.
Hybrid simulation method is a mixture of static and dynamic simulation method. This
method usually uses static simulation method as main simulation process and embeds
dynamic simulation method into part of simulation platform. It can get more detail
simulation results than static simulation method and save time than dynamic simulation
method.
[33] presented a novel simulation method by using short-term dynamic (STD) simulation
concept, divided simulation process into two stages i.e. snapshot stage for static simulation
of system and establishment of HSDPA components for dynamic simulation in order to
make a fast UMTS HSDPA planning simulation.
[34] evaluated various performance indicators (capacity, coverage, call blocking and dropout
probabilities, packets delay and performance of burst admission) of forward link in CDMA
cellular systems with mixed services of voice and high speed packet-switched service by
using static simulation for static system capacity and cell coverage and dynamic simulations
for the influence of shadow fading in an urban environment, mobility and soft handoff
events.
4 Conclusions and Discussions
Capacity dimensioning methods can be divided into analytical approaches and simulation
approaches for wireless network in mobile communications system. Previous contributions
showed that analytical methods establish mobile communications system model by using
mathematical expressions of limited radio resources, system interference and transmission
queues for fast capacity dimensioning and simulation methods set up simulation platform by
using static, dynamic and hybrid ways to simulate the action of mobile communications
system for accurate capacity dimensioning. Both methods can be used for correctness
verification of each other.
With the development of mobile communications system and the appearance of novel
technologies in physical layer (like MIMO, OFDM and etc.), wireless network architecture
(such as flat wireless network, mesh wireless network, relay wireless network, cooperative
wireless network) and wireless services, capacity dimensioning is still an open issue for
further investigations.
5. Reference
[1] Subramanya, S.R.; Yi, B.K., ‘Mobile communications - an overview’, Potentials, IEEE
Volume 24, Issue 5, Dec. 2005 Page(s): 36–40.
[2] Erik Dahlman, Stefan Parkvall, Johan Skold and Per Beming, 3G Evolution: HSPA and
LTE for Mobile Broadband, Academic Press, October 3, 2008.
[3]
[4] Adiego D, Cordier C. ‘Multi-service radio dimensioning for UMTS circuit-switched
services’, IEEE 54th VTC, 2001, pp. 2745–2749.
[5] Brandin H. ‘A multiservice dimensioning procedure for 3G CDMA’, 3G Mobile
Communication Technologies, 2000. First International Conference on, 27-29 March
2000 Page(s): 406-410
[6] Georges N, Bruno B, Pierre E., ‘An analytical model for the dimensioning of a
GPRS/EDGE network with a capacity constraint on a group of cells’, International
Conference on Mobile Computing and Networking, 2005.
[7] Assaad M, Zeghlache D., ‘Effect of circuit switched services on the capacity of HSDPA’,
IEEE Transactions on Wireless Communications, 2006, 5: 1044-1054.
[8] Assaad M, Zeghlache D., ‘Cross-Layer design in HSDPA system to reduce the TCP effect’,
IEEE Journal on Selected Areas in Communications, 2006, 24: 614-625.
[9] Assaad M, Zeghlache D., ‘Comparison between MIMO techniques in UMTS-HSDPA
system’, IEEE Eighth International Symposium on Spread Spectrum Techniques and
Applications, 2004, pp 874-878, Sep 2004.
[10] Assaad M, Zeghlache D. ‘MIMO/HSDPA with fast fading and mobility: capacity and
coverage study’, 15th IEEE International Symposium on Personal Indoor and
Mobile Radio Communications, 2004, 3: 2181–2186.
[11] Assaad M, Zeghlache D., ‘On the capacity of HSDPA’ IEEE GlOBECOM, 2003, 1: 60-64.
[12] Assaad M, Zeghlache D., ‘Scheduling study in HSDPA system’, IEEE 16th International
Symposium on Personal, Indoor and Mobile Radio Communications, 2005,
3:1890-1894.
[13] Viterbi A M, Viterbi A J., ‘Erlang Capacity of a Power Controlled CDMA System’, IEEE
Journal on Selected Areas in Communications, 1993, 11(6): 892-900.
[14] Cordier C, Ortega S., ‘On WCDMA downlink multiservice coverage and capacity’, IEEE
54th Vehicular Technology Conference, 2001, 4:2754 - 2758.
[15] Wan Choi, Jin Young Kim, ‘Forward-link capacity of a DS/CDMA system with mixed
multirate sources’, IEEE Transactions on Vehicular Technology, 2001, 50(3): 737–749.
[16] Wan Choi, Jin Young Kim, ‘Forward link capacity of 3G wideband CDMA system with
mixed traffic sources’, Vehicular Technology Conference IEEE 53rd VTC, 2001,
4:2620–2624.
[17] Wan Choi, Byung Shik Kang, Jun Cheol Lee, et al. ‘Forward link Erlang capacity of 3G
CDMA system’, 3G International Conference on Mobile Communication
Technologies, 2000, pp. 213–217.
[18] Lin Wang, Aghvami A H, Chambers W, et al. ‘Performance Analysis of an Integrated
CS/PS Services CDMA System’, IEEE Transactions on Vehicular Technology, 2005,
54:1488–1499.
[19] Nidhi Hegde, Eitan Altman, ‘Capacity of Multiservice WCDMA Networks with Variable
GoS’, Wireless Networks, 2006, 12(2): 241-253.
[20] Zhao X, Qi J, Liang H, ‘An Analytical Method for Capacity Dimensioning of WCDMA
with High Speed Wireless Link’, Proc. IEEE Wireless Communications and Network
Conference, pp. 4172-4176, Mar. 2007.
[21] Gyasi-Agyei A., ‘Performance analysis of differentiated services over wireless links’, 5th
IEEE International Conference on High Speed Networks and Multimedia
Communications, 2002, pp. 86–90.
[22] Caponi L, Chiti F, Fantacci, ‘A dynamic rate allocation technique for wireless
communication systems’, IEEE International Conference on Communications,
2004, 7:4263–4267.
MobileandWirelessCommunications:Physicallayerdevelopmentandimplementation290
[23] Qingwen Liu, Shengli Zhou, Georgios B Giannakis, ‘Queuing with adaptive modulation
and coding over wireless links: Cross-layer analysis and design’, IEEE transactions
on wireless communications, 2005, 4:1142-1153.
[24] Xin Wang, Qingwen Liu, Georgios B Giannakis, ‘Analyzing and Optimizing Adaptive
Modulation Coding Jointly With ARQ for QoS-Guaranteed Traffic’, IEEE
Transactions on Vehicular Technology, 2007, 56: 710-720.
[25] Shen H, Cai L, Shen X., ‘Performance analysis of TFRC over wireless link with truncated
link-level ARQ’, IEEE Transactions on Wireless Communications, 2006, 5:
1479-1487.
[26] Xinsheng Zhao; Hao Liang; Zhenjie Gu; “A Markov Chain-Based Capacity
Dimensioning Method for Wireless Communications System with AMC, HARQ
and Packet Multimedia Traffic Source” Communications, 2008. ICC' 08. IEEE
International Conference on 19-23 May 2008 Page(s):429–434
[27] Malik S A, Zeghlache D., ‘Downlink capacity and performance issues in mixed services
UMTS WCDMA networks’, IEEE 55th Vehicular Technology Conference, 2002,
4:1824-1828.
[28] Bem D J, Nawrocki M J, Wieckowski T W, et al. ‘Modeling methods for WCDMA
network planning’, IEEE 53rd Vehicular Technology Conference, 2001, 2: 962–966.
[29] Pedersen K I, Lootsma T F, Stottrup M, et al. ’Network performance of mixed traffic on
high speed downlink packet access and dedicated channels in WCDMA’, IEEE 60th
Vehicular Technology Conference, 2004, 6: 4496–4500.
[30] Ofuji Y, Morimoto A, Abeta S, et al., ‘Comparison of packet scheduling algorithms
focusing on user throughput in high speed downlink packet access’, IEEE 13th
International Symposium on Personal, Indoor and Mobile Radio Communications,
2002, 3:1462–1466.
[31] Love R, Ghosh A, Weimin Xiao, et al., ‘Performance of 3GPP high speed downlink
packet access (HSDPA)’, IEEE 60th Vehicular Technology Conference, 2004, 5:
3359–3363.
[32] Adiego and Cordier C., ‘Multi-service Radio Dimensioning for UMTS Packet-Switched
Services’, IEEE Proceeding of PIMRC, 2002, 5: 2409–2413.
[33] Turke U, Koonert M, Schelb R, et al., ‘HSDPA performance analysis in UMTS radio
network planning simulations’, IEEE 59th Vehicular Technology Conference, 2004,
5:2555–2559.
[34] Abarca-Reyna J P, Lara-Rodriguez D., ‘Performance evaluation of the downlink CDMA
cellular system supporting integrated voice/data traffic’, IEEE 61st Vehicular
Technology Conference, 2005, 5:2741–2745.