Recent Advances in Biomedical Engineering 2011 Part 2 docx
Bạn đang xem bản rút gọn của tài liệu. Xem và tải ngay bản đầy đủ của tài liệu tại đây (8.02 MB, 40 trang )
Compression of Surface Electromyographic Signals Using Two-Dimensional Techniques 29
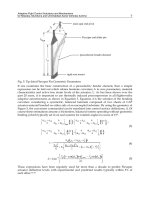
Fig. 10. One-dimensional S-EMG signal rearranged into a two-dimensional matrix.
Fig. 11. Two-dimensional real random field, x
s
[n,m], showing multiple realizations of two-
dimensionally arranged S-EMG signals.
Homogeneous random fields present translation invariant autocorrelation functions, i.e.:
1 2 1 2 1 2 2 1
, .
x x x x
R v v R x v x v R v v R v v
(5)
If we denote the position vectors
1
v
and
2
v
by their respective pair of discrete coordinates
m, n and j, i, respectively, then the autocorrelation function can be expressed as
, , , , , .
x x x
R n m i
j
R n i m
j
R i n
j
m
(6)
If we use the discrete variables k and r to denote the coordinate differences n−i and m−j,
respectively, the above equation can be rewritten as
, , , , , .
x x x
R n m i
j
R k r R k r
(7)
In general, the autocorrelation function of a random field is a function of four variables.
However, the autocorrelation function of a homogeneous random field (e.g., S-EMG data) is
a function of only two variables, k and r:
1 1
0 0
, , , , , .
N M
x
n m
R k r E x n m x n k m r x n m x n k m r
(8)
The autocovariance function, C
x
[k,r], is defined as
1 1
2 2
0 0
, , , , , .
N M
x
n m
C k r E x n m x n k m r x n m x n k m r
(9)
Under the assumption that a class of rearranged S-EMG data forms a homogeneous random
field, the autocorrelation function, R
x
[k,r], may be assumed to be of the form
2 2
, 0,0 ,
k r
x x
R k r R e
(10)
where α and β are positive constants (Rosenfeld & Kak, 1982), and where, by definition,
1 1
2
2
0 0
0,0 , , , and
N M
x
n m
R E x n m x n m
(11)
1 1
0 0
1
, , 0 .
N M
n m
E x n m x n m
NM
(12)
For rearranged S-EMG data,
0
, and the autocorrelation function is reduced to:
, 0,0 , .
k r
x x x
R k r R e C k r
(13)
Constants
α and β can be distinct, due to the nature of rearranged S-EMG data. This means
that the autocorrelation function can be used to model two-dimensional data with different
degrees of correlation in the horizontal and vertical directions, by specifying the values of
α
and β. In our method, one direction corresponds to linear time data sampling, with strong
Recent Advances in Biomedical Engineering30
correlation, and the other corresponds to window step, and leads to weak correlation. The
correlation along the window step direction may be increased using column reordering
based on inter-column correlation, as discussed in the next section.
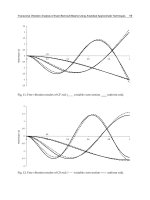
Figure 12a presents the theoretical autocorrelation function, calculated using equation (13),
with
α=0.215 and β=0.95. Figure 12b presents the autocorrelation function associated with
the S-EMG shown in Figure 10, after column reordering. These results demonstrate that
two-dimensionally arranged S-EMG data presents two-directional correlation and two-
dimensional redundancy. Therefore, this type of data may be compressed using image
compression techniques. In the next section, we present a technique for maximizing two-
dimensional S-EMG correlation and thus improving compression efficiency.
Fig. 12. Autocorrelation functions: (a) computed from the theoretical model, using
α=0.215
and
β=0.95; (b) computed from the data shown in Figure 10.
5.2 Correlation sorting
Adjacent samples of S-EMG signals are typically moderately temporally-correlated. When
the S-EMG signal is arranged into a 2D matrix, this feature is preserved along the vertical
dimension (columns). However, such correlation is generally lost along the horizontal
dimension (rows). In order to increase 2D-compression efficiency, we attempt to increase the
correlation between adjacent columns, by rearranging the columns based on their cross-
correlation coefficients.
The matrix
of column cross-correlation coefficients (R) is computed from the covariance
matrix
C, as follows:
,
, .
, ,
C u w
R u w
C u u C w w
(14)
Then, the pair of columns that present the highest cross-correlation coefficient is placed as
the first two columns of a new matrix. The column that presents the highest cross-
correlation with the second column of the new matrix is placed as the third column of the
new matrix, and so forth. A list of column positions in annotated. This procedure is similar
to that used by Filho et al. (2008b) for reordering segments of ECG signals, but the similarity
metric used in that study was the mean squared error. Figure 13 illustrates the result of
applying the proposed column-correlation sorting scheme to a S-EMG signal arranged in 2D
representation.
Fig. 13. Two-dimensionally arranged S-EMG signal (left) and associated autocorrelation
function (right): (a) without correlation sorting; (b) with correlation sorting.
5.3 Image compression techniques applied to 2D-arranged S-EMG
Figure 14 shows a block diagram of the proposed encoding scheme. The method consists in
segmenting each S-EMG signal into 512-sample windows, and then arranging these
segments as different columns of a two-dimensional matrix, which can then be compressed
using 2D algorithms. In this work, we investigated the use of two off-the-shelf image
encoders: the JPEG2000 algorithm, and the H.264/AVC encoder.
Compression of Surface Electromyographic Signals Using Two-Dimensional Techniques 31
correlation, and the other corresponds to window step, and leads to weak correlation. The
correlation along the window step direction may be increased using column reordering
based on inter-column correlation, as discussed in the next section.
Figure 12a presents the theoretical autocorrelation function, calculated using equation (13),
with
α=0.215 and β=0.95. Figure 12b presents the autocorrelation function associated with
the S-EMG shown in Figure 10, after column reordering. These results demonstrate that
two-dimensionally arranged S-EMG data presents two-directional correlation and two-
dimensional redundancy. Therefore, this type of data may be compressed using image
compression techniques. In the next section, we present a technique for maximizing two-
dimensional S-EMG correlation and thus improving compression efficiency.
Fig. 12. Autocorrelation functions: (a) computed from the theoretical model, using
α=0.215
and
β=0.95; (b) computed from the data shown in Figure 10.
5.2 Correlation sorting
Adjacent samples of S-EMG signals are typically moderately temporally-correlated. When
the S-EMG signal is arranged into a 2D matrix, this feature is preserved along the vertical
dimension (columns). However, such correlation is generally lost along the horizontal
dimension (rows). In order to increase 2D-compression efficiency, we attempt to increase the
correlation between adjacent columns, by rearranging the columns based on their cross-
correlation coefficients.
The matrix
of column cross-correlation coefficients (R) is computed from the covariance
matrix
C, as follows:
,
, .
, ,
C u w
R u w
C u u C w w
(14)
Then, the pair of columns that present the highest cross-correlation coefficient is placed as
the first two columns of a new matrix. The column that presents the highest cross-
correlation with the second column of the new matrix is placed as the third column of the
new matrix, and so forth. A list of column positions in annotated. This procedure is similar
to that used by Filho et al. (2008b) for reordering segments of ECG signals, but the similarity
metric used in that study was the mean squared error. Figure 13 illustrates the result of
applying the proposed column-correlation sorting scheme to a S-EMG signal arranged in 2D
representation.
Fig. 13. Two-dimensionally arranged S-EMG signal (left) and associated autocorrelation
function (right): (a) without correlation sorting; (b) with correlation sorting.
5.3 Image compression techniques applied to 2D-arranged S-EMG
Figure 14 shows a block diagram of the proposed encoding scheme. The method consists in
segmenting each S-EMG signal into 512-sample windows, and then arranging these
segments as different columns of a two-dimensional matrix, which can then be compressed
using 2D algorithms. In this work, we investigated the use of two off-the-shelf image
encoders: the JPEG2000 algorithm, and the H.264/AVC encoder.
Recent Advances in Biomedical Engineering32
Fig. 14. Block diagram of the proposed compression algorithm: (a) encoder; (b) decoder.
The number of columns in the 2D matrix is defined by the number of 512-sample segments.
The last (incomplete) segment is zero-padded. The matrix is scaled to the 8-bit range (0 to
255). The columns are rearranged, based on their cross-correlation coefficients. The matrix is
encoded using one of the above-mentioned image encoders. The list of original column
positions is arithmetically encoded. Scaling parameters (maximum and minimum
amplitudes) and number of samples are also stored (uncompressed).
The encoded matrix is recovered using the appropriate image decoder, and the S-EMG
signal is reconstructed by scaling the signal back to its original dynamic range and then
rearranging the matrix columns back into a one-dimensional vector.
5.4 Experimental methods
A commercial electromyograph (Delsys, Bagnoli-2, Boston, USA) was used for signal
acquisition. This equipment uses active electrodes with a pre-amplification of 10 V/V and a
pass-band of 20–450 Hz. The signals were amplified with a total gain of 1000 V/V, and
sampled at 2 kHz using a 12-bit data acquisition system (National Instruments, PCI 6024E,
Austin, TX, USA). LabView (National Instruments, Austin, TX, USA) was used for signal
acquisition, and Matlab 6.5 (The MathWorks, Inc., Natick, MA, USA) was used for signal
processing.
Isometric contraction EMG signals were obtained from 4 male healthy volunteers with 28.3
± 9.5 years of age, 1.75 ± 0.04 m height, and 70.5 ± 6.6 kg weight. Signals were measured on
the
biceps brachii muscle. In the beginning of the protocol, the maximum voluntary
contraction (MVC) was determined for each subject. The signals were collected during 60%
MVC contraction, with an angle of 90° between the arm and the forearm, and with the
subject standing. The protocol was repeated 5 times for each volunteer, with a 48-hour
interval between experiments. One of the volunteers was absent during two of the sessions.
Therefore, a total of 18 EMG signals were acquired.
The JPEG2000 algorithm was evaluated with compression rates ranging from 0.03125 to 8
bits per pixel. The H.264/AVC encoder was used in intraframe (still image) mode, with DCT
quantization parameter values ranging from 51 to 1.
The compression quality was evaluated by comparing the reconstructed signal with the
original signal. The performance of the compression algorithm was measured by two
quantitative criteria: the compression factor (CF) and the square root of the percentage root
mean difference (PRD). These two criteria are widely used for evaluating the compression of
S-EMG signals. The compression factor is defined as
CF(%) 100 ,
Os Cs
Os
(15)
where
Os is the number of bits required for storing the original data, and Cs is the number
of bits required for storing the compressed data (including overhead information). The PRD
is defined as
1
2
0
1
2
0
[ ] [ ]
PRD(%) 100 ,
[ ]
N
n
N
n
x n x n
x n
(16)
where
x is the original signal,
x
is the reconstructed signal, and N is the number of samples
in the signal.
5.5 Results
Figure 15 shows the mean PRD (as a function of CF) measured on the set of 18 isometric S-
EMG signals, using the JPEG2000 and H.264/AVC-intra compression algorithms, after
correlation-based column-reordering. The quality decreases (PRD increases) when the
compression factor is increased. With the JPEG2000 algorithm, compression factors higher
than 88% causes significant deterioration of the decoded signal. With the H.264/AVC-intra
algorithm, the results show significant degradation for compression factors higher than 85%.
Figure 16 illustrates the compression quality for a S-EMG signal measured during isometric
muscular activity. The central 2500 samples of the original, reconstructed, and error signals
are shown. In this example, correlation sorting (
c.s.) was used, with 75% compression factor.
The PRD was measured to be 2.81% and 4.65% for the JPEG2000 and H.264/AVC-intra
approaches, respectively. The noise pattern observed for both approaches seems visually
uncorrelated with the signal.
Table 1 shows mean PRD values measured using different compression algorithms, for
isometric contraction signals. The JPEG2000-based method provided slightly better
reconstruction quality (lower PRD) than the EZW-based algorithm by Norris et al. (2001) for
compression factors values ≤85%. However, this difference was not statistically significant.
Compared with the method by Berger et al. (2006), JPEG2000 showed moderately inferior
overall performance. This is especially true for 90% compression, in which its performance is
comparable to that achieved by Berger et al. The H.264/AVC-based method showed low
overall performance. The signal acquisition protocols used by Norris et al. (2001) and Berger
et al. (2006) were similar to the one used in this work: 12-bit resolution, 2 kHz sampling rate,
S-EMG isometric contractions measured on the
biceps brachii muscle. However, some details
of the acquisition protocols were not discussed in the work by Norris et al., (e.g., the
distance between electrodes). The signals used in that work may present characteristics that
are relevantly different from the those of the signals used in this work.
Compression of Surface Electromyographic Signals Using Two-Dimensional Techniques 33
Fig. 14. Block diagram of the proposed compression algorithm: (a) encoder; (b) decoder.
The number of columns in the 2D matrix is defined by the number of 512-sample segments.
The last (incomplete) segment is zero-padded. The matrix is scaled to the 8-bit range (0 to
255). The columns are rearranged, based on their cross-correlation coefficients. The matrix is
encoded using one of the above-mentioned image encoders. The list of original column
positions is arithmetically encoded. Scaling parameters (maximum and minimum
amplitudes) and number of samples are also stored (uncompressed).
The encoded matrix is recovered using the appropriate image decoder, and the S-EMG
signal is reconstructed by scaling the signal back to its original dynamic range and then
rearranging the matrix columns back into a one-dimensional vector.
5.4 Experimental methods
A commercial electromyograph (Delsys, Bagnoli-2, Boston, USA) was used for signal
acquisition. This equipment uses active electrodes with a pre-amplification of 10 V/V and a
pass-band of 20–450 Hz. The signals were amplified with a total gain of 1000 V/V, and
sampled at 2 kHz using a 12-bit data acquisition system (National Instruments, PCI 6024E,
Austin, TX, USA). LabView (National Instruments, Austin, TX, USA) was used for signal
acquisition, and Matlab 6.5 (The MathWorks, Inc., Natick, MA, USA) was used for signal
processing.
Isometric contraction EMG signals were obtained from 4 male healthy volunteers with 28.3
± 9.5 years of age, 1.75 ± 0.04 m height, and 70.5 ± 6.6 kg weight. Signals were measured on
the
biceps brachii muscle. In the beginning of the protocol, the maximum voluntary
contraction (MVC) was determined for each subject. The signals were collected during 60%
MVC contraction, with an angle of 90° between the arm and the forearm, and with the
subject standing. The protocol was repeated 5 times for each volunteer, with a 48-hour
interval between experiments. One of the volunteers was absent during two of the sessions.
Therefore, a total of 18 EMG signals were acquired.
The JPEG2000 algorithm was evaluated with compression rates ranging from 0.03125 to 8
bits per pixel. The H.264/AVC encoder was used in intraframe (still image) mode, with DCT
quantization parameter values ranging from 51 to 1.
The compression quality was evaluated by comparing the reconstructed signal with the
original signal. The performance of the compression algorithm was measured by two
quantitative criteria: the compression factor (CF) and the square root of the percentage root
mean difference (PRD). These two criteria are widely used for evaluating the compression of
S-EMG signals. The compression factor is defined as
CF(%) 100 ,
Os Cs
Os
(15)
where
Os is the number of bits required for storing the original data, and Cs is the number
of bits required for storing the compressed data (including overhead information). The PRD
is defined as
1
2
0
1
2
0
[ ] [ ]
PRD(%) 100 ,
[ ]
N
n
N
n
x n x n
x n
(16)
where
x is the original signal,
x
is the reconstructed signal, and N is the number of samples
in the signal.
5.5 Results
Figure 15 shows the mean PRD (as a function of CF) measured on the set of 18 isometric S-
EMG signals, using the JPEG2000 and H.264/AVC-intra compression algorithms, after
correlation-based column-reordering. The quality decreases (PRD increases) when the
compression factor is increased. With the JPEG2000 algorithm, compression factors higher
than 88% causes significant deterioration of the decoded signal. With the H.264/AVC-intra
algorithm, the results show significant degradation for compression factors higher than 85%.
Figure 16 illustrates the compression quality for a S-EMG signal measured during isometric
muscular activity. The central 2500 samples of the original, reconstructed, and error signals
are shown. In this example, correlation sorting (
c.s.) was used, with 75% compression factor.
The PRD was measured to be 2.81% and 4.65% for the JPEG2000 and H.264/AVC-intra
approaches, respectively. The noise pattern observed for both approaches seems visually
uncorrelated with the signal.
Table 1 shows mean PRD values measured using different compression algorithms, for
isometric contraction signals. The JPEG2000-based method provided slightly better
reconstruction quality (lower PRD) than the EZW-based algorithm by Norris et al. (2001) for
compression factors values ≤85%. However, this difference was not statistically significant.
Compared with the method by Berger et al. (2006), JPEG2000 showed moderately inferior
overall performance. This is especially true for 90% compression, in which its performance is
comparable to that achieved by Berger et al. The H.264/AVC-based method showed low
overall performance. The signal acquisition protocols used by Norris et al. (2001) and Berger
et al. (2006) were similar to the one used in this work: 12-bit resolution, 2 kHz sampling rate,
S-EMG isometric contractions measured on the
biceps brachii muscle. However, some details
of the acquisition protocols were not discussed in the work by Norris et al., (e.g., the
distance between electrodes). The signals used in that work may present characteristics that
are relevantly different from the those of the signals used in this work.
Recent Advances in Biomedical Engineering34
Fig. 15. Compression performance comparison (CF vs. PRD) between the JPEG2000 and
H.264/AVC-intra image encoders, using the correlation sorting preprocessing step.
Fig. 16. Representative results for a 1250-ms segment of a S-EMG signal. (CF=75%): (a)
uncompressed; (b)
c.s. + JPEG2000; (c) c.s. + H.264/AVC-intra; (d) JPEG2000 reconstruction
error; (e) H.264/AVC-intra reconstruction error. Reconstruction errors are magnified by 10-
fold.
Compression Factor 75% 80% 85% 90%
Norris et al. 3.8 5 7.8 13
Berger et al. 2.5 3.3 6.5 13
JPEG2000 3.58 4.60 7.05 13.63
c.s. + JPEG2000 3.50 4.48 6.92 13.44
H.264/AVC-intra 5.51 7.03 10.01 16.68
c.s. + H.264/AVC-intra 5.37 6.90 9.93 16.62
Table 1. Mean PRD (in %) for isometric contraction signals.
The improvement in compression performance achieved using the proposed preprocessing
stage (correlation-based column reordering) was not significant (Table 1). Column
reordering increases inter-column correlation and improves compression efficiency.
However the addition of overhead information increases the overall data size, resulting in
similar PRD values. Better results may be achieved in the context of isotonic contractions, in
which data redundancy is more significantly increased by the proposed approach.
6. Conclusions
This chapter presented a method for compression of surface electromyographic signals
using off-the-shelf image compression algorithms. Two widely used image encoders were
evaluated: JPEG2000 and H.264/AVC-intra. We showed that two-dimensionally arranged
electromyographic signals may be modeled as random fields with well-determined
autocorrelation function properties. A preprocessing step was proposed for increasing inter-
column correlation and improving 2D compression efficiency.
The proposed scheme was evaluated on surface electromyographic signals measured during
isometric contractions. We showed that commonly available algorithms can be effectively
used for compression of electromyographic signals, with a performance that is comparable
or better than that of other S-EMG compression algorithms proposed in the literature. We
also showed that correlation sorting preprocessing may potentially improve the
performance of the proposed method.
The JPEG2000 and H.264/AVC-intra image encoding standards are well-established and
widely-used, and fast and reliable implementations of these algorithms are readily-available
in several operational systems, software applications, and portable systems. These are
important aspects to be considered when selecting a compression scheme for specific
biomedical applications, and represent promising features of the proposed approach.
7. References
Acharya, T. & Tsai, P. S. (2004). JPEG2000 Standard for Image Compression: Concepts,
Algorithms and VLSI Architectures
. John Wiley & Sons, ISBN 9780471484226,
Hoboken, NJ, USA.
Basmajian, J. V. & De Luca, C. J. (1985).
Muscles Alive: Their Functions Revealed by
Electromyography
. Williams & Wilkins, ISBN 9780683004144, Baltimore, USA.
Compression of Surface Electromyographic Signals Using Two-Dimensional Techniques 35
Fig. 15. Compression performance comparison (CF vs. PRD) between the JPEG2000 and
H.264/AVC-intra image encoders, using the correlation sorting preprocessing step.
Fig. 16. Representative results for a 1250-ms segment of a S-EMG signal. (CF=75%): (a)
uncompressed; (b)
c.s. + JPEG2000; (c) c.s. + H.264/AVC-intra; (d) JPEG2000 reconstruction
error; (e) H.264/AVC-intra reconstruction error. Reconstruction errors are magnified by 10-
fold.
Compression Factor 75% 80% 85% 90%
Norris et al. 3.8 5 7.8 13
Berger et al. 2.5 3.3 6.5 13
JPEG2000 3.58 4.60 7.05 13.63
c.s. + JPEG2000 3.50 4.48 6.92 13.44
H.264/AVC-intra 5.51 7.03 10.01 16.68
c.s. + H.264/AVC-intra 5.37 6.90 9.93 16.62
Table 1. Mean PRD (in %) for isometric contraction signals.
The improvement in compression performance achieved using the proposed preprocessing
stage (correlation-based column reordering) was not significant (Table 1). Column
reordering increases inter-column correlation and improves compression efficiency.
However the addition of overhead information increases the overall data size, resulting in
similar PRD values. Better results may be achieved in the context of isotonic contractions, in
which data redundancy is more significantly increased by the proposed approach.
6. Conclusions
This chapter presented a method for compression of surface electromyographic signals
using off-the-shelf image compression algorithms. Two widely used image encoders were
evaluated: JPEG2000 and H.264/AVC-intra. We showed that two-dimensionally arranged
electromyographic signals may be modeled as random fields with well-determined
autocorrelation function properties. A preprocessing step was proposed for increasing inter-
column correlation and improving 2D compression efficiency.
The proposed scheme was evaluated on surface electromyographic signals measured during
isometric contractions. We showed that commonly available algorithms can be effectively
used for compression of electromyographic signals, with a performance that is comparable
or better than that of other S-EMG compression algorithms proposed in the literature. We
also showed that correlation sorting preprocessing may potentially improve the
performance of the proposed method.
The JPEG2000 and H.264/AVC-intra image encoding standards are well-established and
widely-used, and fast and reliable implementations of these algorithms are readily-available
in several operational systems, software applications, and portable systems. These are
important aspects to be considered when selecting a compression scheme for specific
biomedical applications, and represent promising features of the proposed approach.
7. References
Acharya, T. & Tsai, P. S. (2004). JPEG2000 Standard for Image Compression: Concepts,
Algorithms and VLSI Architectures
. John Wiley & Sons, ISBN 9780471484226,
Hoboken, NJ, USA.
Basmajian, J. V. & De Luca, C. J. (1985).
Muscles Alive: Their Functions Revealed by
Electromyography
. Williams & Wilkins, ISBN 9780683004144, Baltimore, USA.
Recent Advances in Biomedical Engineering36
Berger, P. A.; Nascimento, F. A. O.; do Carmo, J. C. & da Rocha, A. F. (2006). Compression of
EMG Signals with Wavelet Transform and Artificial Neural Networks,
Physiological
Measurement
, Vol. 27, No. 6, pp. 457–465, ISSN 1361-6597.
Bilgin, A.; Marcellin, M. W. & Altbach, M. I. (2003). Compression of Electrocardiogram
Signals using JPEG2000.
IEEE Transactions on Consumer Electronics. Vol. 49, No. 4,
pp. 833–840, ISSN 0098-3063.
Brechet, L.; Lucas, M F.; Doncarli, C. & Farina, D. (2007). Compression of biomedical signals
with mother wavelet optimization and best-basis wavelet packet selection.
IEEE
Transactions on Biomedical Engineering
, Vol. 54, No. 12, pp. 2186–2192, ISSN 0018-
9294.
Carotti, E. S. G.; De Martin, J. C.; Merletti, R. & Farina, D. (2006). Compression of surface
EMG signals with algebraic code excited linear prediction.
Proceedings of IEEE
International Conference on Acoustics, Speech and Signal Processing
, pp. 1148–1151,
ISBN 142440469X, Tolouse, France, May 2006.
Chou, H-H.; Chen, Y-J.; Shiau, Y-C. & Kuo, T-S. (2006). An effective and efficient
compression algorithm for ECG signals with irregular periods.
IEEE Transactions on
Biomedical Engineering
, Vol. 53, No. 6, pp. 1198–1205, ISSN 0018-9294.
Daubechies, I. (1988). Orthogonal bases of compactly supported wavelets.
Communications
on Pure and Applied Mathematics.
Vol. 41, No. 7, pp. 909–996, ISSN 0010-3640.
Filho, E. B. L.; da Silva, E. A. B. & de Carvalho, M. B. (2008a). On EMG signal compression
with recurrent patterns.
IEEE Transactions on Biomedical Engineering, Vol. 55, No. 7,
pp. 1920–1923, ISSN 0018-9294.
Filho, E. B. L.; Rodrigues, N. M. M.; da Silva, E. A. B.; de Faria, S. M. M.; da Silva, V. M. M. &
de Carvalho, M. B. (2008b). ECG signal compression based on DC equalization and
complexity sorting.
IEEE Transactions on Biomedical Engineering, Vol. 55, No. 7, pp.
1923–1926, ISSN 0018-9294.
Gersho, A. & Gray, R. (1992).
Vector quantization and signal compression. Kluwer Academic
Publishers, ISBN 0792391810, Norwell, MA, USA.
Guerrero, A. P. & Mailhes, C. (1997). On the choice of an electromyogram data compression
method.
Proceedings of the 19th Annual International Conference of the IEEE
Engineering in Medicine and Biology Society
, pp. 1558–1561, ISBN 0780342623,
Chicago, IL, USA, Oct. 30-Nov. 2 1997.
Huffman, D. A. (1952). A method for the construction of minimum-redundancy codes.
Proceedings of the Institute of Radio Engineers, Vol. 40, No. 9, pp. 1098–1101.
Jayant, N. S. & Noll, P. (1984).
Digital coding of waveforms – principles and application to speech
and video
. Prentice Hall, Inc., ISBN 9780132119139, Englewood Cliffs, NJ, USA.
Lu, Z.; Kim, Y. D. & Pearlman, A. W. (2000). Wavelet compression of ECG signals by the set
partitioning in hierarchical trees algorithm.
IEEE Transactions on Biomedical
Engineering
. Vol. 47, No. 7, pp. 849–856, ISSN 0018-9294.
Mallat, S. G. (1989). A theory for multiresolution signal decomposition: the wavelet
representation.
IEEE Transactions on Pattern Analysis and Machine Intelligence. Vol.
11, No. 7, pp. 674–693, ISSN 0162-8828.
Merletti, R. & Parker, P. (2004). Electromyography: Engineering and Noninvasive Applications,
John Wiley & Sons – IEEE Press, ISBN 9780471675808, Hoboken, NJ, USA.
Miaou, S. & Chao, S. (2005). Wavelet-based lossy-to-lossless ECG compresion in a unified
vector quantization framework.
IEEE Transactions on Biomedical Engineering. Vol. 52,
No. 3, pp. 539–543, ISSN 0018-9294.
Moazami-Goudarzi, M.; Moradi, M. H. & Abbasabadi, S. (2005). High performance method
for electrocardiogram compression using two dimensional multiwavelet transform.
IEEE 7th Workshop on Multimedia Signal Processing, pp. 1–5, ISBN 0780392884,
Shanghai, Oct. 30-Nov. 2 2005.
Naït-Ali, A. & Cavaro-Ménard, C. (2008).
Compression of Biomedical Images and Signals, ISTE -
John Wiley & Sons, ISBN 9781848210288, London, UK - Hoboken, NJ, USA.
Norris, J. A.; Englehart, K. & Lovely, D. (2001). Steady-state and dynamic myoelectric signal
compression using embedded zero-tree wavelets,
Proceedings of 23rd Annual
International Conference of the IEEE Engineering in Medicine Biology Society
, pp. 1879–
1882, ISBN 0780372115, Istanbul, Turkey, Oct. 2001.
Norris, J. F. & Lovely, D. F. (1995). Real-time compression of myoelectric data utilizing
adaptive differential pulse code modulation.
Medical and Biological Engineering and
Computing
, Vol. 33, No. 5, pp. 629–635, ISSN 0140-0118.
Paiva, J. P. L. M.; Kelencz, C. A.; Paiva, H. M.; Galvão, R. K. H. & Magini, M. (2008).
Adaptive wavelet EMG compression based on local optimization of filter banks,
Physiological Measurement, Vol. 29, No. 7, pp. 843–856, ISSN 1361-6597.
Pooyan, M.; Moazami-Goudarzi, M. & Saboori, I. (2004). Wavelet compression of ECG
signals using SPIHT algorithm.
IEEE International Journal of Signal Processing, Vol. 1,
No. 4, pp. 219–225, ISSN 2070-397X.
Rezazadeh, I. M.; Moradi, M. H. & Nasrabadi, A. M. (2005). Implementing of SPIHT and
sub-band energy compression (SEC) method on two-dimensional ECG
compression: a novel approach.
27th Annual International Conference of the
Engineering in Medicine and Biology Society,
pp. 3763–3766. ISBN 0780387414,
Shanghai, 17-18 Jan. 2006.
Richardson I. E. G. (2003).
H.264 and MPEG-4 Video Compression: Video Coding for Next-
generation Multimedia
. Wiley, ISBN 9780470848371, UK.
Rosenfeld, A. & Kak, A. C. (1982).
Digital picture Processing (Volume 1): 2nd Ed. Academic
Press. Inc, ISBN
0125973012, San Diego, CA, USA.
Sahraeian, S. M. E. & Fatemizadeh, E. (2007). Wavelet-based 2-D ECG data compression
method using SPIHT and VQ coding.
The International Conference on "Computer as a
Tool", EUROCON, 2007
, pp. 133–137. ISBN 9781424408139, Warsaw, 9-12 Sept. 2007.
Said, A. & Pearlman, W. A. (1996). A new, fast, and efficient image codec based on set
partitioning in hierarchical trees.
IEEE Transactions on Circuits and Systems for Video
Technology
, Vol. 6, No. 3, pp. 243–250. ISSN 1051-8215.
Salomon, D. (2006).
Data Compression: The Complete Reference, 4th ed., Springer, ISBN
9781846286025, London, UK.
Sayood, K. (2005).
Introduction to Data Compression, 3rd ed., Morgan Kaufmann Publishers,
ISBN 9780126208627, San Francisco, CA, USA.
Shannon, C. E. (1948). A mathematical theory of communication.
Bell System Technical
Journal,
Vol. 27, July and October, pp. 379-423 and 623-656.
Shapiro, J. M. (1993). Embedded image coding using zerotrees of wavelet coefficients.
IEEE
Transactions on Signal Processing,
, Vol. 41, No. 12, pp. 3445–3462, ISSN 1053-587X.
Compression of Surface Electromyographic Signals Using Two-Dimensional Techniques 37
Berger, P. A.; Nascimento, F. A. O.; do Carmo, J. C. & da Rocha, A. F. (2006). Compression of
EMG Signals with Wavelet Transform and Artificial Neural Networks,
Physiological
Measurement
, Vol. 27, No. 6, pp. 457–465, ISSN 1361-6597.
Bilgin, A.; Marcellin, M. W. & Altbach, M. I. (2003). Compression of Electrocardiogram
Signals using JPEG2000.
IEEE Transactions on Consumer Electronics. Vol. 49, No. 4,
pp. 833–840, ISSN 0098-3063.
Brechet, L.; Lucas, M F.; Doncarli, C. & Farina, D. (2007). Compression of biomedical signals
with mother wavelet optimization and best-basis wavelet packet selection.
IEEE
Transactions on Biomedical Engineering
, Vol. 54, No. 12, pp. 2186–2192, ISSN 0018-
9294.
Carotti, E. S. G.; De Martin, J. C.; Merletti, R. & Farina, D. (2006). Compression of surface
EMG signals with algebraic code excited linear prediction.
Proceedings of IEEE
International Conference on Acoustics, Speech and Signal Processing
, pp. 1148–1151,
ISBN 142440469X, Tolouse, France, May 2006.
Chou, H-H.; Chen, Y-J.; Shiau, Y-C. & Kuo, T-S. (2006). An effective and efficient
compression algorithm for ECG signals with irregular periods.
IEEE Transactions on
Biomedical Engineering
, Vol. 53, No. 6, pp. 1198–1205, ISSN 0018-9294.
Daubechies, I. (1988). Orthogonal bases of compactly supported wavelets.
Communications
on Pure and Applied Mathematics.
Vol. 41, No. 7, pp. 909–996, ISSN 0010-3640.
Filho, E. B. L.; da Silva, E. A. B. & de Carvalho, M. B. (2008a). On EMG signal compression
with recurrent patterns.
IEEE Transactions on Biomedical Engineering, Vol. 55, No. 7,
pp. 1920–1923, ISSN 0018-9294.
Filho, E. B. L.; Rodrigues, N. M. M.; da Silva, E. A. B.; de Faria, S. M. M.; da Silva, V. M. M. &
de Carvalho, M. B. (2008b). ECG signal compression based on DC equalization and
complexity sorting.
IEEE Transactions on Biomedical Engineering, Vol. 55, No. 7, pp.
1923–1926, ISSN 0018-9294.
Gersho, A. & Gray, R. (1992).
Vector quantization and signal compression. Kluwer Academic
Publishers, ISBN 0792391810, Norwell, MA, USA.
Guerrero, A. P. & Mailhes, C. (1997). On the choice of an electromyogram data compression
method.
Proceedings of the 19th Annual International Conference of the IEEE
Engineering in Medicine and Biology Society
, pp. 1558–1561, ISBN 0780342623,
Chicago, IL, USA, Oct. 30-Nov. 2 1997.
Huffman, D. A. (1952). A method for the construction of minimum-redundancy codes.
Proceedings of the Institute of Radio Engineers, Vol. 40, No. 9, pp. 1098–1101.
Jayant, N. S. & Noll, P. (1984).
Digital coding of waveforms – principles and application to speech
and video
. Prentice Hall, Inc., ISBN 9780132119139, Englewood Cliffs, NJ, USA.
Lu, Z.; Kim, Y. D. & Pearlman, A. W. (2000). Wavelet compression of ECG signals by the set
partitioning in hierarchical trees algorithm.
IEEE Transactions on Biomedical
Engineering
. Vol. 47, No. 7, pp. 849–856, ISSN 0018-9294.
Mallat, S. G. (1989). A theory for multiresolution signal decomposition: the wavelet
representation.
IEEE Transactions on Pattern Analysis and Machine Intelligence. Vol.
11, No. 7, pp. 674–693, ISSN 0162-8828.
Merletti, R. & Parker, P. (2004). Electromyography: Engineering and Noninvasive Applications,
John Wiley & Sons – IEEE Press, ISBN 9780471675808, Hoboken, NJ, USA.
Miaou, S. & Chao, S. (2005). Wavelet-based lossy-to-lossless ECG compresion in a unified
vector quantization framework.
IEEE Transactions on Biomedical Engineering. Vol. 52,
No. 3, pp. 539–543, ISSN 0018-9294.
Moazami-Goudarzi, M.; Moradi, M. H. & Abbasabadi, S. (2005). High performance method
for electrocardiogram compression using two dimensional multiwavelet transform.
IEEE 7th Workshop on Multimedia Signal Processing, pp. 1–5, ISBN 0780392884,
Shanghai, Oct. 30-Nov. 2 2005.
Naït-Ali, A. & Cavaro-Ménard, C. (2008).
Compression of Biomedical Images and Signals, ISTE -
John Wiley & Sons, ISBN 9781848210288, London, UK - Hoboken, NJ, USA.
Norris, J. A.; Englehart, K. & Lovely, D. (2001). Steady-state and dynamic myoelectric signal
compression using embedded zero-tree wavelets,
Proceedings of 23rd Annual
International Conference of the IEEE Engineering in Medicine Biology Society
, pp. 1879–
1882, ISBN 0780372115, Istanbul, Turkey, Oct. 2001.
Norris, J. F. & Lovely, D. F. (1995). Real-time compression of myoelectric data utilizing
adaptive differential pulse code modulation.
Medical and Biological Engineering and
Computing
, Vol. 33, No. 5, pp. 629–635, ISSN 0140-0118.
Paiva, J. P. L. M.; Kelencz, C. A.; Paiva, H. M.; Galvão, R. K. H. & Magini, M. (2008).
Adaptive wavelet EMG compression based on local optimization of filter banks,
Physiological Measurement, Vol. 29, No. 7, pp. 843–856, ISSN 1361-6597.
Pooyan, M.; Moazami-Goudarzi, M. & Saboori, I. (2004). Wavelet compression of ECG
signals using SPIHT algorithm.
IEEE International Journal of Signal Processing, Vol. 1,
No. 4, pp. 219–225, ISSN 2070-397X.
Rezazadeh, I. M.; Moradi, M. H. & Nasrabadi, A. M. (2005). Implementing of SPIHT and
sub-band energy compression (SEC) method on two-dimensional ECG
compression: a novel approach.
27th Annual International Conference of the
Engineering in Medicine and Biology Society,
pp. 3763–3766. ISBN 0780387414,
Shanghai, 17-18 Jan. 2006.
Richardson I. E. G. (2003).
H.264 and MPEG-4 Video Compression: Video Coding for Next-
generation Multimedia
. Wiley, ISBN 9780470848371, UK.
Rosenfeld, A. & Kak, A. C. (1982).
Digital picture Processing (Volume 1): 2nd Ed. Academic
Press. Inc, ISBN
0125973012, San Diego, CA, USA.
Sahraeian, S. M. E. & Fatemizadeh, E. (2007). Wavelet-based 2-D ECG data compression
method using SPIHT and VQ coding.
The International Conference on "Computer as a
Tool", EUROCON, 2007
, pp. 133–137. ISBN 9781424408139, Warsaw, 9-12 Sept. 2007.
Said, A. & Pearlman, W. A. (1996). A new, fast, and efficient image codec based on set
partitioning in hierarchical trees.
IEEE Transactions on Circuits and Systems for Video
Technology
, Vol. 6, No. 3, pp. 243–250. ISSN 1051-8215.
Salomon, D. (2006).
Data Compression: The Complete Reference, 4th ed., Springer, ISBN
9781846286025, London, UK.
Sayood, K. (2005).
Introduction to Data Compression, 3rd ed., Morgan Kaufmann Publishers,
ISBN 9780126208627, San Francisco, CA, USA.
Shannon, C. E. (1948). A mathematical theory of communication.
Bell System Technical
Journal,
Vol. 27, July and October, pp. 379-423 and 623-656.
Shapiro, J. M. (1993). Embedded image coding using zerotrees of wavelet coefficients.
IEEE
Transactions on Signal Processing,
, Vol. 41, No. 12, pp. 3445–3462, ISSN 1053-587X.
Recent Advances in Biomedical Engineering38
Sharifahmadian, E. (2006). Wavelet compression of multichannel ECG data by enhanced set
partitioning in hierarchical trees algorithm.
28th Annual International Conference of
the IEEE Engineering in Medicine and Biology Society
, pp. 5238–5243, New York City,
USA, July 30-Aug. 3 2006.
Sörnmo, L. & Laguna, P. (2006). Electrocardiogram (ECG) signal processing. In:
Wiley
Encyclopedia of Biomedical Engineering (Vol. 2)
, Metin Akay (Ed.), pp. 1298–1313, John
Wiley & Sons, ISBN 9780471249672.
Strang, G. & Nguyen, T. (1996).
Wavelets and Filter Banks. Wellesley-Cambridge Press, ISBN
0961408871, Wellesley, MA, USA.
Sullivan, G.; Topiwala, P. & Luthra, A. (2004). The H.264/AVC advanced video coding
standard: Overview and introduction to the fidelity range extensions.
Proceedings of
SPIE Conference on Applications of Digital Image Processing XXVII, Special Session on
Advances in the New Emerging Standard: H.264/AVC
, Vol. 5558 (2), pp. 454–474. ISBN
0819454966, Denver, CO, USA, 2-6 August 2004.
Tai, S-C.; Sun C-C. & Yan, W-C. (2005). A 2-D ECG compression method based on wavelet
transform and modified SPIHT.
IEEE Transactions on Biomedical Engineering, Vol. 52,
No. 6, pp. 999–1008, ISSN 0018-9294.
Taubman, D. S. & Marcellin, M. W. (2002),
JPEG2000: Image Compression Fundamentals,
Standards and Practice
, Springer, ISBN 079237519X, Boston, USA.
Taubman, D. S. (2000). High performance scalable image compression with EBCOT.
IEEE
Transactions on Image Processing
, Vol. 9, No. 7, pp. 1158–1170, ISSN 1057-7149.
Vetterli, M. & Kovačević, J. (1995)
Wavelets and Subband Coding, Prentice-Hall, ISBN
0130970808, Englewood Cliffs, NJ, USA.
Wellig, P.; Zhenlan, C.; Semling, M. & Moschytz G. S. (1998). Electromyogram data
compression using single-tree and modified zero-tree wavelet encoding.
Proceedings
of the 20th Annual International Conference of the IEEE Engineering in Medicine and
Biology Societ,
ISBN 0780351649, pp. 1303–1306. Hong Kong, China, Oct. 29-Nov. 1
1998.
Wiegand, T.; Sullivan, G. J.; Bjontegaard, G. & Luthra, A. (2003). Overview of the
H.264/AVC video coding standard.
IEEE Transactions on Circuits and Systems for
Video Technology
, Vol. 13, No. 7, pp. 560–576, ISSN 1051-8215.
Witten, I.; Neal, R. & Cleary, J. (1987). Arithmetic coding for data compression.
Communications of the ACM, Vol. 30, No. 6, pp. 520–540, ISSN 0001-0782.
A New Method for Quantitative Evaluation of Neurological Disorders based on EMG signals 39
A New Method for Quantitative Evaluation of Neurological Disorders
based on EMG signals
Jongho Lee, Yasuhiro Kagamihara and Shinji Kakei
X
A New Method for Quantitative Evaluation of
Neurological Disorders based on EMG signals
Jongho Lee
1
, Yasuhiro Kagamihara
2
and Shinji Kakei
1
1
Behavioral Physiology, Tokyo Metropolitan Institute for Neuroscience
2
Tokyo Metropolitan Neurological Hospital
Japan
1. Introduction
In this chapter, we propose a novel method to make a quantitative evaluation of
neurological disorders based on EMG signals from multiple muslces. So far, some
researchers tried to evaluate arm movements in various conditions (Nakanishi et al., 1992;
Nakanishi et al., 2000; Sanguineti et al., 2003). They captured some features of movement
disorders in patients with neurological diseases such as Parkinson’s disease or cerebellar
atrophy. However, the scope of these analyses was limited to movement kinematics. The
problem here is that the movement kinematics, in general, cannot specify its causal muscle
activities (i.e. motor commands) due to the well-known redundancy of the musculo-skeletal
system. Thus, in order to understand central mechanisms for generation of pathological
movements, it is essential to capture causal anomaly of the motor commands directly, rather
than to observe the resultant movement indirectly (Manto, 1996; Brown et al., 1997). It
should be also emphasized that the new method must be simple and noninvasive for wider
clinical application.
To address these issues, we developed a novel method to identify causal muscle activities
for movement disorders of the wrist joint. In order to determine causal relationship between
muscle activities and movement disorders, we approximated the relationship between the
wrist joint torque calculated from the movement kinematics and the four EMG signals using
a dynamics model of the wrist joint (see Section 3.2). Consequently, we found that the
correlation between the wrist joint torque and the EMG signals were surprisingly high for
cerebellar patients as well as for normal controls (see Section 3.3). These results
demonstrated a causal relationship between the activities of the selected muscles and the
movement kinematics. In fact, we confirmed the effectiveness of our method, identifying the
causal abnormality of muscle activities for the cerebellar ataxia in detail (see Section 3.4).
Finally, we further extended our analysis to calculate parameters that characterize
pathological patterns of the muscle activities (see Section 4.1). We will conclude this chapter
by discussing the application and clinical value of these parameters (see Section 4.2).
3
Recent Advances in Biomedical Engineering40
2. Materials and Methods
2.1 Experimental apparatus
In order to make a quantitative evaluation of neurological disorders, we developed a system
for quantitative evaluation of motor command using wrist movements (Lee et al, 2007).
Specifically, we intended to analyze the causal relationship between movement disorders
and abnormal muscle activities. In addition, the system was also designed to be non-
invasive and used handily at the bedside.
An outline of the system is shown in Figure 1. It consists of four components, a wrist joint
manipulandum, a notebook computer, a small Universal Serial Bus (USB) analog-to-digital
(A/D) converter interface and a multi-channel amplifier for surface electromyogram (EMG)
signal. Movement of the wrist joint is measured with 2 position sensors of the
manipulandum at 2 kHz sampling rate, and the wrist position is linked to the position of the
cursor on the computer display. In other words, the manipulandum worked as a mouse for
the wrist joint. Consequently, we can analyze the relationship between movement disorders
and muscle activities, while subjects perform various wrist movement tasks using the
manipulandum.
Fig. 1. Outline of the quantitative evaluation system for motor function using wrist
movement
2.2 Experimental task
Subjects sat on a chair and grasped the manipulandum with his/her right hand. The
forearm was comfortably supported by an armrest. As the experimental task, we asked
subjects to perform step-tracking wrist movements (Figure 2A) and pursuit wrist
movements (Figure 2B).
Fig. 2. Experimental tasks : step-tracking wrist movement (A) and pursuit wrist movement
(B). To make these wrist movement tasks, the subject holds the forearm in the neutral
position, midway between full pronation and full supination.
1. Step-tracking wrist movement
When a circular target, whose diameter was 1 cm, was displayed at the center of the monitor,
the subject was required to move the cursor into the target. When a new target was shown at
a place equivalent to 18 degrees of the wrist joint movement, the subjects had to move the
cursor immediately to the new target as rapidly and accurately as possible. The subject
performed the step-tracking wrist movement for the target of 8 directions (UP, UR, RT, DR,
DN, DL, LF, UL). For this task, eight patients clinically diagnosed as cerebellar disorders
and eight normal controls participated as subjects. Each subject performed this task 3 times.
2. Pursuit wrist movement
When a circular target, whose diameter was 1 cm, was displayed at the upper left of the
monitor (X=-10°, Y=8°), the subject was required to move and hold the cursor into the
target. After 3 seconds, the target moves by making the path of the figure 2 at the constant
speed (mean velocity = 4.97deg/sec). At that time, the subjects had to enter the cursor into
the moving target continuously. For this task, eight patients clinically diagnosed as
cerebellar disorders, four patients clinically diagnosed as Parkinson’s disease and eight
normal controls participated as the subjects. Each subject performed this task 5 times.
During the task, four channels of EMG signals and two degree of freedom wrist movements
were sampled and recorded at 2 kHz.
2.3 Recording muscle activities
We recorded surface EMG signals from four wrist prime movers: extensor carpi radialis
(ECR), extensor carpi ulnaris (ECU), flexor carpi ulnaris (FCU) and flexor carpi radialis
(FCR). The EMG signals were recorded with Ag-AgCl electrodes, amplified and sampled at
2 kHz. Typical locations of the surface electrodes for these four muscles are shown in Figure
3A. The position of each electrode was adjusted for each subject to maximize EMG signals of
each muscle for a specific movement. In a few healthy control volunteers, we confirmed
A New Method for Quantitative Evaluation of Neurological Disorders based on EMG signals 41
2. Materials and Methods
2.1 Experimental apparatus
In order to make a quantitative evaluation of neurological disorders, we developed a system
for quantitative evaluation of motor command using wrist movements (Lee et al, 2007).
Specifically, we intended to analyze the causal relationship between movement disorders
and abnormal muscle activities. In addition, the system was also designed to be non-
invasive and used handily at the bedside.
An outline of the system is shown in Figure 1. It consists of four components, a wrist joint
manipulandum, a notebook computer, a small Universal Serial Bus (USB) analog-to-digital
(A/D) converter interface and a multi-channel amplifier for surface electromyogram (EMG)
signal. Movement of the wrist joint is measured with 2 position sensors of the
manipulandum at 2 kHz sampling rate, and the wrist position is linked to the position of the
cursor on the computer display. In other words, the manipulandum worked as a mouse for
the wrist joint. Consequently, we can analyze the relationship between movement disorders
and muscle activities, while subjects perform various wrist movement tasks using the
manipulandum.
Fig. 1. Outline of the quantitative evaluation system for motor function using wrist
movement
2.2 Experimental task
Subjects sat on a chair and grasped the manipulandum with his/her right hand. The
forearm was comfortably supported by an armrest. As the experimental task, we asked
subjects to perform step-tracking wrist movements (Figure 2A) and pursuit wrist
movements (Figure 2B).
Fig. 2. Experimental tasks : step-tracking wrist movement (A) and pursuit wrist movement
(B). To make these wrist movement tasks, the subject holds the forearm in the neutral
position, midway between full pronation and full supination.
1. Step-tracking wrist movement
When a circular target, whose diameter was 1 cm, was displayed at the center of the monitor,
the subject was required to move the cursor into the target. When a new target was shown at
a place equivalent to 18 degrees of the wrist joint movement, the subjects had to move the
cursor immediately to the new target as rapidly and accurately as possible. The subject
performed the step-tracking wrist movement for the target of 8 directions (UP, UR, RT, DR,
DN, DL, LF, UL). For this task, eight patients clinically diagnosed as cerebellar disorders
and eight normal controls participated as subjects. Each subject performed this task 3 times.
2. Pursuit wrist movement
When a circular target, whose diameter was 1 cm, was displayed at the upper left of the
monitor (X=-10°, Y=8°), the subject was required to move and hold the cursor into the
target. After 3 seconds, the target moves by making the path of the figure 2 at the constant
speed (mean velocity = 4.97deg/sec). At that time, the subjects had to enter the cursor into
the moving target continuously. For this task, eight patients clinically diagnosed as
cerebellar disorders, four patients clinically diagnosed as Parkinson’s disease and eight
normal controls participated as the subjects. Each subject performed this task 5 times.
During the task, four channels of EMG signals and two degree of freedom wrist movements
were sampled and recorded at 2 kHz.
2.3 Recording muscle activities
We recorded surface EMG signals from four wrist prime movers: extensor carpi radialis
(ECR), extensor carpi ulnaris (ECU), flexor carpi ulnaris (FCU) and flexor carpi radialis
(FCR). The EMG signals were recorded with Ag-AgCl electrodes, amplified and sampled at
2 kHz. Typical locations of the surface electrodes for these four muscles are shown in Figure
3A. The position of each electrode was adjusted for each subject to maximize EMG signals of
each muscle for a specific movement. In a few healthy control volunteers, we confirmed
Recent Advances in Biomedical Engineering42
effectiveness of the adjustment with high correlation between the surface EMG signals and
the corresponding EMG signals recorded with needle electrodes from the same muscles
identified with evoked-twitches.
Fig. 3. Muscles related to the wrist joint (A) and pulling direction of each muscle (B). (A) The
four wrist prime movers whose activities were recorded: extensor carpi radialis (ECR),
extensor carpi ulnaris (ECU), flexor carpi ulnaris (FCU) and flexor carpi radialis (FCR). We
did not distinguish extensor carpi radialis longus (ECRL) and extensor carpi radialis brevis
(ECRB), because they have quite similar actions on the wrist and their activities are
indistinguishable with surface electrodes. (B) The arrow indicates the pulling direction of
each muscle. Muscle pulling directions for ECR, ECU, FCU, FCR were 18.4, 159.5, 198.3, and
304.5° clockwise from UP target.
There are two reasons why we chose these four muscles. First, the mechanical actions of
these muscles are evenly distributed to cover the wrist movement for any direction (Figure
3B). Second, it is easy to record their activities with surface electrodes (Figure 3A). This is an
essential clinical benefit to record muscle activities without pain, sparing use of invasive
needle or wire electrodes. It should be also noted that use of no more than four surface
electrodes contributes greatly to minimize time needed to set up recording.
2.4 Normalization of EMG Signals
It is well known that EMG signals are closely correlated with activities of α-motoneurons,
which represent the final motor commands from the CNS. These motor commands generate
muscle contraction, which results in muscle tension. It is established that a second order,
low-pass filter is sufficient for estimating muscle tension from the raw EMG signal
(Mannard & Stein, 1973). However, although the low-pass filtered EMG signal is
proportional to muscle tension, the proportional constant varies due to variability of skin
resistance or relative position of the electrode on a muscle for each recording. Therefore, for
a quantitative analysis, it is necessary to normalize the EMG signals. For this purpose, we
asked each subject to generate isometric wrist joint torque for the PD of each muscle.
Namely, for each muscle, we set the amplitude of the EMG signals for 0.8 Nm of isometric
wrist joint torque as 1. Then, the normalized EMG signals were digitally rectified and then
filtered with a low-pass filter of a second order.
In this study, we used a Butterworth low-pass filter of a second order with cut-off frequency
of 4Hz. Most critically, we considered the filtered EMG signals as muscle tensions, and used
them to estimate the wrist joint torque (Mannard & Stein, 1973; Koike & Kawato, 1995). In
this study, we called the filtered EMG signals as muscle tension shortly.
3. Identification of causal muscle activities for movement disorders
In this section, we will describe the results of identification for the step-tracking movement
of the wrist for various directions. Specifically, we identified causal abnormality of muscle
activities for movement disorders of cerebellar patients, confirming effectiveness of our
method for analysis of movement disorders at the level of the motor command.
3.1 Movement disorders and causal anomaly in the muscle activities
Fig. 4. Wrist joint kinematics and EMG signals for UL target. (A) An example of step-
tracking movement for UL target in a normal control. The inset demonstrates a trajectory of
the wrist joint. The top two traces show X-axis and Y-axis components of the angular
velocity. The bottom four traces show EMG signals of ECR, ECU, FCU, FCR. (B) A
corresponding example recorded from a cerebellar patient.
A New Method for Quantitative Evaluation of Neurological Disorders based on EMG signals 43
effectiveness of the adjustment with high correlation between the surface EMG signals and
the corresponding EMG signals recorded with needle electrodes from the same muscles
identified with evoked-twitches.
Fig. 3. Muscles related to the wrist joint (A) and pulling direction of each muscle (B). (A) The
four wrist prime movers whose activities were recorded: extensor carpi radialis (ECR),
extensor carpi ulnaris (ECU), flexor carpi ulnaris (FCU) and flexor carpi radialis (FCR). We
did not distinguish extensor carpi radialis longus (ECRL) and extensor carpi radialis brevis
(ECRB), because they have quite similar actions on the wrist and their activities are
indistinguishable with surface electrodes. (B) The arrow indicates the pulling direction of
each muscle. Muscle pulling directions for ECR, ECU, FCU, FCR were 18.4, 159.5, 198.3, and
304.5° clockwise from UP target.
There are two reasons why we chose these four muscles. First, the mechanical actions of
these muscles are evenly distributed to cover the wrist movement for any direction (Figure
3B). Second, it is easy to record their activities with surface electrodes (Figure 3A). This is an
essential clinical benefit to record muscle activities without pain, sparing use of invasive
needle or wire electrodes. It should be also noted that use of no more than four surface
electrodes contributes greatly to minimize time needed to set up recording.
2.4 Normalization of EMG Signals
It is well known that EMG signals are closely correlated with activities of α-motoneurons,
which represent the final motor commands from the CNS. These motor commands generate
muscle contraction, which results in muscle tension. It is established that a second order,
low-pass filter is sufficient for estimating muscle tension from the raw EMG signal
(Mannard & Stein, 1973). However, although the low-pass filtered EMG signal is
proportional to muscle tension, the proportional constant varies due to variability of skin
resistance or relative position of the electrode on a muscle for each recording. Therefore, for
a quantitative analysis, it is necessary to normalize the EMG signals. For this purpose, we
asked each subject to generate isometric wrist joint torque for the PD of each muscle.
Namely, for each muscle, we set the amplitude of the EMG signals for 0.8 Nm of isometric
wrist joint torque as 1. Then, the normalized EMG signals were digitally rectified and then
filtered with a low-pass filter of a second order.
In this study, we used a Butterworth low-pass filter of a second order with cut-off frequency
of 4Hz. Most critically, we considered the filtered EMG signals as muscle tensions, and used
them to estimate the wrist joint torque (Mannard & Stein, 1973; Koike & Kawato, 1995). In
this study, we called the filtered EMG signals as muscle tension shortly.
3. Identification of causal muscle activities for movement disorders
In this section, we will describe the results of identification for the step-tracking movement
of the wrist for various directions. Specifically, we identified causal abnormality of muscle
activities for movement disorders of cerebellar patients, confirming effectiveness of our
method for analysis of movement disorders at the level of the motor command.
3.1 Movement disorders and causal anomaly in the muscle activities
Fig. 4. Wrist joint kinematics and EMG signals for UL target. (A) An example of step-
tracking movement for UL target in a normal control. The inset demonstrates a trajectory of
the wrist joint. The top two traces show X-axis and Y-axis components of the angular
velocity. The bottom four traces show EMG signals of ECR, ECU, FCU, FCR. (B) A
corresponding example recorded from a cerebellar patient.
Recent Advances in Biomedical Engineering44
Figure 4 shows a trajectory, velocity profiles and EMG signals for a movement toward UL
target. As shown in Figure 4A, the trajectory of a normal control was almost straight, and
the angular velocity of a wrist joint showed a typical bell-shape profile for both X- and Y-
components. In terms of EMG signals, FCR whose pulling direction (see Figure 3B) was
directed to the UL target was active from the movement onset to the end. In addition, the
activity of FCR lasted while a wrist was maintained in the UL target. ECR and FCU that had
minor contribution for the direction also demonstrated moderate and probably cooperative
activities. In contrast, ECU whose pulling direction was directed opposite to UL target, was
inactive throughout the movement. Overall, the muscle activities and the mechanical actions
of the four muscles can explain the movement quite reasonably in the normal control. The
same was true for the cerebellar patients. Even the complex trajectory can be explained with
the muscle activities as follows. As shown in Figure 4B, the initial downward movement
was lead by inadvertent dominance of activities of FCU. Then simultaneous recruitment of
FCR and ECR lifted the wrist upward. However, as the activities of FCR exceeded that of
ECR, the wrist was pulled leftward. But a sudden burst of ECU and simultaneous shut-
down of FCR and FCU ignited a diddling of the wrist.
3.2 A dynamics model of the wrist joint
In order to determine causal muscle activities for movement disorders quantitatively, we
approximated the relationship between the wrist joint torque calculated from the movement
kinematics and the four EMG signals using a dynamics model of the wrist joint.
The equations of the wrist joint torque calculated from the wrist joint kinematics (angle,
angular velocity, angular acceleration) can be decomposed into the X-axis component and Y-
axis component as follows.
)()()()( tftKtBtM
xxxx
(1)
)()(cos)()()( tftmgctKtBtM
yyyyy
(2)
Where,
)(t
x
and
)(t
y
represent X-axis component and Y-axis component of the wrist joint
angle.
)(t
x
,
)(t
y
,
)(t
x
and
)(t
y
indicate X-axis component and Y-axis component for
angular velocity and angular acceleration of the wrist joint respectively. M is an inertial
parameter and we calculated this parameter for each subject by measuring volume of the
hand. B and K represent viscous coefficient and elastic coefficient. We set these coefficients
as 0.03Nms/rad and 0.2Nm/rad for the step-tracking movement, based on the previous
studies (Gielen & Houk, 1984; Haruno & Wolpert 2005). m and c are the mass and center of
mass for the hand, and we calculated these parameters for each subject by measuring
volume of the hand. g is acceleration of gravity (g=9.8m/s2). f
x
(t) and f
y
(t) denote X-axis
component and Y-axis component of the wrist joint torque calculated from the wrist
movement.
We assumed that the wrist joint torque were proportional to the linear sum of the four EMG
signals. That is, considering the pulling direction of each muscle shown in Figure 3B, the
relationship between the wrist joint torque and the muscle tension of four muscles are
formalized as follows:
)()()()()(
44332211
tgteateateatea
xxxxx
(3)
)()()()()(
44332211
tgteateateatea
yyyyy
(4)
Where, e
1
(t), e
2
(t), e
3
(t), and e
4
(t) represent the muscle tension of ECR, ECU, FCU, and FCR,
respectively. g
x
(t) and g
y
(t) represent X-axis component and Y-axis component of the wrist
joint torque estimated from the four muscle tensions, respectively. a
1x~
a
4x
(≧0) and a
1y~
a
4y
(
≧0) denote the parameters for the musculo-skeletal system of the wrist joint that convert the
muscle tension into the wrist joint torque. It should be noted that the sign of each parameter
works as a constraint to limit the pulling direction of each muscle.
In our previous study, we calculated the parameters a
1x~
a
4x
and a
1y~
a
4y
using the simple
relationship between the wrist joint torque and the muscle tension for isometric contraction
(Lee et al., 2007). However, there was no guarantee that these parameters obtained for an
isometric condition were suitable to estimate dynamic wrist joint torques during movement.
In fact, estimation of the dynamic wrist joint torques with these parameters was relatively
poor for extreme movements, such as jerky movements of the cerebellar patients. Therefore,
it is desirable to introduce alternative parameters obtained for movement conditions. In this
study, we directly calculated these parameters from the relationship between the wrist joint
torque and the muscle tension during movement, by optimizing a match between the wrist
joint torque (equation (1) and (2)) and the linear sum of four muscle tensions (equation (3)
and (4)) using the least squares method.
3.3 Performance of the model
Figure 5 shows an example of the match between the wrist joint torque calculated from the
wrist movement (blue line) and the linear sum of the four muscle tensions (red line) for a
normal control (A) and a cerebellar patient (B). As clearly seen in Figure 5 and Table 1, there
were very high correlations between the wrist joint torque and the four muscle activities for
both the cerebellar patients and the normal controls (R for normal controls = 0.81±0.08 (X-
axis), 0.84±0.05 (Y-axis); R for cerebellar patients = 0.81±0.09 (X-axis), 0.81±0.05 (Y-axis)). The
result strongly suggested that it is possible to identify causal anomaly of the muscle
activities for each abnormal movement. Therefore, it should be possible to analyze central
mechanisms for generation of pathological movements at the level of the motor command
with high accuracy.
A New Method for Quantitative Evaluation of Neurological Disorders based on EMG signals 45
Figure 4 shows a trajectory, velocity profiles and EMG signals for a movement toward UL
target. As shown in Figure 4A, the trajectory of a normal control was almost straight, and
the angular velocity of a wrist joint showed a typical bell-shape profile for both X- and Y-
components. In terms of EMG signals, FCR whose pulling direction (see Figure 3B) was
directed to the UL target was active from the movement onset to the end. In addition, the
activity of FCR lasted while a wrist was maintained in the UL target. ECR and FCU that had
minor contribution for the direction also demonstrated moderate and probably cooperative
activities. In contrast, ECU whose pulling direction was directed opposite to UL target, was
inactive throughout the movement. Overall, the muscle activities and the mechanical actions
of the four muscles can explain the movement quite reasonably in the normal control. The
same was true for the cerebellar patients. Even the complex trajectory can be explained with
the muscle activities as follows. As shown in Figure 4B, the initial downward movement
was lead by inadvertent dominance of activities of FCU. Then simultaneous recruitment of
FCR and ECR lifted the wrist upward. However, as the activities of FCR exceeded that of
ECR, the wrist was pulled leftward. But a sudden burst of ECU and simultaneous shut-
down of FCR and FCU ignited a diddling of the wrist.
3.2 A dynamics model of the wrist joint
In order to determine causal muscle activities for movement disorders quantitatively, we
approximated the relationship between the wrist joint torque calculated from the movement
kinematics and the four EMG signals using a dynamics model of the wrist joint.
The equations of the wrist joint torque calculated from the wrist joint kinematics (angle,
angular velocity, angular acceleration) can be decomposed into the X-axis component and Y-
axis component as follows.
)()()()( tftKtBtM
xxxx
(1)
)()(cos)()()( tftmgctKtBtM
yyyyy
(2)
Where,
)(t
x
and
)(t
y
represent X-axis component and Y-axis component of the wrist joint
angle.
)(t
x
,
)(t
y
,
)(t
x
and
)(t
y
indicate X-axis component and Y-axis component for
angular velocity and angular acceleration of the wrist joint respectively. M is an inertial
parameter and we calculated this parameter for each subject by measuring volume of the
hand. B and K represent viscous coefficient and elastic coefficient. We set these coefficients
as 0.03Nms/rad and 0.2Nm/rad for the step-tracking movement, based on the previous
studies (Gielen & Houk, 1984; Haruno & Wolpert 2005). m and c are the mass and center of
mass for the hand, and we calculated these parameters for each subject by measuring
volume of the hand. g is acceleration of gravity (g=9.8m/s2). f
x
(t) and f
y
(t) denote X-axis
component and Y-axis component of the wrist joint torque calculated from the wrist
movement.
We assumed that the wrist joint torque were proportional to the linear sum of the four EMG
signals. That is, considering the pulling direction of each muscle shown in Figure 3B, the
relationship between the wrist joint torque and the muscle tension of four muscles are
formalized as follows:
)()()()()(
44332211
tgteateateatea
xxxxx
(3)
)()()()()(
44332211
tgteateateatea
yyyyy
(4)
Where, e
1
(t), e
2
(t), e
3
(t), and e
4
(t) represent the muscle tension of ECR, ECU, FCU, and FCR,
respectively. g
x
(t) and g
y
(t) represent X-axis component and Y-axis component of the wrist
joint torque estimated from the four muscle tensions, respectively. a
1x~
a
4x
(≧0) and a
1y~
a
4y
(
≧0) denote the parameters for the musculo-skeletal system of the wrist joint that convert the
muscle tension into the wrist joint torque. It should be noted that the sign of each parameter
works as a constraint to limit the pulling direction of each muscle.
In our previous study, we calculated the parameters a
1x~
a
4x
and a
1y~
a
4y
using the simple
relationship between the wrist joint torque and the muscle tension for isometric contraction
(Lee et al., 2007). However, there was no guarantee that these parameters obtained for an
isometric condition were suitable to estimate dynamic wrist joint torques during movement.
In fact, estimation of the dynamic wrist joint torques with these parameters was relatively
poor for extreme movements, such as jerky movements of the cerebellar patients. Therefore,
it is desirable to introduce alternative parameters obtained for movement conditions. In this
study, we directly calculated these parameters from the relationship between the wrist joint
torque and the muscle tension during movement, by optimizing a match between the wrist
joint torque (equation (1) and (2)) and the linear sum of four muscle tensions (equation (3)
and (4)) using the least squares method.
3.3 Performance of the model
Figure 5 shows an example of the match between the wrist joint torque calculated from the
wrist movement (blue line) and the linear sum of the four muscle tensions (red line) for a
normal control (A) and a cerebellar patient (B). As clearly seen in Figure 5 and Table 1, there
were very high correlations between the wrist joint torque and the four muscle activities for
both the cerebellar patients and the normal controls (R for normal controls = 0.81±0.08 (X-
axis), 0.84±0.05 (Y-axis); R for cerebellar patients = 0.81±0.09 (X-axis), 0.81±0.05 (Y-axis)). The
result strongly suggested that it is possible to identify causal anomaly of the muscle
activities for each abnormal movement. Therefore, it should be possible to analyze central
mechanisms for generation of pathological movements at the level of the motor command
with high accuracy.
Recent Advances in Biomedical Engineering46
Fig. 5. Relationship between the wrist joint torque calculated from the wrist movement (blue
line) and the linear sum of four muscle tensions (red line) for a normal control (A) and a
cerebellar patient (B). Figures of top trace indicate the direction of wrist movement.
Correlation R of normal
control (n=8)
Correlation R of cerebellar
patient (n=8)
Torque X 0.81±0.08 0.81±0.09
Torque Y 0.84±0.05 0.81±0.05
Table 1. Correlation between the wrist joint torque and the muscle activities.
3.4 Analysis of Causal Motor Commands for the Cerebellar Ataxia
In fact, we identified causal abnormality of muscle activities for cerebellar ataxia, confirming
effectiveness of our method to analyze pathological movements at the level of the motor
command.
Figure 6 demonstrates a typical example of one-to-one correlation between the muscle
activities and the concomitant movement for the downward movement in Figure 5B. This
figure summarizes relationship between the muscle activities (i.e.motor commands) and a
jerky wrist movement of a cerebellar patient for every 100msec. For instance, the initial
movement (0msec) was away from the down target (i.e. upward) due to the excess activities
of ECR that pulls the wrist upward. Then the wrist was redirected toward the down target
due to the desirable predominance of the activities of FCU (100-300msec). However,
400msec after the onset, inadvertent activities of FCR pulled the wrist leftward, again, away
from the target. In this way, it is possible with our system to determine the anomalous
motor command for the cerebellar ataxia in further detail.
Fig. 6. Causal relationship between muscle activities and a jerky wrist movement of a
cerebellar patient. Top panels show directions of the wrist movement for every 100msec.
0msec indicates the movement onset. Bottom panels show averaged activities of the four
muscles for the corresponding time window. Muscle activities are represented as vectors.
4. Quantification of pathological patterns of muscle activities
Overall, it is possible to identify abnormal components of agonist selection for wrist
movements by recording activities of as few as four (out of twenty-four) forearm muscles.
We further extended our analysis to quantify the pathological patterns of muscle activities.
In this section, we will describe two parameters that summarize variability and efficacy of
muscle activities for the pursuit movement.
4.1 Parameters characterizing pathological patterns of muscle activities
To make a pursuit wrist movement, it is desirable to change muscle activities smoothly,
because the target moves smoothly. On the other hand, it is also desirable to maximize
contrast between activities of agonist and antagonist muscles to minimize energy
consumption for a movement. As parameters characterizing the variability and the
effectiveness of muscle activities, we defined “Variability of Total Contraction” (VTC) and
“Directionality of Muscle Activity” (DMA) as follows. Indeed, we found these parameters
were very different between control subjects and patients with neurological disorders, and
therefore, were useful to quantify movement disorders.
A New Method for Quantitative Evaluation of Neurological Disorders based on EMG signals 47
Fig. 5. Relationship between the wrist joint torque calculated from the wrist movement (blue
line) and the linear sum of four muscle tensions (red line) for a normal control (A) and a
cerebellar patient (B). Figures of top trace indicate the direction of wrist movement.
Correlation R of normal
control (n=8)
Correlation R of cerebellar
patient (n=8)
Torque X 0.81±0.08 0.81±0.09
Torque Y 0.84±0.05 0.81±0.05
Table 1. Correlation between the wrist joint torque and the muscle activities.
3.4 Analysis of Causal Motor Commands for the Cerebellar Ataxia
In fact, we identified causal abnormality of muscle activities for cerebellar ataxia, confirming
effectiveness of our method to analyze pathological movements at the level of the motor
command.
Figure 6 demonstrates a typical example of one-to-one correlation between the muscle
activities and the concomitant movement for the downward movement in Figure 5B. This
figure summarizes relationship between the muscle activities (i.e.motor commands) and a
jerky wrist movement of a cerebellar patient for every 100msec. For instance, the initial
movement (0msec) was away from the down target (i.e. upward) due to the excess activities
of ECR that pulls the wrist upward. Then the wrist was redirected toward the down target
due to the desirable predominance of the activities of FCU (100-300msec). However,
400msec after the onset, inadvertent activities of FCR pulled the wrist leftward, again, away
from the target. In this way, it is possible with our system to determine the anomalous
motor command for the cerebellar ataxia in further detail.
Fig. 6. Causal relationship between muscle activities and a jerky wrist movement of a
cerebellar patient. Top panels show directions of the wrist movement for every 100msec.
0msec indicates the movement onset. Bottom panels show averaged activities of the four
muscles for the corresponding time window. Muscle activities are represented as vectors.
4. Quantification of pathological patterns of muscle activities
Overall, it is possible to identify abnormal components of agonist selection for wrist
movements by recording activities of as few as four (out of twenty-four) forearm muscles.
We further extended our analysis to quantify the pathological patterns of muscle activities.
In this section, we will describe two parameters that summarize variability and efficacy of
muscle activities for the pursuit movement.
4.1 Parameters characterizing pathological patterns of muscle activities
To make a pursuit wrist movement, it is desirable to change muscle activities smoothly,
because the target moves smoothly. On the other hand, it is also desirable to maximize
contrast between activities of agonist and antagonist muscles to minimize energy
consumption for a movement. As parameters characterizing the variability and the
effectiveness of muscle activities, we defined “Variability of Total Contraction” (VTC) and
“Directionality of Muscle Activity” (DMA) as follows. Indeed, we found these parameters
were very different between control subjects and patients with neurological disorders, and
therefore, were useful to quantify movement disorders.
Recent Advances in Biomedical Engineering48
4.1.1 Variability of Total Contraction (VTC)
VTC represents temporal variability of muscle activitites, as illustrated in Figure 6A. We
first calculated amplitude of torque for each muscle using equation (5).
)()()(||
22
teaaT
Muscle
Muscle
y
Muscle
xMuscle
(5)
Where,
Muscle
x
a
(≧ 0) and
Muscle
y
a
(≧ 0) denote the parameters for the musculo-skeletal
system of the wrist joint, which convert muscle tension into the X-axis component and the
Y-axis component of the wrist joint torque respectively. e
Muscle
(t) represents the muscle
tension of each muscle.
t
dt
dt
Td
VTC
Muscle
Muscle
4
1
|)(|
(6)
Then, as described in equation (6), we calculated the instantaneous variability of the torque
for the four muscles. Finally, the VTC was calculated by averaging the absolute value of the
variation with movement duration t to normalize it for movement duration.
4.1.2 Directionality of Muscle Activity (DMA)
DMA was evaluted as the ratio of wrist joint torque to the total muscle torque as shown in
Figure 6B and equation (8). We first calculated the wrist joint torque from four muscle
activities as follows:
22
))(())(( tgtg
yxEMG
(7)
Where, g
x
(t) and g
y
(t) represent X-axis component and Y-axis component of the wrist joint
torque estimated from the four muscle tensions (see equations (3) and (4)).
t
dt
T
DMA
Muscle
Muscle
EMG
4
1
||
(8)
Then, as described in equation (8), we calculated the ratio of the wrist joint torque to the
sum of the torque of the individual muscles, and finally, the DMA was calculated by
averaging the ratio for movement duration t as a nomalization.
Fig. 6. Explanation of Variability of Total Contraction (VTC) (A) and Directionality of
Muscle Activity (DMA) (B).
4.2 VTC and DMA in neurological disorders
In order to evaluate usefulness of VTC and DMA, we calculated these parametes for patients
with cerebellar atrophy and patients with Parkinson’s disease, as well as for normal control
subjects. Figure 7 summarizes the results. The VTC indicates variability of muscle activities.
Therefore, if there are a number of abrupt changes in the muscle activities, the VTC gets
higher. For instance, in case of cerebellar patients, muscle activities keep fluctuating
intensely due to the cerebellar ataxia. As a result, VTCs for the cerebellar patients tend to be
higher than control subjects with much smoother muscle activities, as shown in Figure 7A.
In contrast, VTCs for patients with Parkinson’s disease tend to be smaller due to faint
modulation of muscle activities (Figure 7A).
Fig. 7. VTC and DMA for neurological disorders and normal controls. (A) Variability of
Total Contraction (VTC), (B) Directionality of Muscle Activity (DMA). SRT indicates the rate
(%) of the cursor within the target for the pursuit movement.
A New Method for Quantitative Evaluation of Neurological Disorders based on EMG signals 49
4.1.1 Variability of Total Contraction (VTC)
VTC represents temporal variability of muscle activitites, as illustrated in Figure 6A. We
first calculated amplitude of torque for each muscle using equation (5).
)()()(||
22
teaaT
Muscle
Muscle
y
Muscle
xMuscle
(5)
Where,
Muscle
x
a
(≧ 0) and
Muscle
y
a
(≧ 0) denote the parameters for the musculo-skeletal
system of the wrist joint, which convert muscle tension into the X-axis component and the
Y-axis component of the wrist joint torque respectively. e
Muscle
(t) represents the muscle
tension of each muscle.
t
dt
dt
Td
VTC
Muscle
Muscle
4
1
|)(|
(6)
Then, as described in equation (6), we calculated the instantaneous variability of the torque
for the four muscles. Finally, the VTC was calculated by averaging the absolute value of the
variation with movement duration t to normalize it for movement duration.
4.1.2 Directionality of Muscle Activity (DMA)
DMA was evaluted as the ratio of wrist joint torque to the total muscle torque as shown in
Figure 6B and equation (8). We first calculated the wrist joint torque from four muscle
activities as follows:
22
))(())(( tgtg
yxEMG
(7)
Where, g
x
(t) and g
y
(t) represent X-axis component and Y-axis component of the wrist joint
torque estimated from the four muscle tensions (see equations (3) and (4)).
t
dt
T
DMA
Muscle
Muscle
EMG
4
1
||
(8)
Then, as described in equation (8), we calculated the ratio of the wrist joint torque to the
sum of the torque of the individual muscles, and finally, the DMA was calculated by
averaging the ratio for movement duration t as a nomalization.
Fig. 6. Explanation of Variability of Total Contraction (VTC) (A) and Directionality of
Muscle Activity (DMA) (B).
4.2 VTC and DMA in neurological disorders
In order to evaluate usefulness of VTC and DMA, we calculated these parametes for patients
with cerebellar atrophy and patients with Parkinson’s disease, as well as for normal control
subjects. Figure 7 summarizes the results. The VTC indicates variability of muscle activities.
Therefore, if there are a number of abrupt changes in the muscle activities, the VTC gets
higher. For instance, in case of cerebellar patients, muscle activities keep fluctuating
intensely due to the cerebellar ataxia. As a result, VTCs for the cerebellar patients tend to be
higher than control subjects with much smoother muscle activities, as shown in Figure 7A.
In contrast, VTCs for patients with Parkinson’s disease tend to be smaller due to faint
modulation of muscle activities (Figure 7A).
Fig. 7. VTC and DMA for neurological disorders and normal controls. (A) Variability of
Total Contraction (VTC), (B) Directionality of Muscle Activity (DMA). SRT indicates the rate
(%) of the cursor within the target for the pursuit movement.
Recent Advances in Biomedical Engineering50
The DMA represents directionality of muscle activities, and thereby indicating contrast
between activities of agonist and the antagonist muscles. By definition, if agonists are
activated selectively with complete suppression of antagonists, DMA gets highest. In
contrast, DMA is low in case of co-contraction with comparable activities for agonists and
antagonists. As a result, DMAs for cerebellar patients are usually very low due to significant
co-contraction (see Figure 4B for example) as shown in Figure 7B. On the other hand, in case
of patients with Parkinson’s diseases, DMAs are also low due to poor modulation of agonist
activities.
Overall, VTC or DMA captures characteristic patterns of the muscle activities for patients
with cerebellar disorders and patients with Parkinson’s disease. Moreover, it is possible to
make more detailed characterization of pathological muscle activities by combining these
parameters (Figure 8). If we use more useful parameters in combination with VTC and
DMA, it will be possible to make more sophisticated evaluation of movement disorders in a
high dimensional space of parameters that quantify patterns of muscle activities.
Consequently, it could be possible to evaluate effects of newly developed treatments for
neurological diseases in the parameter space.
Fig. 8. Comprehensive assessment of muscle activities (i.e. motor commands) for
neurological disorders and normal control. Green spheres, blue spheres and red spheres
indicate normal controls, cerebellar patients and Parkinson’s patients, respectively.
5. Discussion and conclusion
In this chapter, we proposed a new method to make a quantitative evaluation for movement
disorders based on the EMG signals. In the following discussion, we will focus on three
points: 1) Why it is essential to analyze muscle activities for evaluation of neurological
disorders; 2) How effective our proposed method is. 3) Application of our proposed method.
Some researchers tried to make quantitative evaluation of the motor function for the arm
movement (Nakanishi et al., 1992; Nakanishi et al., 2000; Sanguineti et al., 2003). For
example, by analyzing the position, velocity and acceleration of arm during a circular
movement on the digitizer, Nakanishi et al. evaluated the motor function of the arm in
patients with neurological disorders including cerebellar deficits and Parkinson’s disease.
However, their analysis was limited to the movement kinematics. Unfortunately, the
movement kinematics cannot specify its causal muscle activities due to the well-known
redundancy of the musculo-skeletal system. In other words, completely different sets of
muscle activities (causes) end up with the same kinematics (result). Thus, in order to
understand central mechanisms for generation of pathological movements, it is essential to
capture causal anomaly of the motor commands directly, rather than to observe the
resultant movement indirectly (Manto, 1996; Brown et al., 1997). In addition, the movement
kinematics provides no information about muscle tonus that is a crucial factor to diagnose
movement disorders. Overall, it is essential to examine muscle activities to make more
fundamental evaluation of neurological disorders.
In this study, we proposed a new method to identify causal muscle activities for movement
disorders of the wrist joint. However, there are twenty-four muscles in the forearm that
have significant effects on the wrist joint. If we had to record activities of all these muscles to
reconstruct the movement kinematics, we would have to use a number of (i.e. twenty-four
pairs of needle electrodes and it would take painful hours for just placing the electrodes. In
this chapter, we proposed a new method to determine abnormal components of agonist
selection for various wrist movements by recording activities of as few as four forearm
muscles without pain. Consequently, with our proposed method, it is easy to analyze
central mechanisms for generation of pathological movement. In fact, we confirmed the
effectiveness of our proposed method, identifying the causal abnormality of muscle
activities for the cerebellar ataxia with high accuracy.
So far, our method is limited to examine the wrist movement, rather than the whole arm.
Nevertheless, the wrist joint is suitable to examine important motor functions of the arm.
Basically, not only six wrist muscles but also eighteen finger muscles are relevant to control
the two degrees of freedom of the wrist joint (Brand, 1985). This anatomical setup allows the
wrist joint a uniquely wide variety of motor repertoires. For instance, the wrist joint plays an
essential role in hand writing which requires the finest precision of all the motor repertoires.
It should be emphasized that its role is not just a support for finger movements. On the
other hand, the wrist is also capable to generate and/or transmit considerable torque as seen
in the arm wrestling. Overall, our method is capable to examine wide range of natural or
disordered movements by the wrist joint. However, in future, it is desirable to expand our
method to analyze movements of any body part including the whole arm or gait.
Our proposed method is not limited to analysis of motor deficits. We will further apply this
method to evaluation of rehabilitation or guidance of treatment for neurological diseases. As
a first step, we examined parameters characterizing pathological patterns of muscle
activities and demonstrated their usefulness to evaluate pathological muscle activities.
These parameters, if combined appropriately, are useful to characterize complex patterns of
muscle activities in a way easy to recognize visually. The high-dimensional parameter space
A New Method for Quantitative Evaluation of Neurological Disorders based on EMG signals 51
The DMA represents directionality of muscle activities, and thereby indicating contrast
between activities of agonist and the antagonist muscles. By definition, if agonists are
activated selectively with complete suppression of antagonists, DMA gets highest. In
contrast, DMA is low in case of co-contraction with comparable activities for agonists and
antagonists. As a result, DMAs for cerebellar patients are usually very low due to significant
co-contraction (see Figure 4B for example) as shown in Figure 7B. On the other hand, in case
of patients with Parkinson’s diseases, DMAs are also low due to poor modulation of agonist
activities.
Overall, VTC or DMA captures characteristic patterns of the muscle activities for patients
with cerebellar disorders and patients with Parkinson’s disease. Moreover, it is possible to
make more detailed characterization of pathological muscle activities by combining these
parameters (Figure 8). If we use more useful parameters in combination with VTC and
DMA, it will be possible to make more sophisticated evaluation of movement disorders in a
high dimensional space of parameters that quantify patterns of muscle activities.
Consequently, it could be possible to evaluate effects of newly developed treatments for
neurological diseases in the parameter space.
Fig. 8. Comprehensive assessment of muscle activities (i.e. motor commands) for
neurological disorders and normal control. Green spheres, blue spheres and red spheres
indicate normal controls, cerebellar patients and Parkinson’s patients, respectively.
5. Discussion and conclusion
In this chapter, we proposed a new method to make a quantitative evaluation for movement
disorders based on the EMG signals. In the following discussion, we will focus on three
points: 1) Why it is essential to analyze muscle activities for evaluation of neurological
disorders; 2) How effective our proposed method is. 3) Application of our proposed method.
Some researchers tried to make quantitative evaluation of the motor function for the arm
movement (Nakanishi et al., 1992; Nakanishi et al., 2000; Sanguineti et al., 2003). For
example, by analyzing the position, velocity and acceleration of arm during a circular
movement on the digitizer, Nakanishi et al. evaluated the motor function of the arm in
patients with neurological disorders including cerebellar deficits and Parkinson’s disease.
However, their analysis was limited to the movement kinematics. Unfortunately, the
movement kinematics cannot specify its causal muscle activities due to the well-known
redundancy of the musculo-skeletal system. In other words, completely different sets of
muscle activities (causes) end up with the same kinematics (result). Thus, in order to
understand central mechanisms for generation of pathological movements, it is essential to
capture causal anomaly of the motor commands directly, rather than to observe the
resultant movement indirectly (Manto, 1996; Brown et al., 1997). In addition, the movement
kinematics provides no information about muscle tonus that is a crucial factor to diagnose
movement disorders. Overall, it is essential to examine muscle activities to make more
fundamental evaluation of neurological disorders.
In this study, we proposed a new method to identify causal muscle activities for movement
disorders of the wrist joint. However, there are twenty-four muscles in the forearm that
have significant effects on the wrist joint. If we had to record activities of all these muscles to
reconstruct the movement kinematics, we would have to use a number of (i.e. twenty-four
pairs of needle electrodes and it would take painful hours for just placing the electrodes. In
this chapter, we proposed a new method to determine abnormal components of agonist
selection for various wrist movements by recording activities of as few as four forearm
muscles without pain. Consequently, with our proposed method, it is easy to analyze
central mechanisms for generation of pathological movement. In fact, we confirmed the
effectiveness of our proposed method, identifying the causal abnormality of muscle
activities for the cerebellar ataxia with high accuracy.
So far, our method is limited to examine the wrist movement, rather than the whole arm.
Nevertheless, the wrist joint is suitable to examine important motor functions of the arm.
Basically, not only six wrist muscles but also eighteen finger muscles are relevant to control
the two degrees of freedom of the wrist joint (Brand, 1985). This anatomical setup allows the
wrist joint a uniquely wide variety of motor repertoires. For instance, the wrist joint plays an
essential role in hand writing which requires the finest precision of all the motor repertoires.
It should be emphasized that its role is not just a support for finger movements. On the
other hand, the wrist is also capable to generate and/or transmit considerable torque as seen
in the arm wrestling. Overall, our method is capable to examine wide range of natural or
disordered movements by the wrist joint. However, in future, it is desirable to expand our
method to analyze movements of any body part including the whole arm or gait.
Our proposed method is not limited to analysis of motor deficits. We will further apply this
method to evaluation of rehabilitation or guidance of treatment for neurological diseases. As
a first step, we examined parameters characterizing pathological patterns of muscle
activities and demonstrated their usefulness to evaluate pathological muscle activities.
These parameters, if combined appropriately, are useful to characterize complex patterns of
muscle activities in a way easy to recognize visually. The high-dimensional parameter space
Recent Advances in Biomedical Engineering52
is also useful to evaluate effects of a medical treatment as a shift toward or away from the
normal control in the parameter space. In other words, this system is potentially a
navigation system for medical treatments based on the motor commands.
We are now preparing to use this system for evaluation and navigation of rehabilitation. We
expect that an earliest sign of favorable or infavorable effects of rehabilitation emerges as
subtle changes in muscle activities long before visible changes in movement kinematics. Our
method may be also useful for evaluation of treatments currently available like the deep
brain stimulation therapy or available in a near future, such as gene therapies whose targets
are in the central nervous system and whose effects appear as, probably, slow
renormalization of the motor commands.
6. Acknowledgement
We thank Dr. Yasuharu Koike for his invaluable advices on the approximation of the wrist
joint model. We also thank Drs. Yoshiaki Tsunoda and Seaka Tomatsu for helpful
discussions.
7. References
Brand, P.W. (1985). Clinical mechanics of the hand, Mosby, St. Louis
Brown, P.; Corcos, D.M. & Rothwell, J.C. (1997). Does parkinsonian action tremor contribute
to muscle weakness in Parkinson’s disease?, Brain, pp. 401-408
Gielen, G.L. & Houk, J.C. (1984). Nonlinear viscosity of human wrist, Journal of
Neurophysiology, pp. 553-569
Haruno, M. & Wolpert, D.M. (2005). Optimal control of redundant muscles in step-tracking
wrist movements, J. Neurophysiol., pp.4244-4255
Koike, Y. & Kawato, M. (1995). Estimation of dynamic joint torques and trajectory formation
from surface electromyography signals using a neural network model, Biological
Cybernetics, pp. 291-300
Lee, J.; Kagamihara, Y. & Kakei, S. (2007). Development of a quantitative evaluation system
for motor control using wrist movements—an analysis of movement disorders in
patients with cerebellar diseases, Rinsho Byori, pp. 912-921
Mannard, A. & Stein, R. (1973). Determination of the frequency response of isometric soleus
muscle in the cat using random nerve stimulation, Journal of Physiology, pp. 275-296
Manto, M. (1996). Pathoplysiology of Cerebellar dysmetria: The imbalance between the
agonist and the antagonist electromyographic activities, European Neurology, pp.
333-337
Nakanishi, R.; Yamanaga, H.; Okumura, C.; Murayama, N. & Ideta, T. (1992). A quantitative
analysis of ataxia in the upper limbs, Clinical neurology, pp. 251-258
Nakanishi, R.; Murayama, N.; Uwatoko, F.; Igasaki, T. & Yamanaga, H. (2000). Quantitative
analysis of voluntary movements in the upper limbs of patients with Parkinson’s
disease, Clinical Neurophysiology, Vol. 18, pp. 37-45
Sanguineti, V.; Morassoa, P.G.; Barattob, L.; Brichettoc, G.; Mancardic, G.L. & Solaro, C.
(2003). Cerebellar ataxia: Quantitative assessment and cybernetic interpretation,
Human Movement Science, pp. 189-205
Source Separation and Identication issues in bio signals:
A solution using Blind source separation 53
Source Separation and Identication issues in bio signals: A solution
using Blind source separation
Ganesh R Naik and Dinesh K Kumar
X
Source Separation and Identification issues in
bio signals: A solution using
Blind source separation
Ganesh R Naik and Dinesh K Kumar
School of Electrical and Computer Engineering, RMIT University
Melbourne, Australia
1. Introduction
The problem of source separation is an inductive inference problem. There is not enough
information to deduce the solution, so one must use any available information to infer the
most probable solution. The aim is to process these observations in such a way that the
original source signals are extracted by the adaptive system. The problem of separating and
estimating the original source waveforms from the sensor array, without knowing the
transmission channel characteristics and the source can be briefly expressed as problems
related to blind source separation (BSS). Independent component analysis (ICA) is one of the
widely used BSS techniques for revealing hidden factors that underlie sets of random
variables, measurements, or signals. ICA is essentially a method for extracting individual
signals from mixtures of signals. Its power resides in the physical assumptions that the
different physical processes generate unrelated signals. The simple and generic nature of
this assumption ensures that ICA is being successfully applied in diverse range of research
fields.
Source separation and identification can be used in a variety of signal processing
applications, ranging from speech processing to medical image analysis. The separation of a
superposition of multiple signals is accomplished by taking into account the structure of the
mixing process and by making assumptions about the sources. When the information about
the mixing process and sources is limited, the problem is called “blind”. ICA is a technique
suitable for blind source separation - to separate signals from different sources from the
mixture. ICA is a method for finding underlying factors or components from
multidimensional (multivariate) statistical data or signals (Hyvarinen et al., 2001; Hyvarinen
and Oja, 2000).
ICA builds a generative model for the measured multivariate data, in which the data are
assumed to be linear or nonlinear mixtures of some unknown hidden variables (sources);
the mixing system is also unknown. In order to overcome the under determination of the
algorithm, it is assumed that the hidden sources have the properties of non-Gaussianity and
statistical independence. These sources are named Independent Components (ICs). ICA
4