Báo cáo hóa học: "Research Article A Method for Visualizing Independent Spatio-Temporal Patterns of Brain Activity" potx
Bạn đang xem bản rút gọn của tài liệu. Xem và tải ngay bản đầy đủ của tài liệu tại đây (665.38 KB, 6 trang )
Hindawi Publishing Corporation
EURASIP Journal on Advances in Signal Processing
Volume 2009, Article ID 948961, 6 pages
doi:10.1155/2009/948961
Research Article
A Method for Visualizing Independent
Spatio-Temporal Patterns of Brain Activity
Dean J. Krusienski
School of Engineering, University of North Florida, 1 UNF Drive, Jacksonville, FL 32224, USA
Correspondence should be addressed to Dean J. Krusienski,
Received 2 January 2009; Accepted 31 May 2009
Recommended by Don Johnson
Evoked and coordinated brain signals often exhibit distinct, individualized spatial and temporal characteristics, such as amplitude
and phase couplings across and within spatial channels. In the study of these brain potentials, it is important to characterize both
the spatial and temporal morphologies of the responses for a better understanding of both the physiology and function of the
brain. This paper presents a method for visualizing the characteristic spatio-temporal brain activity associated with two distinct
conditions. This method, called Independent Spatio-Temporal Patterns (ISTPs), extends Common Spatial Patterns (CSPs) for
spatio-temporal pattern visualization by adding temporal features. Independent component analysis (ICA) is then applied to
extract independent spatio-temporal patterns corresponding to each condition. The results indicate that the inclusion of temporal
features can provide useful insight regarding the spatio-temporal characteristics of sensorimotor rhythms.
Copyright © 2009 Dean J. Krusienski. This is an open access article distributed under the Creative Commons Attribution License,
which permits unrestricted use, distribution, and reproduction in any medium, provided the original work is properly cited.
1. Introduction
Evoked and coordinated brain signals often exhibit distinct,
individualized spatial and temporal characteristics, such as
amplitude and phase couplings across and within spatial
channels [2]. In the study of these brain potentials, it is
important to characterize both the spatial and temporal mor-
phologies of the responses for a better understanding of both
the physiology and function of the brain. This knowledge
is valuable for characterizing new responses, mapping brain
activity, detecting irregularities, and controlling a brain-
computer interface (BCI).
Simple ensemble averaging is usually sufficient to char-
acterize stimulus evoked potentials because the phase of the
response is typically time-locked to the stimulus [2]. How-
ever, the averaging of event related (de)synchronizations,
such as sensorimotor rhythms (SMRs), is more difficult
because the phase of the responses is not time locked to a
stimulus. Although the general spatial and spectral character-
istics of SMRs are well characterized, there can be differences
ranging from subtle to significant in the spatio-temporal
SMR patterns across individuals [4]. Obtaining a character-
istic temporal waveform from (de)synchronizations on a sin-
gle channel can be straightforwardly accomplished via aver-
aging using correlations of known responses [4]. However,
this method is not precise for examining multiple channels
simultaneously. The proposed method, Independent Spatio-
Temporal Patterns (ISTPs), extends common spatial patterns
(CSPs), combined with independent component analysis
(ICA) in order to accurately extract such characteristic
spatio-temporal patterns.
The method of common spatial patterns (CSPs) [5, 6]
determines an optimal set of spatial filters for discriminating
between two classes. It has been extended to multiclass
paradigms [7] and proved successful for visualizing and
classifying different mental states for brain-computer inter-
faces (BCIs) [3, 8–11]. However, CSP does not consider
the short-time temporal characteristics of the data, such
as the phase relationships between channels and frequency
bands. The methods of common Spatio-spectral patterns
(CSSPs) [1] and common sparse spectral spatial patterns
(CSSSPs) [21] extend the spatial filtering approach to include
time delay embedding in order to create a more flexible
spatial-spectral filter. The components obtained by these
time-embedded methods are not necessarily independent,
and, because the filtering matrices are temporally sparse,
it is not as straightforward to extract the representative
spatio-temporal patterns for visualization. The method of
Independent Spatio-Temporal Patterns (ISTPs) presented
2 EURASIP Journal on Advances in Signal Processing
here also utilizes time delay embedding, with the application
of independent component analysis (ICA) to the resulting
patterns. In this case, uniform temporal sampling is used
to construct the filtering matrix, enabling a complete
visualization of the discriminable spatio-temporal patterns
for the two classes. The addition of ICA produces a set of
independent spatio-temporal patterns that are informative in
terms of substantiating the morphology of the EEG during
different mental states.
2. The Method of Common Spatial Patterns
The CSP decomposition of a feature matrix is given as,
Y
= WX,(1)
where X is an N feature
× T observance matrix, W is an L
× Nmatrix(L≤N) whose L rows represent the individual
components of the decomposition, and Y is an L
× Tmatrix
subspace of X. For a two-class classification problem, W
can be determined to decompose the feature matrix such
that the resulting projections corresponding to the extreme
eigenvalues of the transformed covariance matrices have
maximal variance for one class and minimal variance for the
other class. First, for the two classes (1 and 2), the class-
labeled observations are sorted by the respective class and the
class-specific covariance matrices are determined:
Σ
1
= X
(1)
X
T
(1)
, Σ
2
= X
(2)
X
T
(2)
. (2)
The task is defined as finding the transformation W to create
projections that simultaneously maximize the variance for
one class and minimize the variance for the other:
WΣ
1
W
T
= D, WΣ
2
W
T
= I − D,(3)
where D is a diagonal matrix with elements in [0, 1]. This
can be accomplished through simultaneous diagonalization
of the two covariance matrices. First, a whitening transfor-
mation is performed:
P
(
Σ
1
+ Σ
2
)
P
T
= I. (4)
Using spectral theory, the eigenvalue decomposition is then
performed for the transformed classes:
PΣ
1
P
T
= RDR
T
, PΣ
2
P
T
= R
(
I − D
)
R
T
,(5)
where the columns of R are the eigenvectors, and the diagonal
elements of D and (D
− I) are the eigenvalues of classes 1
and 2, respectively. Note that the maximum eigenvalues for
one class correspond to the minimum eigenvalues for the
other class. By selecting only the eigenvectors corresponding
to the largest and smallest eigenvalues that provide the
best discrimination between classes, the subspace projection
matrix is defined as.
W =
R
T
P
. (6)
For standard CSP analysis of EEG, the features of X
are simply the instantaneous bandpass-filtered voltages at
each electrode. For ISTP, the features are the concatenation
of time-windowed voltages for each electrode. The actual
EEG patterns corresponding to the two mental states can be
visualized by inverting the filtering matrix W.
3. Methodology
In one- and two-dimensional BCI cursor control studies [13–
16],trainedusersareabletoeffectively modulate 8–12 Hz
(α band) and 18–26 Hz (β band) spectral components over
the sensorimotor cortex to move a cursor toward a randomly
positioned target on a monitor. Four sessions of data from
ten able-bodied users (six women and four men ranging in
age from 29 to 45) who performed a one-dimensional two-
target cursor control task were used for offline evaluation
of the ISTPs. All users had exhibited strong μ-band activity
during an initial screening and were subsequently trained
on a simple two-target, one-dimensional cursor control task.
All users were successfully trained on the task (consistently
>80% accuracy) and ranged in experience from 1 to 20
sessions on the task prior to this data set. The study was
approved by the New York State Department of Health Insti-
tutional Review Board, and each user gave informed consent.
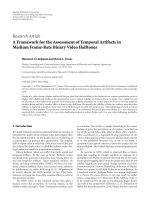
3.1. One-Dimensional Sensorimotor Rhythm Cursor Control
Task. The one-dimensional sensorimotor rhythm cursor
control task is shown in Figure 1. For the task, the users
were presented by a target randomly positioned at the top
or bottom right edge of the monitor. The trial began with
the cursor at the left center of the monitor. It moved at a
constant rate toward the right, reaching the right side of
the monitor after 2 seconds. The users’ goal was to move
the cursor upward or downward to the height of the target
so that it hits the target when it reached the right side of
the monitor. The trials continued in 3-minute runs, with
a 1-minute break given between runs. Between 18 and 30
trials were completed in a single 3-minute run, and 8 runs
constitute a single session. Sessions were conducted one per
day over a period of several weeks.
3.2. Data Collection and Feature Extraction. The details of the
data collection and analysis are as follows. Using BCI2000
software [17], the EEG activity was collected from 64
channels at standard locations [18] distributed over the scalp.
All 64 channels were referenced to the right ear, bandpass
filtered (0.1–60 Hz), and digitized at 160 Hz. For each
user, a large Laplacian spatial filter [12] (see Figure 2)was
applied to the electrode over the right-or-left hand area of
the sensorimotor cortex that exhibited maximal correlation
between μ-band activity and the task based on prior sessions.
A 3-Hz bin at the user-specific μ-band frequency from
a 16th-order AR model was extracted from the spatial-
filtered signal and used as the online control feature. The
AR feature was calculated every 50 milliseconds from the past
400 milliseconds of data. The AR model order, bin width, and
time windowing were selected based on extensive empirical
evaluations. The specific locations and frequencies used for
the online experiments are provided in Ta ble 1.
4. Offline Analysis
The data set used for offline analysis, collected as described
in Section 3.2, consisted of 4 sessions of 8 runs each from
EURASIP Journal on Advances in Signal Processing 3
12345
Figure 1: One-dimensional task trial structure. (1) The target and cursor are present on the screen for 1 second. (2) The cursor moves
steadily across the screen for 2 seconds with its vertical movement controlled by the user. (3) If the user hits the target, the target flashes for
1.5 seconds. If the cursor misses the target, the screen is blank for 1.5 seconds. (4) The screen goes blank for a 1-second interval. (5) The next
trial begins.
T
P7
T
P8
T
7
T
8
F
3
F
4
FC
3
FC
4
C
3
C
4
C
P3
C
P4
P
3
P
4
PO
3
PO
4
C
Z
C
PZ
Figure 2: The large Laplacian spatial filter configuration. For an
electrode over the hand area of the sensorimotor cortex (indicated
in black), the signals from the four equidistant surrounding
electrodes (indicated in gray) are averaged and subtracted from
this central (black) electrode to produce the control signal. For
the online experiments, a single large Laplacian control signal was
used for cursor control. For the offline analysis, the 9 electrodes
comprising the two contralateral Laplacian filters covering both
hemispheres (depicted as the shaded locations for the C
3
/C
4
users
and as the unshaded locations for the C
P3
/C
P4
users) were used for
processing.
each of the 10 users. The first session was used to derive
the ISTPs, and the three subsequent sessions were used for
validation. As a necessary preprocessing step for CSP-based
methods, the channels were bandpass filtered from 7 to 30 Hz
[1]. The spatio-temporal features were constructed using
the nine raw (i.e., ear-referenced) channels that represent
the union of the channels that comprise large Laplacians
over the left and right sensorimotor cortex. The observations
used to construct the covariance matrices were collected
every 6.25 milliseconds using the past 400 milliseconds of
data, thus matching the segment length used for the online
experiments.
The observations were collected every 6.25 milliseconds
to provide an ample number of observations for constructing
the covariance matrices, although a lower observation rate
Table 1: The predetermined optimal electrode location (Interna-
tional 10–20 System [18]) and fundamental μ-rhythm frequency for
each user.
User Location Frequency(Hz)
A C
3
12
B C
3
12
C C
P3
12
D C
3
12
E C
P3
11
F C
3
12
G C
4
12
H C
P4
13
I C
3
12
J C
3
10
would likely be adequate. The channel set was limited to nine
electrodes in order to provide comparison to the Laplacian
spatial filter as well as a manageable feature space for the ISTP
method.
4.1. Common Spatio-Temporal Patterns. Prior to performing
the ICA, the Common Spatio-Temporal Patterns (CSTPs)
can be visualized by inverting the projection matrix W.
Interestingly, for all users, the components representing the
two most extreme eigenvalues for the target correspond-
ing to SMR synchronization (high SMR-band amplitude)
were nearly identical 90 degree phase-shifted sinusoidal
waveshapes at the μ-band control frequency with maximal
amplitude over the electrode used for control as illustrated in
Figure 3 (notice that the relative amplitudes of the different
channels are not equally proportional to the distance from
the central electrode as approximated by a Laplacian spatial
filter). Based on Fourier theory, a linear combination of
these two components can model a sinusoidal response with
arbitrary phase. This decomposition is logical since the phase
of the EEG is not time-locked to the observation intervals.
Additionally, for the majority of users, two of the remaining
four most prominent components for the synchronized
condition are sinusoids in the β band having similar topogra-
phies and proportionally lower amplitudes to the μ-band
components (see Figure 3). It is worth noting that the precise
frequencies of the SMR activity can be determined from the
periods of the corresponding CSTPs, which are potentially
more accurate than estimates obtained from a standard
spectral decomposition. For the desynchronized condition,
4 EURASIP Journal on Advances in Signal Processing
5 μV
400 ms
(a)
5 μV
400 ms
(b)
Figure 3: Representative waveform topographies of the four most prominent patterns for the synchronized condition (high SMR-band
amplitude). The waveforms are presented with respect to the electrode locations given in Figure 2. In the left topography, the first and
second most prominent patterns are illustrated in red and blue, respectively, and represent the μ frequency band. In the right topography,
the third and fourth most prominent patterns are illustrated in red and blue, respectively, and represent the β frequency band. For this user
(User D), the μ band from channel C
3
was used for online control.
the prominent components primarily ranged from apparent
random noise to visual α-type activity depending on the
user, although other nonvisual rhythmic components were
present in some users. Although the method is capable
of extracting potential phase shifts between channels for
a particular CSTP component, there were no apparent
phase offsets between channels for any of the prominent
components.
4.2. Independent Spatio-Temporal Patterns. Although the
prominent CSTP components are essentially orthogonal
Fourier components at the μ and β frequencies, these
components are not necessarily independent. In order to
gain insight regarding the independent patterns generated
for each target condition, independent component analysis
(ICA) can be performed on the projected features for each
condition. Because the resulting ICA unmixing matrix indi-
cates the relative contribution of each projection, and each
CSTP component corresponds to a particular projection, the
ICA mixing matrix (inverse of the unmixing matrix) can be
applied to the CSTP components to produce a representation
of the independent patterns. These independent patterns
should provide an indication of the preferred response
morphologies (i.e., amplitude and phase relationships) for
the different conditions. The independent common spatio-
temporal patterns (ISTPs) for each target condition i
∈
{
1, 2} are attained as follows:
CSTP
ICA
i
=
W
−1
i
A
i
,(7)
where A is the resultant mixing matrix of the ICA.
Figure 4 shows, for three representative users, the ISTPs
of the synchronized condition that result in the highest
correlation with target position. The mixing matrices were
derived from the 8 most prominent projections (empirically
found to be a suitable number of projections for ICA) for
each target condition using FastICA [19] with a tansigmoidal
nonlinearity. The classical arch-shape patterns depicted in
Figure 4 are consistent for the majority of users, which
supports the notion of preferred phase coupling between the
μ and β bands [4].
To confirm that the ISTPs are in fact useful and
valid results, the two ISTP projections from each class
(four features) having the highest correlations with the
target position were extracted, and regression weights were
determined using the first session from each user. The r
2
correlations of the resulting regressed feature were computed
using the three subsequent sessions for each user. These r
2
values were compared to values produced by the incumbent
online method using two large Laplacian channels, the
online control channel, and the contralateral channel over
the opposite hemisphere (see Figure 2). For each channel,
3-Hz μ and β band spectral bins were extracted using a
16th-order AR model derived via the maximum entropy
method (MEM) [20]. Regression weights were determined
for these four features using the first session from each user,
and the resulting regressed feature was correlated with three
subsequent sessions for each user.
Figure 5 illustrates the r
2
for each method averaged
across users. These results indicate that the specific spatio-
temporal relationships of ISTP provide an improved model
compared to the Laplacian and AR combination, which
applies fixed spatial weights and does not utilize phase
relationships.
5. Discussion
The prominence of the sinusoidal μ and β components
in the CSTPs reaffirms the efficacy of conventional spec-
tral methods for a SMRs-based BCI. ISTP additionally
EURASIP Journal on Advances in Signal Processing 5
5 μV
400 ms
(a)
5 μV
400 ms
(b)
5 μV
400 ms
(c)
Figure 4: Waveform topographies of the independent common
spatio-temporal patterns having the highest correlation for the
synchronized condition for three representative users. The wave-
formsarepresentedwithrespecttotheelectrodelocationsgiven
in Figure 2. The users depicted in the top two topographies (User
A and D, resp.) used channel C
3
for online control, while the user
depicted in the bottom topography (User G) used channel C
4
.
0.2
0.3
0.4
0.5
0.6
0.7
r
2
AR ISTP
Method
Figure 5: An offline evaluation of r
2
for the AR and ISTP methods
averaged over 10 users. The error bars indicate standard deviation.
distinguishes the actual independent spatio-temporal mor-
phologies indicative of the different mental states without
prior knowledge of the SMR characteristics. As with any
application of ICA where exact number of sources is not
known, it is difficult to speculate about the significance of
the resulting ISTPs. Nevertheless, it is interesting that the
ISTPs having the highest correlation with the target position
often exhibit the classical arch-shaped μ-rhythm pattern
[20], suggesting that there is a preferred amplitude/phase
synchronization between the fundamental SMR frequency
and the harmonics.
The resulting ISTP morphologies capture these preferred
amplitude and phase relationships across and within chan-
nels, which can be visualized, characterized, and applied
for classification purposes. The prominent ISTP patterns
could potentially be used as spatio-temporal matched filter
templates, which would minimize the phase effects and
produce better instantaneous tracking estimates than a
fixed classifier for continuous SMR cursor control [4].
However, the feature space required for ISTP would likely be
overkill compared to methods such CSSSP [21] for discrete
classification purposes.
In addition to machine learning techniques, a significant
portion of EEG analysis and interpretation is still based on
visual inspection of the signals for BCI and clinical appli-
cations. The true utility of ISTP is visualizing the complete
spatio-temporal morphologies associated with particular
mental states, which is not possible with CSSSP. Accordingly,
the method of ISTP can potentially be used for visualizing
and characterizing lesser known or more complex user-
specific EEG responses such as steady-state visual evoked
potentials (SSVEPs). By using noncentered covariance matri-
cesassuggestedin[22], the CSTP method can be applied
to transient responses such as P300 event-related potentials
[23]. This modification can also potentially be used to
6 EURASIP Journal on Advances in Signal Processing
concurrently capture class-dependent components due to
slow cortical potentials, movement related potentials, and
SMRs for tasks where all such responses are relevant.
Acknowledgments
This work was initiated and partially completed at the
Wadsworth Center, NYSDOH, Albany, NY and supported
in part by the National Institutes of Health under Grant
NICHD HD30146 and Grant NIBIB/NINDS EB00856 and
in part by the James S. McDonnell Foundation. The author
would also like to thank Dennis J. McFarland and Jonathan
R. Wolpaw for their valuable input to the manuscript.
References
[1] S. Lemm, B. Blankertz, G. Curio, and K R. M
¨
uller, “Spatio-
spectral filters for improving the classification of single trial
EEG,” IEEE Transactions on Biomedical Engineering, vol. 52,
no. 9, pp. 1541–1548, 2005.
[2]E.NiedermeyerandF.L.daSilva,Eds.,Electroencephalogra-
phy: Basic Principles, Clinical Applications and Related Fields,
Williams and Wilkins, Baltimore, Md, USA, 5th edition, 2004.
[3] M. Cheng, W. Jia, X. Gao, S. Gao, and F. Yang, “Mu
rhythm-based cursor control: an offline analysis,” Clinical
Neurophysiology, vol. 115, no. 4, pp. 745–751, 2004.
[4] D.J.Krusienski,G.Schalk,D.J.McFarland,andJ.R.Wolpaw,
“A μ-rhythm matched filter for continuous control of a
brain-computer interface,” IEEE Transactions on Biomedical
Engineering, vol. 54, no. 2, pp. 273–280, 2007.
[5] K. Fukunaga, Introduction to Statistical Pattern Recognition,
Academic Press, San Diego, Calif, USA, 2nd edition, 1990.
[6] Z. J. Koles and A. C. K. Soong, “EEG source localization:
implementing the spatio-temporal decomposition approach,”
Electroencephalography and Clinical Neurophysiolog y, vol. 107,
no. 5, pp. 343–352, 1998.
[7] G. Dornhege, B. Blankertz, G. Curio, and K R. M
¨
uller,
“Boosting bit rates in noninvasive EEG single-trial classifica-
tions by feature combination and multiclass paradigms,” IEEE
Transactions on Biomedical Engineering, vol. 51, no. 6, pp. 993–
1002, 2004.
[8] J. M
¨
uller-Gerking, G. Pfurtscheller, and H. Flyvbjerg, “Design-
ing optimal spatial filters for single-trial EEG classification in a
movement task,” Clinical Neurophysiology, vol. 110, no. 5, pp.
787–798, 1999.
[9] P. Shenoy, M. Krauledat, B. Blankertz, R. P. N. Rao, and K
R. M
¨
uller, “Towards adaptive classification for BCI,” Journal of
Neural Engineering, vol. 3, no. 1, pp. R13–R23, 2006.
[10] G. Townsend, B. Graimann, and G. Pfurtscheller, “A compar-
ison of common spatial patterns with complex band power
features in a four-class BCI experiment,” IEEE Transactions on
Biomedical Engineering, vol. 53, no. 4, pp. 642–651, 2006.
[11] Y. Wang, P. Berg, and M. Scherg, “Common spatial subspace
decomposition applied to analysis of brain responses under
multiple task conditions: a simulation study,” Clinical Neuro-
physiology, vol. 110, no. 4, pp. 604–614, 1999.
[12] D. J. McFarland, L. M. McCane, S. V. David, and J. R. Wolpaw,
“Spatial filter selection for EEG-based communication,” Elec-
troencephalography and Clinical Neurophysiology, vol. 103, no.
3, pp. 386–394, 1997.
[13] D. J. McFarland, W. A. Sarnacki, and J. R. Wolpaw, “Brain-
computer interface (BCI) operation: optimizing information
transfer rates,” Biological Psychology, vol. 63, no. 3, pp. 237–
251, 2003.
[14] D. J. McFarland and J. R. Wolpaw, “EEG-based commu-
nication and control: speed-accuracy relationships,” Applied
Psychophysiology Biofeedback, vol. 28, no. 3, pp. 217–231, 2003.
[15] J. R. Wolpaw and D. J. McFarland, “Multichannel EEG-based
brain-computer communication,” Electroencephalography and
Clinical Neurophysiolog y, vol. 90, no. 6, pp. 444–449, 1994.
[16] J. R. Wolpaw and D. J. McFarland, “Control of a two-
dimensional movement signal by a noninvasive brain-
computer interface in humans,” Proceedings of the National
Academy of Sciences of the United States of America, vol. 101,
no. 51, pp. 17849–17854, 2004.
[17] G. Schalk, D. J. McFarland, T. Hinterberger, N. Birbaumer, and
J. R. Wolpaw, “BCI2000: a general-purpose brain-computer
interface (BCI) system,” IEEE Transactions on Biomedical
Engineering, vol. 51, no. 6, pp. 1034–1043, 2004.
[18] F. Sharbrough, C. E. Chatrian, R. P. Lesser, H. Luders, M.
Nuwer, and T. W. Picton, “American electroencphalographic
society guidelines for standard electrode position nomencla-
ture,” Journal of Clinical Neurophysiology, vol. 8, no. 2, pp. 200–
202, 1991.
[19] A. Hyv
¨
arinen, “Fast and robust fixed-point algorithms for
independent component analysis,” IEEE Transactions on Neu-
ral N etworks, vol. 10, no. 3, pp. 626–634, 1999.
[20] W. N. Kuhlman, “EEG feedback training of epileptic patients:
clinical and electroencephalographic analysis,” Electroen-
cephalography and Clinical Neurophysiology, vol. 45, no. 6, pp.
699–710, 1978.
[21] G. Dornhege, B. Blankertz, M. Krauledat, F. Losch, G. Curio,
and K R. M
¨
uller, “Combined optimization of spatial and
temporal filters for improving brain-computer interfacing,”
IEEE Transactions on Biomedical Engineering, vol. 53, no. 11,
pp. 2274–2281, 2006.
[22] G. Dornhege, B. Blankertz, and G. Curio, “Speeding up classi-
fication of multi-channel brain-computer interfaces: common
spatial patterns for slow cortical potentials,” in Proceedings
of the 1st International IEEE EMBS Conference on Neural
Engineering, pp. 591–594, 2003.
[23] D. J. Krusienski, E. W. Sellers, and T. M. Vaughan, “Common
spatio-temporal patterns for the P300 speller,” in Proceedings
of the 3rd International IEEE EMBS Conference on Neural
Engineering, pp. 421–424, 2007.