Advances in Sonar Technology 2012 Part 6 pptx
Bạn đang xem bản rút gọn của tài liệu. Xem và tải ngay bản đầy đủ của tài liệu tại đây (1.26 MB, 20 trang )
Ensemble Averaging and Resolution Enhancement of Digital Radar and Sonar Signals
87
might expect when comparing the pdfs. For Gaussian noise and σ/Δ sufficiently large, eqs.
(2) and (3) give the following approximate expression for the variance of a signal s
j
with a
given scaling a (not random);
()
2
2
2222
,
2
22 2222
1
Var[ ; , ] exp[ 2 ( / ) ]
12
1 4 ( / ) cos(2 / ) exp[ 2 ( / ) ]sin (2 / ) .
σπσ
π
πσ π π σ π
⎛
ΔΔ
⎛⎞
+− − Δ×
⎜
⎜⎟
⎜
⎝⎠
⎝
⎞
⎡
⎤
+Δ Δ+− Δ Δ
⎟
⎣
⎦
⎠
ij j
jj
esa a
a
asaa sa
(25)
With increasing σ/Δ the variance in (25) goes rapidly to
(
)
222
/12 /
σ
Δ+ a such that the error
variance becomes signal-independent. In Sect. 3.2 we argued that, in the large SNR limit and
without taking into account quantization (i.e. Δ=0), this estimate also holds for the
amplitude variance
2
A
σ
and the phase variance multiplied by the squared signal amplitude
22
0
A
φ
σ
. Thus we expect, at least for small Δ, that eqs. (17) and (18) remain valid with
2
σ
replaced by
22
/12
σ
Δ+. Among other things we examine this validity numerically in Sect.
4.2 below.
Consider random scaling with a uniform scaling pdf;
min
() 1/(1 )pa a
=
− on
min
(,1)a . The
corresponding truncated pdf is
00
(; ) 1/(1 )
p
aa a
=
− on
0
(,1)a . Straightforward calculus
applied to eqs. (15) and (16) establishes that, in the large SNR and σ/Δ limits,
φ
σ
σ
σ
σ
⎛⎞
+Δ −
=
⎜⎟
−
⎝⎠
⎛⎞
+Δ −
=
⎜⎟
−
⎝⎠
22
2
min
2
000
22
2
min
00
/12 1
,
(1 )
/12 1
.
(1 )
A
a
AN a a
a
Naa
(26)
These estimates are subject to numerical investigation below in Sect. 4.2.
4.2 Numerical results
Numerical experiments were performed to demonstrate the validity of the asymptotical
estimates (26) and to examine the effect of quantization on thresholding. We estimated the
variances numerically with a uniform p(a), and compared these to the asymptotic values
obtained analytically. The numerical results estimate the exact variances for all SNR,
whereas the analytical results are valid only asymptotically for large SNR and σ/Δ.
The numerical variance estimates are based on a series of realizations of (24). We conducted
the experiments as follows. Let
,1, ,
k
ak N
=
be a random sequence where the elements are
uniformly distributed on
min
(,1)a , where a
min
= 0.01. For a randomly selected Z
0
(see below),
the complex numbers
0kk k
ZaZn
=
+
AA A
(where
k
n
A
is complex and Gaussian and the real and
imaginary parts are independent) are computed for
1, , , 1, ,kN M
=
=A , where k is the
pulse index, while
A is a realization index. Different realizations are necessary for
estimating the variances numerically. For each
A , we estimated the mean values /AA
and
φ
by summing over k. The variances of these averages were estimated by summing
over
A .
Advances in Sonar Technology
88
For convenience, the sequence in a
k
is sorted according to increasing scaling to easily handle
the thresholding. Each k then corresponds to a scaling threshold a
k
. Only data with scaling
k
aa≥ were retained and used for signal estimation; for each value of k the mean
values
〈 /AA〉
Ak
and
k
φ
A
were computed including a
k
for indices ,1, ,kk N+ .
Subsequently, amplitude and phase variance estimates were obtained by averaging over all
realizations
1, ,
M
=A ;
l
()
l
()
2
2
0
1
2
2
0
1
1
arg( ) ,
1
/mod().
M
k
M
A
k
Z
M
AA Z
M
φ
σφ
σ
=
=
=−
=−
∑
∑
A
A
A
A
(27)
The simulations were performed for three values of the quantization separation
Δ. To avoid
signal-dependent estimates, which is generally the case (see eq. 25), for each
Δ we repeated
the protocol described above 100 times with Z
0
selected at random on the circle in the
complex plane with modulus 4 and thereafter calculated the mean variance estimate.
Comparing the asymptotical expressions in (26) with the numerical results in Fig. 8, we
observe that there is a reasonable agreement between numerical and theoretical estimates,
with two notable exceptions: (i) for small values of a
0
and for large noise the numerical
variances deviate markedly from the theoretical estimates and (ii) for large Δ and small
noise (in particular for the phase variance), the numerical variances are clearly larger than
the theoretical estimate.
Fig. 8. Amplitude and phase variances as function of scaling threshold a
0
for the specified
values of
σ and Δ obtained by performing the computations described in the main text (solid
lines) and corresponding asymptotical estimates (eqs. 26, dashed).
Ensemble Averaging and Resolution Enhancement of Digital Radar and Sonar Signals
89
5. Discussion
As the test case in Sect. 4.2 shows, it was justified to apply the asymptotic estimates in Sect. 3
for both phase and amplitude averaging for sufficient levels of SNR ranging from roughly
10. Although this SNR is reasonable for many practical purposes, the instantaneous signal to
noise ratio varies throughout the radar/sonar pulse with the instantaneous amplitude. Parts
of the rising and falling flanks of the pulses will then correspond to short time intervals in
which the theory should not be applied.
We adopted a smooth scaling distribution p(a) in our analysis. In a practical situation, only
the scaling histogram is available. The normalised histogram approximates p(a;a
0
) and the
optimal scaling threshold can be obtained by the discrete analog to eq. (23). On the other
hand, the optimum scaling threshold can of course be computed by brute force, i.e. by
straightforward estimation of the variance based on available pulse signals and rejecting
those pulses that contribute to a degraded ensemble average. One interesting possible future
investigation is to evaluate the brute force and theoretically driven approaches in practical
situations and compare them in terms of efficiency and reliability.
In Sect. 2.3 we defined and obtained a mathematical expression for the mean square error
(MSE) of the ensemble average of a quantized, noisy signal. The MSE is a signal-
independent measure of the average signal variance. When the signals over which we
average are randomly scaled, there is no obvious way of defining the MSE. One way of
circumventing this problem is to, as we did in Sect. 4.2 above, calculate variances of a large
number of randomly selected points and then taking the average in order to achieve
variances that are roughly signal-independent (Fig. 8). In the future, more sophisticated
definitions of average variance that account for random scaling as well as quantization and
stochastic noise should be developed.
Direct averaging with subsequent amplitude and phase calculation (Method I) provides the
same results as Method II in the large SNR limit. Method I is potentially a more efficient
averaging method, since amplitude and phase need not be computed for each pulse.
However, signal degradation is more sensitive to alignment errors of the pulses before
averaging; the sensitivity to precise alignment increases for increased carrier frequency due
to larger phase errors for the same time lag error. This problem is much reduced when one
performs averaging on amplitude and phase modulations directly (Method II).
6. Conclusion
We have reviewed the statistics of (i) averaged quantized pulses and (ii) averaged
amplitude and phase modulated pulses that are randomly scaled, but not quantized. We
showed that ensemble averaging should be performed on the amplitude and phase
modulations rather than on I and Q. In the final point (iii), we analyzed the asymptotic
statistics for ensemble averaged amplitude and phase modulated pulses that are both
randomly scaled and quantized after IQ-demodulation. We studied the effect of
thresholding (rejecting pulses below a certain amplitude) and found that theoretical
estimates of the variance as function of threshold, closely agree with numerical estimates.
We believe that our analysis is applicable to radar and sonar systems that rely on accurate
estimation of pulse characteristics. We have covered three key aspects of the problem, with
the goal of reducing statistical errors in amplitude and phase modulations. Extensions or
modifications of our work may be necessary to account for the signal chain in a specific
digital system.
Advances in Sonar Technology
90
7. References
Ai, C. & Guoxiang, A. (1991). Removing the quantization error by repeated observation.
IEEE Trans. Signal Processing, vol. 39, no. 10, (oct 1991) 2317-2320, ISSN: 1053-587X.
Belchamber, R.M. & Horlick, G. (1981). Use of added random noise to improve bit-
resolution in digital signal averaging. Talanta, vol. 28, no 7, (1981) 547-549, ISSN:
0039-9140.
Carbone, P. & Petri, D. (1994). Effect of additive dither on the resolution of ideal quantizers.
IEEE Trans. Instrum. Meas., vol. 43, no 3, (jun 1994) 389-396, ISSN: 0018-5456.
Davenport, W.B. Jr. & Root, W.L. (1958), An Introduction to the Theory of Random Signals and
Noise, McGraw-Hill Book Company, Inc., New York.
Jane, R. H., Rix, P., Caminal, P. & Laguna, P. (1991). Alignment methods for averaging of
high-resolution cardiac signals - a comparative study of performance. IEEE
Trans. Biomed. Eng, vol. 38, no. 6 (jun 1991) 571-579, ISSN: 0018-9294.
Koeck, P.J.B. (2001). Quantization errors in averaged digitized data. Signal Processing, vol. 81,
no. 2, (feb 2001) 345-356, ISSN: 0165-1684.
Laguna, P. & Sornmo, L. (2000). Sampling rate and the estimation of ensemble variability for
repetitive signals. Med. Biol. Eng. Comp, vol. 38, no. 5, (sep 2000) 540-546, ISSN:
0140-0118.
Meste, O. & Rix, H. (1996). Jitter statistics estimation in alignment processes. Signal
Processing, vol. 51, no. 1, (may 1996) 41-53, ISSN: 0165-1684.
Øyehaug, L. & Skartlien, R. (2006). Reducing the noise variance in ensemble-averaged
randomly scaled sonar or radar signals. IEE Proc. Radar Sonar Nav., vol. 153, no. 5,
(oct 2006) 438-444, ISSN: 1350-2395.
Papoulis, A. (1965). Probability, Random Variables, and Stochastic Processes, McGraw-Hill Book
Company, Inc., New York, ISBN: 0-07-048448-1.
Schijvenaars, R.J.A., Kors, J.A. & Vanbemmel, J.H. (1994). Reconstruction of repetitive
signals. Meth. Inf. Med., vol. 33, no. 1, (mar 1994) 41-45, ISSN: 0026-1270.
Skartlien, R. & Øyehaug, L. (2005). Quantization error and resolution in ensemble averaged
data with noise. IEEE Trans. Instrum. Meas., vol. 53, no. 3, (jun 2005) 1303-1312,
ISSN: 0018-5456.
Viciani, S., D’Amato, F., Mazzinghi, P., Castagnoli, F., Toci, G. & Werle, P. (2008). A
cryogenically operated laser diode spectrometer for airborne measurement of
stratospheric trace gases. Appl. Phys. B, vol. 90, no. 3-4, (mar 2008), 581-592, ISSN:
0946-2171.
Sonar Detection and Analysis
5
Independent Component Analysis for
Passive Sonar Signal Processing
Natanael Nunes de Moura, Eduardo Simas Filho and José Manoel de Seixas
Federal University of Rio de Janeiro – Signal Processing Laboratory/COPPE – Poli
Brazil
1. Introduction
Systems employing the sound in underwater environments are known as sonar systems.
SONAR (Sound Navigation and Ranging) systems have been used since the Second World
War (Waite, 2003), (Nielsen, 1991). These systems have the purpose of examining the
underwater acoustic waves received from different directions by the sensors and determine
whether an important target is within the reach of the system in order to classify it. This
gives extremely important information for pratical naval operations in different conditions.
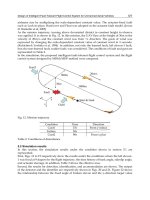
Fig. 1 shows a possible scenario for a sonar operation, in which two targets: the ship that is a
surface contact and another submarine. In this case, the submarine’s hydrophones are
receiving the signals from the two targets and the purpose is to identify both targets.
Fig. 1. Possible scenario for sonar operation
Depending on the sonar type, it may be, passive or active. The active sonar system transmits
an acoustic wave that may be reflected by the target and signal detection, parameter
estimation and localization can be obtained through the corresponding echoes (Nielsen,
Advances in Sonar Technology
92
1991), (Waite, 2003). A passive sonar system performs detection and estimation using the
noise irradiated by the target itself (Nielsen, 1991) (Clay & Medwin, 1998), (Jeffsers et al.,
2000). The major difficulty in passive sonar systems is to detect the target in huge
background noise environments. As much in active and passive mode, the sonar operator,
(SO) listens to the received signal from one given direction, selected during the
beamforming, envisaging target identification. This chapter focus on passive sonar systems
and how the received noise is analysed that may arise. In particular, the signal interference
in neighbour directions is discussed. Envisaging interference removal, Independent
Component Analysis (ICA) (Hyvärinen, 2000) is introduce and recent results obtained from
experimental data are described. The chapter is organised as it follows. In next Section, the
analysis performed by passive sonar systems is detailed described. Section 3 introduces ICA
principles and algorithms. Section 4 shows how ICA may be applied for interference
removal. Finally, a chapter summary and perspectives of passive sonar signal processing are
addressed in Section 5.
2. Passive sonar analysis
A passive sonar system is typically made from a number of building blocks (see Fig. 2);
described in terms of its aim and specific signal processing techniques that have been
applied for signal analysis.
Hydrophone Array
Beamforming
Beam select
(Audio)
Detection
Classification
Tracking
Display
Bearing time
Fig. 2. Blocks diagram for passive sonar system
2.1 Sensors array
The passive sonar systems rely very much on the ability of their sensors in capturing the
noise signals arriving in different directions. Typically, sensors (hydrophones) are arranged
in arrays for fully coverage of detection directions The hydrophone array may be linear,
Independent Component Analysis for Passive Sonar Signal Processing
93
planar, circular or cylindrical. For the experimental results in Section 4, signals, were
acquired through a cylindrical hydrophone array (CHA) while realizing an omnidirectional
surveillance. This type of array comprises a number of sensor elements, which are
distributed along staves. Therefore, the design performance depends on the number of
staves, the number of hydrophones and the number of vertical elements in a given stave.
For instance, the CHA from which the experimental tests were derived has 96 staves.
2.2 Beamforming
The beamforming operation aims at looking at a given direction of arrival (DOA) with the
purpose of observing the target energy of a given direction through a bearing time display
(Krim & Viberg, 1996). The signals are acquired employing the delay and sum (ds)
technique to realize the DOA, allowing omnidirectional surveillance (Knight et al., 1981). In
case of the experimental results to be described in Section 4, the directional beam is
implemented using 32 adjacent sensors as it is shown in Fig. 3. A total of 32 adjacent staves
were used to compute the direction of interest which gives an angular resolution of 3.75
o
.
Fig. 3. Arrange of hydrophones for beamforming on a determined direction
Fig. 4 shows a bearing time display. In this figure, the horizontal axis represents the bearing
position (full coverage, -180
to 180 degrees) and the vertical axis represents time, considering
one second long acquisition window. This corresponds to waterfall display. The energy
Fig. 4. A bearing time display
Advances in Sonar Technology
94
measurement for each bearing at each time window has a gray scale representation. The
sonar operator relies very much on the bearing time display, the sonar operator relies very
much on the in the time display for possible target observation. An audio output permits the
operator to listen to the target noise from a specific direction of interest.
2.3 Signal processing core
After beamforming, passive sonar signal processing comprises detection, classification and,
in some situations, target tracking. For detection, two main analysis are performed; LOFAR
(LOw Frequency Analysis and Recording) and DEMON (Demodulation of Envelope
Modulation On Noise). The LOFAR analysis is also used for target classification.
2.3.1 LOFAR analysis
The LOFAR is a broadband spectral analysis (Nielsen, 1991) that covers the expected
frequency range of the target noise as, for instance, machinery noise. The basic LOFAR block
diagram is shown in Fig. 5.
Fig. 5. Block diagram of the LOFAR analysis
As it can be depicted from Fig. 5, at a given direction of interest (bearing), the incoming
signal is firstly multiplied by a Hanning window (Diniz et al., 2002), In the sequence, short-
time Fast Fourier Transform (FFT) (Brigham, 1988) is applied to obtain signal representation
in the frequency-domain (Spectral module). The signal normalization follows typically
employing the TPSW (Two-Pass Split Window) algorithm (Nielsen, 1991) for estimating the
background noise (see Fig. 6).
-8
-2
-1
0
1
28
Central gap = 5
Window width = 17
w
H(w)
Fig. 6. TPSW window.
Independent Component Analysis for Passive Sonar Signal Processing
95
FREQUENCY (Hz)
TIME (s)
0 5000 10000 15000
0
20
40
60
80
100
120
140
160
180
Fig. 7. Typical LOFAR display.
This window will slide along the signal and performing a local average to achieve the
removal of background noise and making a sign of normalization. This TPSW normalization
aims at estimation a mean spectrum by computing a local mean for each sample. This makes
it possible to remove the bias and perform peak equalization, so that the amplitudes in all
spectrums present similar values.
Fig. 7 shows a typical display from LOFAR analysis. The horizontal axis corresponds to
frequency, in this case covering range of 0 to 15.625 Hz, and the vertical axis represents time.
In this case, 200 acquisition windows (one second long each were accumulated). As can be
seen in Fig. 7, some rays of often persist over time, thus characterizing the type of target
being identified.
2.3.2 DEMON analysis
DEMON is a narrowband analysis that operates over the cavitation noise of the target
propeller with the purpose of identifying the number of shafts, shaft rotation frequency and
the blade rate (Nielsen, 1999), (Trees, 2001). As these parameters provide a detailed
knowledge about the target propellers and normally the propeller noise is characteristic of
each contact, this analysis shows good detection capabilities. Fig. 8 shows the block diagram
of classical DEMON analysis.
Fig. 8. Block diagram of the DEMON analysis
Given a direction (bearing) of interest, noise signal is bandpass filtered to limit the cavitation
frequency range. The cavitation frequency goes from hundreds until thousands of Hz.
Therefore, it is important to select the cavitation band and obtain the maximum information
Advances in Sonar Technology
96
for ship identification. In sequence, the signal is squared as in traditional demodulation
(Yang et al., 2007) (Trees, 2001) and the TPSW algorithm is used to reduce the background
noise (Nielsen, 1991). Using TPSW, it is possible to emphasize target signal peaks. In most
cases, the signal sampling rate is relatively high, so that the band of interest is sampled with
coarse resolution with respect to observation needs. Thus, it is necessary to resample the
signal for better observation in the range. Finally, a short-time Fast Fourier Transform
algorithm is applied to observe the peaks in frequency domain. Fig. 9 shows a typical
DEMON plot. The horizontal axis represents the rotation scale (in RPM) while the vertical
axis correspond to signal amplitude (in dB). This allows target identification, as shaft
rotation and the number of blades may be obtained. The largest amplitude reveals the speed
of shaft rotation, while the subsequent harmonics indicate the number of blades. In this
example, the shaft rotation is about 148 RPM and next hamonics are, 293.6, 441.8, 587.1 and
735.3 RPM, from which the number of blades can be obtained.
0 200 400 600 800 1000 1200 1400
-10
-9
-8
-7
-6
-5
-4
-3
-2
-1
0
X: 148.2
Y: 0
ROTATION (RPM)
AMPLITUDE (dB)
X: 441.8
Y: -4.126
X: 293.6
Y: -1.454
X: 587.1
Y: -4.98
X: 735.3
Y: -5.342
Fig. 9. typical DEMON display.
2.3.3 Classification
Another important task for passive sonar systems is target classification. Usually classification
is based on extracting relevant features that characterize target classes and using such features
to decide whether a detected target belongs to a given class. As already mentioned, features
are typically extracted in frequency domain using the LOFAR analysis. But the stress, many
directions of interest and high number of classes, automatic classification often uses
computational intelligence algorithms to obtain the target class. Neural networks (Haykin,
2001) have successfully been used for passive sonar signal classification. (Moura, 2007),
(Torres., 2004);(Seixas, 2001) and (Soares Filho, 2001). Other signal processing techniques have
been applied to realize the classification task.( Peyvandi, 1998) used a hidden Markov model
with Hausdorff similarity measurement to detect and classify targets. Another way to perform
the detection and classification of targets is to use the Prony’s method (Marple, 1991), which
Independent Component Analysis for Passive Sonar Signal Processing
97
provides an alternative time-frequency mapping (signals are modelled through a sum of
damped sinusoidal components) suitable to acoustic signals.
2.3.4 Tracking
Eventually, tracking a target over time may be important. Usually this is perfomed after
target detection at a specific direction. In some situations, the sonar operator performs
tracking manually, but modern sonars have an automatic system to support this task.
Although Kalman filters (Lee, 2004) have often been used to implement passive tracking
(Rao, 2006), other techniques, (Mellema, 2006) have also been obtaining good results in
target tracking application.
2.3.5 Interference
As it may be depicted from Fig. 9, interference from neighbour bins, as it is the case for
bearings 190
o
and 205
o
, and the self-noise produced by the submarine in which the sonar
system is installed may mask the original target features. Thus, when such is the case, a
preprocessing scheme may be developed aiming at reducing signal interference, facilitating
target identification.This procedure is addopted in Section 4 using the ICA (Hyvärinen, 2001).
3. Independent component analysis
The Independent Component Analysis (ICA) considers that a set of N observed signals x(t)
= [x
1
(t), , x
N
(t)]
T
is originally generated from a linear combination of signal sources s(t) =
[s
1
(t), , s
N
(t)]
T
:
(t)(t) Asx
=
(1)
where, A is the NxN mixing matrix (Hyvärinen et al., 2001). Formulated this way, ICA is
also referred to as Blind Source Separation (BSS) (Cardoso, 1998) and its purpose is to
estimate the original sources s(t) using only observed data, x(t). A solution can be obtained if
we find the inverse of the mixing matrix B = A
-1
and apply this inverse transformation on
the observed signals to obtain the original sources.
(t)(t) Bxs
=
(2)
A general principle for estimating the matrix B can be found by considering that the original
source signals are statistically independent (or as independent as possible). High-order
statistics (HOS) information is required during the search for independent components.
There are many mathematical methods for calculating the coefficients of matrix B. The
nonlinear decorrelation and the maximally nongaussianity are among the most applied ones
(Hyvärinen & Oja, 2000). There are some indeterminacies in the ICA model, the order of
extraction of the independent components can change and scalar multipliers (positive or
negative) may be modifying the estimated components. Fortunately these limitations are
insignificant in most applications (Hyvärinen et al., 2001).
3.1 Statistical independence
Considering two random variables x and y, they are statistically independent if and only if
(Papoulis, 1991):
Advances in Sonar Technology
98
)()(),(
,
yxyx
yxyx
ppp =
(3)
where p
x,y
(x, y), p
x
(x) and p
y
(y) are, respectively, the joint and marginal probability density
functions (pdf) of x and y. Equivalent condition is obtained if for all absolutely integrable
functions g(x) and h(y) the expression on Eq. 4 holds:
)}({)}({)}()({ yxyx hEgEhgE
=
(4)
where E{.} is the expectation operator (Hyvärinen et al., 2001).
In typical blind signal processing problems, there is very little information on the source
signals and so direct estimation of the pdfs is a very difficult task. Eq. 4 gives an alternative
independence measure and is the origin of a class of ICA algorithms that searches for
nonlinear decorrelation.
Independent variables are uncorrelated, although, the reciprocal is not always true. Linear
correlation is verified by second order statistics, while independence needs higher order
information. In the nonlinear decorrelation methods, nonlinear functions introduce high-
order statistics, making it possible the search for independent components.
As from Eq. 4, two random variables are statistical independent if they are nonlinearly
uncorrelated. As it is not possible to check all integrable functions g(.) and h(.), estimates of
the independent components are obtained while guaranteeing nonlinear decorrelation
between a finite set of nonlinear functions (Hyvärinen et al., 2001).
For example, a well known linear ICA algorithm, proposed by Cichocki and Unbehauen in
(Hyvärinen & Oja, 2000), searches for independent components while providing
decorrelation between a hyperbolic tangent and a polynomial function, both applied to the
input signals (observations).
3.1.1 Non-gaussianity and independence
The ICA/BSS model described in Eq. 1 can be re-written as:
∑
=
==
N
j
jiji
Nisax
1
, ,1
(5)
Considering the central limit theorem (Spiegel et al., 2000): “The sum of two (independent)
random variables is always closest to a Gaussian distribution than the original variables
distributions”. As described in Eq. 5, the observed signals x
i
are formed by an averaged
summation of the sources s
i
. Thus, x
i
is closer to Gaussian-distributed variables than s
i
. In
other words, the independent components can be obtained through maximization of non-
gaussianity (Hyvärinen et al., 2001).
The gaussianity (and consequently the statistical dependence) of a random variable can be
measured through higher order cumulants. Considering a random vector x, the moment α
k
and central moment µ
k
of order k are defined by (Spiegel et al., 2000):
dxpE
x
kk
k
)(}{ xxx
∫
∞
∞−
==
α
(6)
dxpE
x
kk
k
)()(}){(
11
xxx
∫
∞
∞−
−=−=
ααμ
(7)
Independent Component Analysis for Passive Sonar Signal Processing
99
where α
1
=m
x
is the mean of x. If the random variable x is zero mean (m
x
=0), than for all k
holds: α
k
=µ
k
.
The cumulant
κ
k
of order k is defined as a function of the moments (Spiegel et al., 2000).
For a zero mean random variable x, the first four cumulants are:
0
1
=
κ
;
2
2
2
}{
ακ
== xE
;
3
3
3
}{
ακ
== xE
; (8)
2
24
224
4
3}]{[3}{
αακ
−=−= xx EE
The third and fourth order cumulants are called respectively skewness (κ
3
) and kurtosis (κ
4
)
(Kim & White, 2004). Cumulants of order higher than four are rarely applied in practical
ICA/BSS problems. Some interesting properties of cumulants are:
(x y) (x) (y)
(x) 0,for k 2 if xis Gaussian
kkk
k
κκκ
κ
+= +
=>
(9)
Therefore, cumulants of order higher than two may be applied to estimate data gaussianity.
The skewness value, for example, is related to pdf symmetry (κ
3
=0 indicates symmetry).
Spanning the interval [−2, ∞), kurtosis is zero for a Gaussian variable. Negative values of
kurtosis indicate sub-gaussianity (pdf flatter than Gaussian) and positive values super-
gaussianity (pdf sharper than Gaussian) (Spiegel et al., 2000). Examples of Gaussian, sub
and super-gaussian distributions are illustrated in Figure 10. Kurtosis can be easily
computed from data substituting expectations in Eq. 8 by sample means. One disadvantage
is that kurtosis can be seriously influenced by outliers (observations that are numerically
distant from the rest of the data), in extreme situations the kurtosis value may be dominated
by a small number of points (Kim & White, 2004). Some studies are been conduced with the
purpose of obtaining robust estimation of high order cumulants, specially the kurtosis
(Welling, 2005).
Alternative gaussianity measures can be obtained from information theory (Cover &
Thomas, 1991). These parameters are usually more robust to outliers than cumulant based
ones (Hyvärinen et al., 2001).
Fig. 10. Examples of Gaussian, sub and super-Gaussian distributions.
Advances in Sonar Technology
100
For instance, Negentropy of a random variable x is calculated through (Cover & Thomas,
1991):
)()()( xxx HHJ
gauss
−
=
(10)
where H (.) is the entropy, and x
gauss
is a Gaussian random variable with the same mean and
variance of x. Entropy is one of the basic concepts of information theory and can be
interpreted as the level of information contained in a random variable. Entropy H(x) can
also be viewed as the minimum code length needed to represent the variable x, considering
a discrete random variable, entropy is defined as (Shannon, 1948):
() ( )log ( )
ii
i
H
Pa Pa== =
∑
xx x
(11)
where a
i
are the possible values assumed by the variable x, and P(x=a
i
) is the probability
that x=a
i
.
An important result is that the Gaussian variables have maximum entropy among variables
of same variance (Hyvärinen et al., 2001). So both entropy and negentropy can be used as
gaussianity measures. The advantage of J(x) is that it is always non-negative and zero when
variable x is Gaussian. A problem with the computation of J (.) and H (.) in blind signal
processing is the pdf estimation (see Eq. 10 and 11). To avoid this, approximations using
high order cumulants or non-polynomial functions shall be applied (Hyvärinen et al., 2001;
Hyvärinen, 1998).
Another statistical independence measure can be obtained through mutual information. The
Mutual Information I(x
1
, x
2
, , x
m
) between m random variables x = [x
1
, x
2
, , x
m
] is
obtained through (Hyvärinen et al., 2001):
∑
=
−=
m
i
im
HxHxxI
1
1
)()(), ,( x
(12)
It is proved elsewhere (Cover & Thomas, 1991) that, more efficient codes are obtained while
using the set of variables x instead of the individual ones x
i
, unless when the variables are
independent ((x
1
, x
2
, , x
m
)=0). So, minimization of mutual information leads to statistical
independence.
The Kullback-Leiber (KL) divergence, defined through Eq. 13 (Hyvärinen et al., 2001):
∫
= dx
P
Q
QPQC
x
x
xKL
)(
)(
log)(),(
x
x
x
(13)
measures the distance between the two probability densities P
x
(x) and Q
x
(x), as it is always
nonnegative with minimum value zero when both densities are the same. If one pdf is
Gaussian, maximizing C
KL
is equivalent to maximize non-gaussianity. The KL divergence is
proved to be equivalent to mutual information (Hyvärinen et al., 2001).
Using one of these statistical independence measures, several routines have been proposed
to find the B matrix (Hyvärinen et al., 2001). Here we consider two which are among the
most successful ICA algorithms.
Independent Component Analysis for Passive Sonar Signal Processing
101
3.2 JADE algorithm
The start point for JADE (Joint Approximate Diagonalization of Eigenmatrices) algorithms is
the realization that BSS (Blind Source Separation) algorithms generally require an estimation
of the distributions of independent sources or have such an assumption built into the
algorithm (Cardoso, 1998). It is also noted that, optimising cumulant approximations of data
implicitly perform this, leading to present a number of approximations to information
theoretic algorithms that operate on second and fourth order cross cumulant.
The cumulant tensor is a linear operator defined by the cumulant of fourth order cum(x
i
, x
j
,
x
k
, x
l
) (Hyvärinen et al., 2001). This linear operation generates a matrix in form of Eq. 14. In
this algorithm, the eigenvalue decomposition is considered as a preprocessing.
F( ) ( , , , )
ij kl i j k l
kl
mcumx x x x=
∑
M
(14)
Where, m
kl
is an element of the matrix M that is transformed and x is an nx1 random vector.
The second order cumulant is used to ensure that data are white (decorrelated)
(Cardoso, 1998). A set of cumulant matrices is estimated from the whitened data, as shown
in Eq. 4.Then F(M) is made diagonal through W for some M
i
.
T
i
WMWQ )F(=
(15)
The minimization of the sum of the squares of the non-diagonal elements of Eq. 15 is
equivalent to maximization of the sum of squares of the diagonal elements, because an
orthogonal matrix W does not change the total sum of squares of a matrix. The
maximization of JADE is a method that gives an approximate joint diagonal of F(M
i
).
∑
=
i
T
iJADE
diagJ
2
||)F((||)( WMWW
(16)
3.3 FastICA algorithm
Independent components can be extracted from a mixture implementing the principles of
maximization of nongaussianity, described in terms of kurtosis or negentropy (Hyvärinen et
al., 2001; Hyvärinen & Oja, 2000; Shaolin & Sejnowski, 1995). Considering a mixture x, one
defines kurtosis in Eq. 8, where W is the weight matrix, and z is a component vector. There
is a whitening step as a preprocessing, and thus, z = Vx, where V is the whitening matrix
and the correlation matrix z is equal to identity, E{zz
T
}= I. So using kurtosis, it is possible to
estimate the independent components from the cost function presented in Eq. 17.
zWx
T
=
)}||||3(E{)]sign[kurt(4
|)kurt(|
2
WWzWzW
W
zW
−=
∂
∂
TT
T
z
(17)
To make the algorithm faster, the gradient computation is changed to Eq. 18 a normalization
was implemented to avoid a W overflow.
3TT
)(E( ))sign(kurt( zWzzWW ∝Δ
||||/ WWW
←
(18)
Advances in Sonar Technology
102
Then, the FASTICA (PEACH, 2000) optimizes Eq. 19.
WzWW 3)}{( −←
T
E
(19)
Another possibility for maximizing non-gaussianity is negentropy (Hyvärinen, 1999). The
classic method of approximating negentropy is using higher order cumulants and
polynomial density expansions, like G(x) = log[cosh(x)] or –exp(x
2
/2). Using a gradient
based method, function derivatives (g) can be chosen to be applied in FASTICA.
WWWzW )}z('{)}z({
TT
gEgE −←
(20)
4. Interference removal
As already mentioned in Section 2, passive sonar signals detected at adjacent bearings may
be masked by cross-channel interference. The complexity of the target identification task
increases proportionally to the interference level. Considering this, blind source separation
methods (Cardoso, 1998) may be useful as a preprocessing step in passive sonar signal
analysis as they project the observed signals into directions of maximum independence.
(a) (b)
Fig. 11. DEMON analysis at (a) 190° and (b) 205°.
Consider a particular problem where two targets are present at adjacent directions (190° and
205°). As illustrated in Fig. 11, the frequency components of 190° target (F
A
=148 RPM and its
multiples) are mixed together with information from the 205° direction (F
B
=119 RPM). The
same problem exists in the signal measured at bearing 205°. It was also observed that both
signals (190° and 205°) are contaminated by F
C
=305 RPM that is the main frequency present
at direction 076°, see Fig. 12. It is known from the experimental setup that the last bearing
(076°) contains information from the noise radiated by the submarine where the
hydrophones array is allocated (self-noise). It can also be verified that, signal measured at
direction 076
o
presents interference from target at 205° (F
B
).
Independent component based methods are applied in the following sub-sections aiming at
reducing signal interference and thus, allow contact identification through DEMON analysis
performed over cleaner data. Signal processing may be performed in both time-domain and
Independent Component Analysis for Passive Sonar Signal Processing
103
frequency-domain. The main advantage of frequency-domain methods is that, after
DEMON, the signal-to-noise ratio is significantly improved, producing better separation
results.
Fig. 12. DEMON analysis at 076°.
Performance comparisons between ICA algorithms applied to passive sonar signal
separation were conduced in (Moura et al. 2007b) and it was observed that JADE presents
slightly better performance. Considering this, the results presented in the next sections were
derived through the application of JADE algorithm to perform ICA.
4.1 Time-domain BSS
A simple and straightforward implementation is to perform independent component
analysis over raw-data. Signals measured at each direction (076°, 190° and 205°) are put
together in order to compose a three component observation vector. An ICA algorithm
(JADE) is applied to estimate three (time-domain) independent components, which will
further be used as inputs to DEMON analysis block. The method is illustrated in Fig. 13.
Fig. 13. Time-domain blind signal separation method.
To obtain quantitative measures of the signal separation performance, the peak amplitude
values of each frequency component (after DEMON analysis) are compared for both raw-
data and separated signals. Moreover, useful information is also obtained from the full-
width at half of the peak value (Full-Width of Half Maximum - FWHM) of a certain
frequency component Fx. This measure indicates whether Fx is accurately estimated (shorter
FWHM) or not (larger FWHM). When ICA is applied, can be observed, from Fig. 14, that,
considering direction 205°, the amplitudes of interfering frequencies F
A
and F
C
were
reduced from -5.9dB and -3.2dB (in raw-data) up to, respectively, -9.1dB and -4.2dB. The
background noise level (estimated from the high frequency components amplitude) was
also reduced from -7dB up to -8.5dB.
Advances in Sonar Technology
104
Fig. 14. DEMON analysis at 205°, for independent signal estimation.
Unfortunately, through this method, at directions 076° and 190° no significant signal
separation was observed. The half-peak bandwidths were not modified either.
A main limitation of this approach is that raw-data is usually corrupted by additive
underwater acoustic environment noise. It is known that, standard ICA algorithms present
poor performance in the presence of noise (Hyvärinen et al., 2001). Modifications on the
traditional ICA model in order to consider additive noise may increase the algorithms
accuracy and thus produce better separation results (Hyvärinen, 1998b).
4.2 Frequency-domain BSS.
An alternative approach is to perform signal separation in the frequency domain. As
illustrated in Fig. 15, DEMON analysis is initially performed over raw-data and frequency
information from the three directions are used as inputs for an ICA algorithm, producing
the independent (frequency-domain) components.
Fig. 15. Frequency-domain blind signal separation method.
As described in Section 2, DEMON analysis basically consists in performing demodulation
and filtering of acoustic data in order to obtain relevant frequency information for target
characterization. Most of noise and nonrelevant signals are eliminated by DEMON, allowing
more accurate estimation of the independent components.
A particular characteristic is that DEMON analysis is usually performed over finite time-
windows (approximate length = 250ms) and the frequency components are estimated within
these windows. Aiming at reducing the random noise generated in time-frequency
transformation, an average spectrum is computed using frequency information from these
time slots.
In Independent Component Analysis algorithms the order and the amplitude of the
estimated components are random parameters and thus different initializations may lead to