Báo cáo hóa học: "Research Article Analysis and Modelling of Muscles Motion during Whole Body Vibration" pdf
Bạn đang xem bản rút gọn của tài liệu. Xem và tải ngay bản đầy đủ của tài liệu tại đây (1.3 MB, 9 trang )
Hindawi Publishing Corporation
EURASIP Journal on Advances in Signal Processing
Volume 2010, Article ID 972353, 9 pages
doi:10.1155/2010/972353
Research Article
Analysis and Modelling of Muscles Motion during
Whole Body V ibration
M. Cesarelli,
1
A. Fratini,
1
P. Bifulco,
1
A. La Gatta,
2
M. Romano,
1
and G. Pasquariello
1
1
Department of Biomedical Electronic and Telecommunication Engineering, University of Naples “Federico II”, 80125 Naples, Italy
2
Math4Tech Centre, University of Ferrara, Ferrara, 44100 Ferrara, Italy
Correspondence should be addressed to M. Cesarelli,
Received 1 May 2009; Accepted 3 August 2009
Academic Editor: Jo
˜
ao Manuel R. S. Tavares
Copyright © 2010 M. Cesarelli et al. This is an open access article distributed under the Creative Commons Attribution License,
which permits unrestricted use, distribution, and reproduction in any medium, provided the original work is properly cited.
The aim of the study is to characterize the local muscles motion in individuals undergoing whole body mechanical stimulation.
In this study we aim also to evaluate how subject positioning modifies vibration dumping, altering local mechanical stimulus.
Vibrations were delivered to subjects by the use of a vibrating platform, while stimulation frequency was increased linearly from
15 to 60 Hz. Two different subject postures were here analysed. Platform and muscles motion were monitored using tiny MEMS
accelerometers; a contra lateral analysis was also presented. Muscle motion analysis revealed typical displacement trajectories:
motion components were found not to be purely sinusoidal neither in phase to each other. Results also revealed a mechanical
resonant-like behaviour at some muscles, similar to a second-order system response. Resonance frequencies and dumping factors
depended on subject and his positioning. Proper mechanical stimulation can maximize muscle spindle solicitation, which may
produce a more effective muscle activation.
1. Introduction
Vibratory stimulations transferred to the whole body, that
is, whole body vibrations (WBVs) treatments, have recently
arouse a great deal of interest. WBVs are widely studied in
the fields of exercise physiology, sport, and rehabilitation
medicine [1–4]. Many studies have indeed accounted for
their impact on metabolic and hormonal activity, neuromus-
cular response, and postural control [5–21].
WBV training aims to mechanically activate muscles by
eliciting reflex neuromuscular activity. In such treatments,
vibrations are generally delivered to the body as a whole by
the use of vibrating plates, while muscular activity estimation
is assessed analysing the simultaneous electromyography
(EMG) activity, in particular the EMGs root mean square
(RMS)values.
These vibrating devices produce vertical sinusoidal osci-
llations (or alternating rotation) of a platform across a fre-
quency range from 10 to 80 Hz and peak-to-peak displace-
ments from 1 to 10 mm [3, 22].
Mostly, individuals undergoing WBV treatments are req-
uested to hold a specific position onto the plate. Vibratory
stimulation, impressed by the platform, transfers to the mus-
cles through the body.
When vibration loads are applied, mechanical and met-
abolic responses arise from the neuromuscular system [2,
7, 9, 17]; muscles increase their activity to dampen the
soft tissue oscillations that occur in response to vibrations
Specific WBV frequencies also seem to produce a higher
EMGs RMS values than others [2].
Although EMG analysis is a common practice in esti-
mating muscle response to vibratory stimulations, EMG is
difficult to measure because vibrations induced in the tissues
causes movement artifacts, which interfere with measure-
ment of muscle activity [23, 24].
However, as reported in a previous study, there is a signif-
icant correlation between muscle motion and EMG activity
[25]. Most of vibration-induced neuromuscular response
occurs at the resonant frequencies of the tissues, concurring
with the highest levels of muscle activity [23, 26–28].
Local mechanical stimulus characterization (i.e., muscle
motion analysis) could be meaningful in discovering proper
muscle stimulation and may contribute to suggest appropri-
ate and effective WBV exercise protocols.
2 EURASIP Journal on Advances in Signal Processing
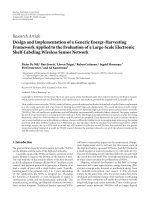
α = 110
◦
Figure 1: Body postures selected for the study.
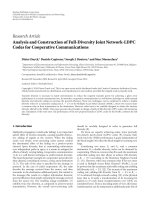
x
y
z
RF
Figure 2: Example of accelerometer arrangement on muscles for
both of the lower limbs. The picture shows the position and
orientation of the accelerometer on RF muscles.
WBV effects depend on intensity, direction and fre-
quency of vibratory stimulation; however, subject training
posture should be considered as one of the most important
factors involved.
This study concentrates on the characterization and
modelling of the muscle motion in individuals exposed to
whole body mechanical stimulation while holding different
postures on platform. In our study we aim also to evaluate
how subject positioning on the platform modifies vibration
dumping through the body and in turn, the local vibratory
stimulus. However, only two postures were analysed: hack
squat position and upright position with heel raised.
Patients were impressed by a linear vibratory stimulation
sweep in a frequency range from 15 to 60 Hz, while motions
of the Rectus Femoris (RF), Biceps Femoris (BF)- (long
head) and Gastrocnemius Lateralis (GL) were analyzed; a
contralateral analysis between both of the lower limbs was
also presented.
Muscle motion analysis showed typical 3D trajectories.
Muscle displacement was found of different amount on each
relative axis; motion components were also found not to be
purely sinusoidal neither in phase to each other.
Results revealed a mechanical resonant-like behaviour at
some muscles, very similar to a second-order system in the
frequency range explored. A simple data fitting was then
performed and it confirmed a high correlation (R
2
1
)between
model and experimental data.
x
y
z
x
y
z
x
y
z
x
y
z
Vibrating
platform
Knee
angle
Muscle
accelerometer
Out
Platform
accelerometer
In
Figure 3: Scheme of measurement setup.
Contralateral analysis showed that the mechanical
behaviour of muscles (both dominant and non dominant
leg) was similar. Two limbs muscles motion resulted to be
synchronous and symmetric with respect to the sagittal-
plane.
2. Methods
2.1. Subjects, Device, and Vibratory Stimulus. Twenty healthy
males(age22.6
± 2.2 years, height 176.7 ± 8.4cm, weight
74.0
± 10.1 kg—athletically untrained), not affected by
any known neurological or musculoskeletal disorder, were
voluntarily involved in the study and gave their informed,
written consent to participate. Vibrations were impressed
by using a vibrating platform (TSEM S.p.A., Padova-Italy).
Platform displacement was exclusively vertical, sinusoidal
with an intensity (peak-to-peak displacement) set to 1.2 mm.
The plate frequency was controlled from a function generator
(Krohn-Hite 5300A) to obtain a linear vibratory stimulation
sweep in a frequency range from 15 to 60 Hz. Frequency
sweep time interval was set to 26 seconds, corresponding to
an increase rate of about 1.7 Hz per second. All the subject
were familiarized with the device and proper positioning
before recording; during the test subjects were requested to
hold two positions (see Figure 1) without the use of any
constraint:
(i) P1: hack squat position: in the hack squat posture,
subjects bent their legs at the knees with an angle of
110
◦
between the lower legs and the upper legs;
(ii) P2: upright on feet toes: in upright posture, subjects
stand on their feet toes with heel raised.
These postures were selected as they are two of the manufac-
turers suggested positions for WBV training; they also reduce
transmission of vibrations to patient’s trunk and head [29].
EURASIP Journal on Advances in Signal Processing 3
−3
−2
−1
0
1
2
3
×10
−4
z (mm)
5
3
1
−1
−3
−5
×10
−4
y (mm)
−3
−2
−1
0
1
2
3
4
×10
−4
x (mm)
RF muscle
(a)
−8
−6
−4
−2
0
2
4
6
8
×10
−4
z (mm)
5
3
1
−1
−3
−5
×10
−4
y (mm)
−5
−3
−1
1
3
5
×10
−4
x (mm)
BF muscle
(b)
−1.5
−1
−0.5
0
0.5
1
1.5
×10
−3
z (mm)
0.015
0.005
−0.005
−0.015
y (mm)
−1
−0.6
−0.2
0.2
0.6
1
×10
−3
x (mm)
GL muscle
(c)
Figure 4: An example of three dimensional displacement of RF, BF and GL muscle belly under vibratory stimulation. The subject was
holding the hack squat position while the frequency of the vibratory stimulus was around to 24 Hz. The figure depicts few cycles. The
reference position for each muscle was placed at the accelerometer axis’origin.
Tiny and lightweight (less than 10 g) three-axial MEMS
accelerometers (Freescale Semiconductors) were used to
measure accelerations onto patient’s skin and on the vibrat-
ing platform (the sensors were set to measure acceleration
within a
±10 g range).
The accelerometers were placed at 50% on the line from
the anterior spina iliaca superior to the superior part of
the patella for RF muscle, at 50% on the line between the
ischial tuberosity and the lateral epicondyle of the tibia for
BF muscle, at 1/3 of the line between the head of the fibula
and the heel for GL muscle and at the centre of the vibration
plate to monitor mechanical vibration (Figure 3). MEMS
accelerometers were stuck onto muscles belly with medical
adhesive tape (3 M). For each postural position, signals from
the muscle bellies (both dominant and nondominant leg)
were collected contemporaneously (Figure 2).
A PC multi-channel 16-bit data acquisition card (NI-
DAQCard 6251) was used to acquire acceleration signals. All
signals were sampled at 2048 Hz.
As mentioned, each of the acquisition (one for each
posture), spaced with 60 seconds rest intervals, had a dura-
tion of 26 seconds; during this time interval the stimulation
frequency, imposed by vibrating plate, raises linearly from 15
to 60 Hz.
2.2. Accelerometer Data Processing. Accelerations signals
provided information related to muscle belly oscillation;
they were preprocessed in order to exclude influence of
gravity and slow accommodation movements on motion
information. Since gravity and subject’s accommodation
movements contributions are typically confined from 0 to
5Hz [30], recordings have been high-pass filtered using a
zero-phase 5th-order Butterworth with a cut off frequency
of 10 Hz.
Muscle and platform displacements were estimated inte-
grating twice the acceleration data after high-pass filtering
on each axis. The resultant vectors were then estimated and
analysed.
2.3. Frequency Response of the Biomechanical System. The fre-
quency response of the biomechanical system was obtained
processing the resultant displacement signals. The actual
displacement of the vibrating plate (which was substantially
constant in amplitude) was considered as the input signal,
while the muscle displacement as system output.
Instantaneous frequency was computed for each vibra-
tion cycle by estimating two subsequent zero-crossings (with
a positive slope) of the signal. Input displacement amplitude,
output displacement amplitude and input/output phase
difference were estimated for each cycle; gains were obtained
by the input/output amplitude ratio. System gain and phase
were then plotted against frequency (experimental system
response).
2.4. System Identification and Data Fitting. A simple data
fitting was performed supposing the system as a pure
4 EURASIP Journal on Advances in Signal Processing
−2
0
2
×10
−3
Z (mm)
−20 2
×10
−3
X (mm)
−2
0
2
×10
−3
Z (mm)
−20 2
×10
−3
Y (mm)
−2
0
2
×10
−3
Y (mm)
−20 2
×10
−3
X (mm)
(a)
−2
0
2
×10
−3
Z (mm)
−20 2
×10
−3
X (mm)
−2
0
2
×10
−3
Z (mm)
−20 2
×10
−3
Y (mm)
−2
0
2
×10
−3
Y (mm)
−20 2
×10
−3
X (mm)
(b)
−2
0
2
×10
−3
Z (mm)
−20 2
×10
−3
X (mm)
−2
0
2
×10
−3
Z (mm)
−20 2
×10
−3
Y (mm)
−2
0
2
×10
−3
Y (mm)
−20 2
×10
−3
X (mm)
(c)
−2
0
2
×10
−3
Z (mm)
−20 2
×10
−3
X (mm)
−2
0
2
×10
−3
Z (mm)
−20 2
×10
−3
Y (mm)
−2
0
2
×10
−3
Y (mm)
−20 2
×10
−3
X (mm)
(d)
Figure 5: An example of the RF muscle belly trajectories over the (x, y), (y, z) and (x, z) planes, at different stimulation frequencies ((a) =
16 Hz, (b) = 25 Hz, (c) = 40 Hz, (d) = 50 Hz). The figure corresponds to P1 subject positioning.
second-order given by the following equation:
G
(
s
)
= K
dc
1
(
s/ω
n
)
2
+2ξ
(
s/ω
n
)
+1
,(1)
where K
dc
is the DC gain, ω
n
is the natural frequency, and ξ
is the dumping ratio.
Model parameters (ω
n
and ξ) were estimated by utilizing
the values of the dominant peak (amplitude and frequency)
of the experimental frequency response; K
dc
coefficient was
estimated minimizing the root mean squared error (RMSE)
between model and experimental data.
2.5. Contralateral Analysis. A contralateral analysis on both
of the lower limbs was also conduced by comparing the
following:
(i) muscle motion of dominant and nondominant leg,
(ii) the estimated resonance frequencies.
In particular we evaluate the symmetry of muscle motion
and the similarity of frequency response between lower
limbs. For each posture and for all of the muscles analyzed
we computed the correlation coefficient (R
2
2
) between the
estimated frequency responses (amplitude) of the two limbs
muscles.
3. Results
Muscle motion analysis showed peculiar three-dimensional
trajectories. Muscle displacement components resulted dif-
ferent on each relative axis; they were also found not to be
purely sinusoidal neither in phase to each other. In Figure 4
are shown typical 3D estimated muscle trajectory over time
(few vibration cycles are represented).
Figures 5, 6 and 7 show some more details about the
motion of the three analysed muscles over the frequency
range explored The image shows the projections of the
trajectory over the three planes: X/Y, Y/Z and X/Z,at
different stimulation frequencies;
In general, acceleration components registered on muscle
belly were not in phase one to another. They were also
different in amplitude and showed a dissimilar behaviour
with the frequency. In general the recorded accelerations
confirmed a frequency-dependent increase.
From Figure 5 it is easy to identify a different mechanical
response for each axis and, in turn for each plane. Displace-
ments on x-, y-andz-axis resulted not always in phase,
neither pure sinusoids (the figures were not exact ellipses).
From figures it is also noticeable that in position P1,
RF and BF muscles movements were more pronounced on
EURASIP Journal on Advances in Signal Processing 5
−2
0
2
×10
−3
Z (mm)
−20 2
×10
−3
X (mm)
−2
0
2
×10
−3
Z (mm)
−20 2
×10
−3
Y (mm)
−2
0
2
×10
−3
Y (mm)
−20 2
×10
−3
X (mm)
(a)
−2
0
2
×10
−3
Z (mm)
−20 2
×10
−3
X (mm)
−2
0
2
×10
−3
Z (mm)
−20 2
×10
−3
Y (mm)
−2
0
2
×10
−3
Y (mm)
−20 2
×10
−3
X (mm)
(b)
−2
0
2
×10
−3
Z (mm)
−20 2
×10
−3
X (mm)
−2
0
2
×10
−3
Z (mm)
−20 2
×10
−3
Y (mm)
−2
0
2
×10
−3
Y (mm)
−20 2
×10
−3
X (mm)
(c)
−2
0
2
×10
−3
Z (mm)
−20 2
×10
−3
X (mm)
−2
0
2
×10
−3
Z (mm)
−20 2
×10
−3
Y (mm)
−2
0
2
×10
−3
Y (mm)
−20 2
×10
−3
X (mm)
(d)
Figure 6: An example of the BF muscle belly trajectories over the (x, y), (y, z) and (x, z) planes, at different stimulation frequencies ((a) =
16 Hz, (b) = 25 Hz, (c) = 40 Hz, (d) = 50 Hz). The figure corresponds to P1 subject positioning.
z-axis; the same result was found in all the subjects (see
Figures 5 and 6).
In Figure 7 it is shown that in position P1 for GL muscle
movements seemed to be more pronounced on y axis.
It is worth mentioning that resonant frequency and
dumping factor were subject dependant.
In P1 position RF and BF resultant displacement showed
a resonance-like profile over frequency; this was not evi-
dent for GL. In P2 position only the GL muscle showed
a resonant-like profile while RF and BF displacements
resulted highly dumped (mean normalized displacement
≤0.4 (mm)/(mm)). RF, BF and GL resonance frequencies
and dumping factors depended on subject.
In Figure 9 is presented an example of the mechanical
behaviour of the three examined muscles, over the frequency
range of interest, for one subject and with respect to each
posture.
For each posture described, the mechanical response of
muscles showing a resonant-like profile was very similar to
that of second-order system (Figure 10), as confirmed by the
correlation coefficient R
2
1
(Ta bl e 1 ).
In general, the contralateral analysis showed that the
mechanical behaviour of muscles was similar.
In P1, mean difference between dominant and non
dominant limb resonance frequencies (ΔFr) was equal to
0.26 (
±1.85) Hz for RF and 0.39 (±2.79) Hz for BF
(Ta bl e 2 ). In P2, ΔFr for GL was equal to 0.03
± 3.23 Hz. R
2
2
coefficient resulted very high, suggesting a similar motion of
contralateral muscles (Ta bl e 2 ).
With respect to position P1, contralateral analysis
revealed that motion of both RF muscles (dominant and
non dominant leg) was synchronous and symmetric in the
sagittal-plane: both RF muscles phase responses were almost
identical along z-andy-axes (synchronicity), while they
showed a difference of π rad along x-axis (symmetry with
respect to sagittal plane). The same behaviour was found for
both of BF muscles.
4. Discussions
Interaction of human body with applied vertical whole
body vibrations strongly depends on subject’s characteristics:
anatomy, positioning, muscle stiffness and other individual
tissue mechanical properties; some authors also consider the
possibility that vibratory stimulation impairs the “muscular
memory” process responsible for predictive force [30].
6 EURASIP Journal on Advances in Signal Processing
−2
0
2
×10
−3
Z (mm)
−20 2
×10
−3
X (mm)
−2
0
2
×10
−3
Z (mm)
−20 2
×10
−3
Y (mm)
−2
0
2
×10
−3
Y (mm)
−20 2
×10
−3
X (mm)
(a)
−2
0
2
×10
−3
Z (mm)
−20 2
×10
−3
X (mm)
−2
0
2
×10
−3
Z (mm)
−20 2
×10
−3
Y (mm)
−2
0
2
×10
−3
Y (mm)
−20 2
×10
−3
X (mm)
(b)
−2
0
2
×10
−3
Z (mm)
−20 2
×10
−3
X (mm)
−2
0
2
×10
−3
Z (mm)
−20 2
×10
−3
Y (mm)
−2
0
2
×10
−3
Y (mm)
−20 2
×10
−3
X (mm)
(c)
−2
0
2
×10
−3
Z (mm)
−20 2
×10
−3
X (mm)
−2
0
2
×10
−3
Z (mm)
−20 2
×10
−3
Y (mm)
−2
0
2
×10
−3
Y (mm)
−20 2
×10
−3
X (mm)
(d)
Figure 7: An example of the GL muscle belly trajectories over the (x, y), (y, z) and (x, z) planes, at different stimulation frequencies ((a) =
16 Hz, (b) = 25 Hz, (c) = 40 Hz, (d) = 50 Hz). The figure corresponds to P2 subject positioning.
0.4
0.6
0.8
1
1.2
Gain (mm/mm)
15 20 25 50
Frequency (Hz)
Biceps femoris-gain
(a)
−1.4
−1
−0.6
−0.2
0.2
0.6
Phase (rad/π)
15 20 25 50
Frequency (Hz)
Biceps femoris-phase
(b)
Figure 8: An example of BF frequency response—(a) amplitude and (b) phase—over frequency with respect to position P1.
Variations of the mentioned parameters modifies the kine-
matic chain, through which mechanical vibration propagates
into the body, altering muscle local mechanical oscillations.
The effects of WBV on muscle motion (i.e., muscle
stimulation) depend on intensity, direction and frequency of
vibratory stimulation; however, subject training posture, as
highlighted by our results, should be considered as one of
the most important factors involved.
This study aimed to characterize different lower limb
muscle motion in individuals exposed to vertical whole
body mechanical stimulation. In our study we analysed
how subject positioning on the platform modifies vibration
dumping and alters the local vibratory oscillation. Two
postures were analysed: hack squat position and upright
position with heel raised. Muscle motion was successfully
measured using tiny and lightweight MEMS accelerometers.
RF, BF and GL muscles motion was here considered: such
kinematics can be expressed as a summation of different
terms: muscle mean position (depending exclusively on
posture), its vibratory displacements and subjects small
accommodation movements.
Those three kinematic components can be easily sepa-
rated in the frequency domain: the stationary position and
the slow, small postural adjustments are confined to the very
EURASIP Journal on Advances in Signal Processing 7
0
0.5
1
1.5
2
Gain (mm/mm)
15 20 25 30 35 40 45 50 55 60
RF P1
Frequency (Hz)
(a)
0
0.5
1
1.5
2
Gain (mm/mm)
15 20 25 30 35 40 45 50 55 60
RF P2
Frequency (Hz)
(b)
0
0.5
1
1.5
2
Gain (mm/mm)
15 20 25 30 35 40 45 50 55 60
BF P1
Frequency (Hz)
(c)
0
0.5
1
1.5
2
Gain (mm/mm)
15 20 25 30 35 40 45 50 55 60
BF P2
Frequency (Hz)
(d)
0
0.5
1
1.5
2
Gain (mm/mm)
15 20 25 30 35 40 45 50 55 60
GL P1
Frequency (Hz)
(e)
0
0.5
1
1.5
2
Gain (mm/mm)
15 20 25 30 35 40 45 50 55 60
GL P2
Frequency (Hz)
(f)
Figure 9: An example of estimated normalised resultant muscle displacements over frequency with respect to position P1 ((a) for
Rectus Femoris, (c) for Biceps Femoris, (e) for Gastrocnemius Lateralis) and P2 ((b) for Rectus Femoris, (d) for Biceps Femoris, (f) for
Gastrocnemius Lateralis).
Table 1: Frequency response parameters: mean
± SD.
Fr (Hz) Mr (mm/mm) Q R
2
1
RF P1 20.50 ± 1.84 1.42 ± 0.37 3.49 ± 1.24 0.95 ± 0.05
BF P1 19.90
± 2.44 1.12 ± 0.18 2.56 ± 1.06 0.95 ± 0.06
GL P2 30.30
± 8.27 1.04 ± 0.36 2.49 ± 1.02 0.89 ± 0.11
low frequencies (0 to 5 Hz) [31], while frequency content of
a muscle motion induced by vibration basically consists of
the fundamental vibration frequency (i.e., from 15–60 Hz in
these trials) and its superior harmonics.
Therefore, in order to consider only vibration related
muscle oscillations, standard high pass filtering was com-
bined with double integration providing reliable estimation
of the actual muscle displacements.
Three-dimensional muscle motion resulted relatively
complex: each of the motion component (along the relative
x-,y-,z-axes) resulted not always purely sinusoidal neither in
phasetoeachother.
RF and BF resonance were observed below 25 Hz while
individuals maintain position P1; similarly a GL resonant
response was found above 30 Hz in position P2.
The analysis of the resultant estimated displacements
confirmed that BF and RF muscles achieved the maximum
oscillation (i.e., receive the maximal vibration stimulation)
in position P1 while GL maximal oscillation was achieved in
position P2.
8 EURASIP Journal on Advances in Signal Processing
0
0.2
0.4
0.6
0.8
1
1.2
1.4
Gain (mm/mm)
15 20 25 30 35 40 45 50 55 60
Frequency (Hz)
Biceps femoris
Figure 10: An example of second-order system data fitting:
continuous line represent the estimated muscle transfer function
while the dotted line shows the second-order approximation.
Table 2: Contra-lateral analysis: mean
± SD.
ΔFr (Hz) R
2
2
RF P1 0.26 ± 1.85 0.95 ± 0.04
BF P1 0.39
± 2.79 0.95 ± 0.03
GL P1 X 0.94
± 0.04
RF P2 X 0.88
± 0.09
BF P2 X 0.94
± 0.06
It is worth mentioning that only for this posture/muscle
combinations a resonant-like behaviour was clearly visible;
however further investigations will be considered to assess
the variability of muscle response after multiple vibratory
stimulations and different rest periods.
Since experimental data resembled a second-order
system like response (suggesting a kinematic equivalent
behaviour of a wobbling damped oscillating mass) a simple
data fitting was performed. The high correlation coefficient
(R
2
1
,seeTa bl e 1 ) between the empirical frequency response
and analytical second-order transfer function then con-
firmed the validity of the assumption.
Contra-lateral analysis showed nonsignificant differences
between dominant and nondominant lower limb; both
lower limbs muscles motion resulted to be synchronous and
symmetric with respect to the sagittal-plane.
However muscles mechanical resonance characteristics
(frequency and dumping factor) depended on subject.
In conclusion, as highlighted in this study, vibratory
induced muscle oscillations strongly depend on subject’s
posture; as suggested, our results confirmed the meaning of
a proper positioning in vibratory stimulus transmission.
Since WBV training is included in many fitness and
rehabilitation centres exercise programmes, improvements
in current knowledge would be helpful in discovering
effective exercise protocols.
Assuming the hypothesis of correlation between muscle
motion and EMG activity [25], WBV muscle stimulation
programmes have to take into account the posture hold by
subject on platform, and in turn, the local muscle mechanical
oscillation (i.e., local muscle stimulation). In particular our
results suggested that BF and RF muscles may receive the
maximal stimulus in position P1 while the for GL muscle
stimulation may be preferable position P2.
However, maximizing muscles motion could act in
producing more muscle lengthening, and in turn higher
muscle activation. In addition, since this study involved
untrained male subjects, studies with female subjects should
be performed to compare with the results obtained for male
subjects.
Acknowledgment
The authors are grateful to TSEM S.p.A. for providing
vibrating platform device.
References
[1] J. R. Burke, M. C. Schutten, D. M. Koceja, and G. Kamen,
“Age-dependent effects of muscle vibration and the Jendrassik
maneuver on the patellar tendon reflex response,” Archives of
Physical Medicine and Rehabilitation, vol. 77, no. 6, pp. 600–
604, 1996.
[2] M. Cardinale and J. Lim, “Electromyography activity of vastus
lateralis muscle during whole-body vibrations of different
frequencies,” Journal of Strength and Conditioning Research,
vol. 17, no. 3, pp. 621–624, 2003.
[3] M. Cardinale and J. Wakeling, “Whole body vibration exer-
cise: are vibrations good for you?” British Journal of Sports
Medicine, vol. 39, no. 9, pp. 585–589, 2005.
[4]C.Delecluse,M.Roelants,andS.Verschueren,“Strength
increase after whole-body vibration compared with resistance
training,” Medicine and Science in Sports and Exercise, vol. 35,
no. 6, pp. 1033–1041, 2003.
[5] J. E. Desmedt and E. Godaux, “Vibration-induced discharge
patterns of single motor units in the masseter muscle in man,”
Journal of Physiology, vol. 253, no. 2, pp. 429–442, 1975.
[6] C. Bosco, R. Colli, E. Introini, et al., “Adaptive responses
ofhumanskeletalmuscletovibrationexposure,”Clinical
Physiology, vol. 19, no. 2, pp. 183–187, 1999.
[7] C. Bosco, M. Cardinale, and O. Tsarpela, “Influence of
vibration on mechanical power and electromyogram activity
in human arm flexor muscles,” European Journal of Applied
Physiology and Occupational Physiology, vol. 79, no. 4, pp. 306–
311, 1999.
[8] I. Bautmans, E. Van Hees, J C. Lemper, and T. Mets, “The
feasibility of whole body vibration in institutionalised elderly
persons and its influence on muscle performance, balance and
mobility: a randomised controlled trial,” BMC Geriatrics, vol.
5, article 17, p. 8, 2005.
[9] C. Bosco, M. Iacovelli, O. Tsarpela, et al., “Hormonal responses
to whole-body vibration in men,” European Journal of Applied
Physiology, vol. 81, no. 6, pp. 449–454, 2000.
[10] C. Bosco, M. Cardinale, O. Tsarpela, et al., “The influence of
whole body vibration on jumping performance,” Biology of
Sport, vol. 15, no. 3, pp. 157–164, 1998.
[11] J. A. Eisman, “Good, good, good good vibrations: the best
optionforbetterbones?”The Lancet, vol. 358, no. 9297, pp.
1924–1925, 2001.
[12] I. Homma, T. Nagai, T. Sakai, M. Ohashi, M. Beppu, and K.
Yonemoto, “Effect of chest wall vibration on ventilation in
patients with spinal cord lesion,” Journal of Applied P hysiology,
vol. 50, no. 1, pp. 107–111, 1981.
EURASIP Journal on Advances in Signal Processing 9
[13] V. B. Issurin, D. G. Liebermann, and G. Tenenbaum, “Effect
of vibratory stimulation training on maximal force and
flexibility,” Journal of Sports Sciences, vol. 12, no. 6, pp. 561–
566, 1994.
[14] K. Kerschan-Schindl, S. Grampp, C. Henk, et al., “Whole-
body vibration exercise leads to alterations in muscle blood
volume,” Clinical Physiology, vol. 21, no. 3, pp. 377–382, 2001.
[15] S. Verschueren, M. Roelants, C. Delecluse, S. Swinnen, D.
Vanderschueren, and S. Boonen, “Effect of 6-month whole
body vibration training on hip density, muscle strength, and
postural control in postmenopausal women: a randomized
controlled pilot study,” Journal of Bone and Mineral Research,
vol. 19, no. 3, pp. 352–359, 2004.
[16] C. D. Marsden, J. C. Meadows, and H. J. Hodgson, “Observa-
tions on the reflex response to muscle vibration in man and its
voluntary control,” Brain, vol. 92, no. 4, pp. 829–846, 1969.
[17] J. Mester, P. Spitzenfeil, J. Schwarzer, and F. Seifriz, “Biological
reaction to vibration-Implications for sport,” Journal of Science
and Medicine in Sport, vol. 2, no. 3, pp. 211–226, 1999.
[18] J. Mester, H. Kleinoder, and Z. Yue, “Vibration training:
benefits and risks,” Journal of Biomechanics, vol. 39, no. 6, pp.
1056–1065, 2006.
[19] J. Rittweger, H. Schiessl, and D. Felsenberg, “Oxygen uptake
during whole-body vibration exercise: comparison with squat-
ting as a slow voluntary movement,” European Journal of
Applied Physiology, vol. 86, no. 2, pp. 169–173, 2001.
[20] C. T. Rubin, R. Recker, D. Cullen, J. Ryaby, J. McCabe, and K.
McLeod, “Prevention of postmenopausal bone loss by a low-
magnitude, high-frequency mechanical stimuli: a clinical trial
assessing compliance, efficacy, and safety,” JournalofBoneand
Mineral Research, vol. 19, no. 3, pp. 343–351, 2004.
[21] S. Torvinen, P. Kannus, H. Siev
¨
anen, et al., “Effect of
a vibration exposure on muscular performance and body
balance. Randomized cross-over study,” Clinical Physiolog y
and Functional Imaging, vol. 22, no. 2, pp. 145–152, 2002.
[22] C. Bosco, “Automatic device for optimized muscular stimula-
tion,” US patent no. WO01/56650, January 2001.
[23] A. Fratini, M. Cesarelli, P. Bifulco, and M. Romano, “Relevance
of motion artifact in electromyography recordings during
vibration treatment,” Journal of Electromyography and Kinesi-
ology, vol. 19, no. 4, pp. 710–718, 2009.
[24] H. De Talhouet and J. G. Webster, “The origin of skin-stretch-
caused motion artifacts under electrodes,” Physiological Mea-
surement, vol. 17, no. 2, pp. 81–93, 1996.
[25] A. Fratini, P. Bifulco, M. Cesarelli, G. Pasquariello, M.
Romano, and A. La Gatta, “Correspondence between muscle
motion and EMG activity during whole body vibration,” in
Proceedings of the 4th European Conference of the International
Federation for Medical and Biological Engineering (IFMBE ’08),
vol. 22, pp. 2069–2072, Antwerp, Belgium, 2008.
[26] J. M. Wakeling and A M. Liphardt, “Task-specific recruitment
of motor units for vibration damping,” Journal of Biomechan-
ics, vol. 39, no. 7, pp. 1342–1346, 2006.
[27] J. M. Wakeling, B. M. Nigg, and A. I. Rozitis, “Muscle activity
damps the soft tissue resonance that occurs in response
to pulsed and continuous vibrations,” Journal of Applied
Physiology, vol. 93, no. 3, pp. 1093–1103, 2002.
[28] J. E. Desmedt and E. Godaux, “Mechanism of the vibration
paradox: excitatory and inhibitory effects of tendon vibration
on single soleus muscle motor units in man,” Journal of
Physiology, vol. 285, pp. 197–207, 1978.
[29] B. Harazin and J. Grzesik, “The transmission of vertical whole-
body vibration to the body segments of standing subjects,”
Journal of Sound and Vibration, vol. 215, no. 4, pp. 775–787,
1998.
[30] D. A. Nowak, K. Rosenkranz, J. Hermsd
¨
orfer, and J. Rothwell,
“Memory for fingertip forces: passive hand muscle vibration
interferes with predictive grip force scaling,” Experimental
Brain Research, vol. 156, no. 4, pp. 444–450, 2004.
[31] T.E.Prieto,J.B.Myklebust,R.G.Hoffmann, E. G. Lovett, and
B. M. Myklebust, “Measures of postural steadiness: differences
between healthy young and elderly adults,” IEEE Transactions
on Biomedical Engineering, vol. 43, no. 9, pp. 956–966, 1996.