Báo cáo hóa học: "Enhanced Field Emission from Argon Plasma-Treated Ultra-sharp a-Fe2O3 Nanoflakes" pdf
Bạn đang xem bản rút gọn của tài liệu. Xem và tải ngay bản đầy đủ của tài liệu tại đây (556.56 KB, 5 trang )
NANO IDEAS
Enhanced Field Emission from Argon Plasma-Treated
Ultra-sharp a-Fe
2
O
3
Nanoflakes
Z. Zheng Æ L. Liao Æ B. Yan Æ J. X. Zhang Æ
Hao Gong Æ Z. X. Shen Æ T. Yu
Received: 6 February 2009 / Accepted: 26 May 2009 / Published online: 12 June 2009
Ó to the authors 2009
Abstract Hematite nanoflakes have been synthesized by
a simple heat oxide method and further treated by Argon
plasmas. The effects of Argon plasma on the morphology
and crystal structures of nanoflakes were investigated.
Significant enhancement of field-induced electron emission
from the plasma-treated nanoflakes was observed. The
transmission electron microscopy investigation shows that
the plasma treatment effectively removes amorphous
coating and creates plenty of sub-tips at the surface of the
nanoflakes, which are believed to contribute the enhance-
ment of emission. This work suggests that plasma treat-
ment technique could be a direct means to improve field-
emission properties of nanostructures.
Keywords Field emission Á Metal oxide Á Plasma treated
Introduction
One-dimensional (1-D) and quasi–1-D nanostructures, due
to their high crystal quality, large aspect ratio and sharp
tips are well known as promising candidates for applica-
tions related to cold cathode, field emission of electrons
[1]. Field emission—also called Fowler–Nordheim tun-
neling [2]—is a form of quantum tunneling in which
electrons pass through a barrier in the presence of a high
electric field. This phenomenon is highly dependent on
both the structural properties of materials and the shape of
particular cathode.
Practically, high current density and low turn-on field are
the most desirable properties for electron emitters. For
given materials, field-emission properties are mainly
dependent on the morphologies like dimension and apex
geometry of 1-D and quasi–1-D nanostructures. To improve
the field-emission properties of nanostructures, several
methods were employed before and after the synthesis
process, for example, increasing the carrier concentration
by a heavily ion doping method [3] or modifying the apex
geometry by gas plasma treatment [4].
Recently, experiments have shown that emission current
density of carbon nanotubes could be effectively enhanced by
plasma treatments, which are capable of functionalizing and
modifying the surface structure of carbon nanotubes [5]. In
addition to carbon nanotubes, gas plasmas like H
2
[6], Ar [7],
O
2
, and CF
4
[4] have also been adopted to modify other
nanomaterials. The results demonstrate plasma treatment
could be a simple and efficient method to improve the field-
emission performance of nanostructures. Argon (Ar) plasma
is one kind of clean and non-toxic gas plasmas, which can be
widely used in research and industry field. However, the
effect and mechanism of Ar plasma treatment for the field-
emission properties of metal oxide nanostructures have rarely
been addressed in the literatures [8], although there are a
plenty of publications in the field of carbon nanotubes [9, 10].
Hematite (a-Fe
2
O
3
) is one of the most important magnetic
materials and shows numerous potential applications, such
as the active component of gas sensors [11], photocatalyst
[12], Lithium ion battery [13], and enzyme immunoassay
[14]. The a-Fe
2
O
3
nanoflakes grown atomic force micro-
scope (AFM) tips [15] exhibit promising electron field
Z. Zheng Á L. Liao Á B. Yan Á Z. X. Shen Á T. Yu (&)
Division of Physics and Applied Physics, School of Physical and
Mathematical Sciences, Nanyang Technological University,
Singapore 637371, Singapore
e-mail:
J. X. Zhang Á H. Gong
Department of Materials Science and Engineering, National
University of Singapore, Blk E3A, 9 Engineering Drive 1,
117576 Singapore, Singapore
123
Nanoscale Res Lett (2009) 4:1115–1119
DOI 10.1007/s11671-009-9363-1
emission properties at first time. Our previous works have
demonstrated that a-Fe
2
O
3
nanoflakes could be one of the
promising candidates as future field-emission electron
sources and displays (FEDs) [16]. In this work, we report the
effects of Ar plasma treatment on the crystal structure and
morphology of a-Fe
2
O
3
nanoflakes. The field-emission
properties of the plasma-treated a-Fe
2
O
3
nanoflake film
were also investigated.
Experiment Part
The a-Fe
2
O
3
nanoflakes were synthesized by heating Fe foil
on a conventional hot plate at atmosphere environment, as
described in our previous work [16, 17]. The growth tem-
perature and duration were fixed at 260 °C and 15 h
respectively. The plasma treatment was conducted by a
plasma etching system (March PX-250) under the following
conditions: radio-frequency (RF) frequency of 13.56 MHz,
flow rate of 20 sccm, operating pressure of 0.2 Torr, RF
power of 100 W, and process duration of 10 min.
The morphologies of the as-prepared and plasma-treated
products were examined by scanning electron microscopy
(SEM) (JEOL JSM-6700F) while the compositions of their
top surface were characterized by X-ray diffraction (XRD)
(Bruker D8 with Cu K
a
irradiation) and micro-Raman
spectroscopy (Witech CRM200, k
laser
= 532 nm). The
transmission electron microscopy (TEM) (JEOL JEM
2010F, 200 kV) observation shows the detailed morphol-
ogy and crystal structure of the ultra-sharp nanoflakes.
Field-emission measurements were carried out in a vacuum
chamber with a pressure of 3.8 9 10
-7
Torr at room tem-
perature under a two-parallel-plate configuration. Details of
the measurement system and procedure were reported pre-
viously [18]. The distance between electrodes was kept at
100 lm with a measured emission area of 280 mm
2
.
Results and Discussion
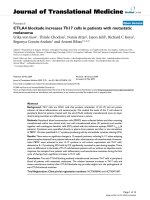
Figure 1 shows the SEM image of the as-prepared sample
obtained. The random aligned nanoflakes synthesized at
this temperature are about 20 nm at the bases, 5 nm as the
radius of the tips, and 1–2 lm in length in general. From
the high magnification SEM image inset of Fig. 1, it can be
clearly seen that there are semispherical tips at the thin
ends of the nanoflakes.
Figure 2a illustrates the XRD patterns of the as-prepared
sample and the plasma-treated sample. The rhombohedral
a-Fe
2
O
3
with lattice constants a = 5.035 A
˚
and c =
13.749 A
˚
are readily conformed from the XRD pattern
[19]. The dominant diffraction peak form the (110) planes
in our XRD pattern results from the (110) growth direction
of the a-Fe
2
O
3
nanoflakes [16]. The XRD pattern reveals a
universal narrowing of peak width for the plasma-treated
samples, which exhibits that the overall crystal quality of
the nanoflakes might be improved by the plasma treatment.
Fig. 1 SEM images of the top surfaces of Fe foils heated for 15 h at
260 °C. Inset shows the high-magnification SEM images of the
nanoflake tip and the circle shows the radius of curvature at the
nanoflake tip
30 40 50 60
0
1
2
3
4
Fe
3
O
4
(214)
Fe
(440)
(110)
(104)
2 Theta (deg.)
(220)
Before plasma treated
After 100W plasma treated
Intensity (a.u.)
200 300 400 500
200
300
400
500
600
E
g
E
g
E
g
A
1g
A
1g
Before plasma treated
After 100W plasma treated
Intensity (a.u.)
Raman Shift (cm
-1
)
(a)
(b)
Fig. 2 a XRD patterns and b Raman spectra of the as-prepared
sample and Ar plasma-treated samples
1116 Nanoscale Res Lett (2009) 4:1115–1119
123
The Raman spectra of these film samples are shown in
Fig. 2b. In the range of 150–550 cm
-1
, there are five peaks
located at 225, 245, 291, 408, and 499 cm
-1
corresponding
to the a-Fe
2
O
3
phase [20], namely two A
1g
modes (225 and
499 cm
-1
) and three E
g
modes (245, 291, and 408 cm
-1
).
The same as the XRD pattern, no new peaks appear in the
Raman spectrum of the plasma-treated sample, which
indicates that the Ar plasma treatment did not introduce
any new phase into the original a-Fe
2
O
3
nanoflakes. After
Ar plasma treatment, some of the peaks (245, 291, and
408 cm
-1
) become relatively weaker, which may be due to
the surface defects on the nanoflakes coming from the
plasma treated. However, the peak position did not shift at
all after plasma treatment demonstrating that this kind of
plasma treatment did not affect the degree of crystalline
perfection in a-Fe
2
O
3
nanoflakes significantly. The XRD
patterns and Raman spectra can be only used to illustrate
the influence of the plasma treatment on total film samples.
The detailed effects of the plasma treatment on the a-Fe
2
O
3
nanoflakes surface structures need to be further confirmed
by other characterization methods.
To further reveal the influence of the Ar plasma treatment
on the structure of the surface and interior of the nanoflakes
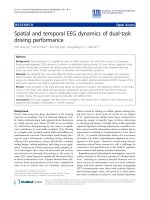
at an atomic level, TEM was employed. Figure 3 displays
the representative TEM images of a-Fe
2
O
3
nanoflakes
before and after Ar plasma treatment for 10 min. As can be
seen in the high-resolution TEM (HRTEM) image (Fig. 3b)
of the region highlighted by a square in Fig. 3a, a very thin
amorphous layer covers the surface of the as-grown nano-
flakes, which is shown between two solid black lines. A
typical low-magnification TEM image of the plasma-treated
nanoflakes is shown in Fig. 3c. It is obvious that the amor-
phous layer was totally removed by Ar plasma and the
nanoflakes became atomic scale clean. More importantly,
plenty of surface protrusions as indicated by the arrows were
formed by plasma treatment (Inset of Fig. 3c). The extension
of the crystal lattice readily demonstrates that such protru-
sions of 1–3 nm in size are epitaxially connected with the
original round tip body. Considering the above-mentioned
XRD, Raman, and TEM results, the main effect of Ar plasma
in this work is removing the amorphous layer and creating
nano protrusions. The projected structure can be seen
through a bright-field TEM image of one a-Fe
2
O
3
nanoflake.
(Fig. 4a) The corresponding dark-field TEM further con-
firms the existence of the protrusions on the surface of
plasma-treated nanoflakes (Fig. 4b).
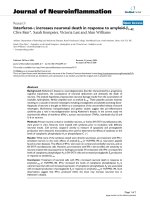
Figure 5a plots the typical current density–electric field
(J–E) curves of the nanoflakes before and after Ar plasma
Fig. 3 a TEM image of the a-
Fe
2
O
3
nanoflake before plasma
treatment, b High-resolution
TEM image of a, c TEM image
of the a-Fe
2
O
3
nanoflake after
plasma treatment. Inset of c
shows the high-resolution TEM
image the highlighted part
Nanoscale Res Lett (2009) 4:1115–1119 1117
123
treatment. The as-grown and plasma-treated nanoflakes
exhibit significantly different emission behaviors. Detailed
measurements reveal that the electron emission performance
of the plasma-treated samples has been dramatically
improved. For example, the maximum current density (under
the field of 11 V lm
-1
) has been increased from the original
16–60 lAcm
-2
. At the same time, the turn-on field has been
reduced from 10 to 8 V lm
-1
after 10 min exposure to Ar
plasma. The exponential dependence between the emission
current and the applied field, plotted by the ln(J/E
2
) - 1/E
relationship (inset of Fig. 5a) were found for both as-grown
and plasma-treated samples, indicating that the field emission
from a-Fe
2
O
3
nanoflake films follow the Fowler–Nordheim
(FN) relationship [21]. The dots are experimental data and the
solid lines are the fitted curves in accordance with the sim-
plified Fowler–Nordheim equation [21]:
J ¼
AðbEÞ
2
/
exp À
B/
3=2
bE
"#
ð1Þ
where J is the current density; E is the local field strength;
/ is the work function, for electron emission which is
estimated to be 5.4 eV [22] for a-Fe
2
O
3
; A and B are
constants with the value of 1.54 9 10
-6
AV
-2
eV and
6.83 9 10
7
Vcm
-1
eV
-3/2
[21] respectively. For
nanostructures, the local field E is usually much stronger
than the ‘‘applied field’’, E
appl
, and modified by a field
enhancement factor b as defined by:
E ¼ bE
appl
¼ b
V
d
ð2Þ
b is a parameter depending on the aspect ratio of the
nanostructures, crystal structures, and the density of the
12
0
20
40
60
80
After 100W plasma treatment
Before plasma treatment
Applied Field Strength (V/µm)
Current Density (µA/cm
2
)
0
048
15
30
0
5
10
15
Current density(
µ
A cm
-2
)
Time (min)
0.15 0.30
-8
-4
0
ln(J/E
2
)
1/E
(b)
(a)
Fig. 5 a Typical field-emission current density–applied field (J–E)
curves of the a-Fe
2
O
3
nanoflakes films before and after 100 W Ar
plasma treatment. Inset shows the F–N plots (ln(J/E
2
) vs. 1/E)
accordingly, which exhibits a good linear dependence (solid line is
the fitting result). b Long-term stability measurement of field-
emission property of nanoflake films after Ar plasma treatment
Fig. 4 a Dark-field and b bright-field TEM images of the tip of the a-
Fe
2
O
3
nanoflake after plasma treatment
1118 Nanoscale Res Lett (2009) 4:1115–1119
123
emitting points; d is the average spacing between the
electrodes (d = 100 lm in this work) and V is the applied
voltage. b was obtained to be 1,131 from the linear fitting
of the F–N curve at turn-on area while that of Ar plasma-
treated nanoflakes was 3,218. This enhanced factor b is
higher or comparable to many other nanostructures, such as
the AlN nanoneedles (b = 748) [23] and the ZnO nanopins
[3](b = 2317).
The field-emission stability of the plasma-treated a-
Fe
2
O
3
nanoflake films was investigated and the typical
result is shown in Fig. 5b. The total emission current was
monitored over 30 min under an applied macroscopic field
of 9 V lm
-1
and an emitter–anode gap of 100 lm. At an
emission current density of *7 lAcm
-2
, the fluctuations
were \5% and no degradations were observed. Comparing
with our previous results [17], it is believed that the Ar
plasma treatment will not only improve the current density
but also extend the stability of the field-emission current.
These results reveal the possibility of Ar plasma treatment
to improve the field-emission performance.
Based on the morphological and crystal structural
investigations, the enhancement of field emission by Ar
plasma treatment could be elucidated. First, the plasma
etching process effectively removes the amorphous coating
and cleans the nanoflakes at atomic level. Second, ultra-
sharp sub-tips of 1–3 nm could be created by the plasma
treatment which can remarkable reduce the diameter of the
emitter for increasing the field enhancement factor [23]. At
last, the density of emitters is significantly increased. All
these effects could enhance the factor b and consequently
improve the emission performance.
Conclusion
In summary, the effects of Argon plasmas on the morphology
and crystal structures of a-Fe
2
O
3
nanoflakes were investi-
gated. Our results successfully demonstrate that the plasma
treatment could effectively clean the nanoflakes, create
plenty of ultra-sharp sub-tips and consequently significantly
enhance the electron emission from plasma-treated nano-
flakes. The high current density and low turn-on field
promise a potential for plasma-treated a-Fe
2
O
3
nanoflakes as
electron emitter. This work also demonstrates the plasma
etching process might be a facile and efficient technique for
improving electron emission of nanostructures.
References
1. Y. Xia, P. Yang, Y. Sun, Y. Wu, B. Mayers, B. Gates, Y. Yin, F.
Kim, H. Yan, Adv. Mater. 15, 353 (2003). doi:10.1002/adma.2003
90087
2. Y. Khlifi, K. Kassmi, L. Roubi, R. Maimouni, M.J. Condens.
Matter. 3, 53 (2000)
3. C.X. Xu, X.W. Sun, B.J. Chen, Appl. Phys. Lett. 84, 1540 (2004).
doi:10.1063/1.1651328
4. Y.W. Zhu, A.M. Moo, T. Yu, X.J. Xu, X.Y. Gao, Y.J. Liu, C.T.
Lim, Z.X. Shen, C.K. Ong, A.T.S. Wee, J.T.L. Thong, C.H. Sow,
Chem. Phys. Lett. 419, 458 (2006). doi:10.1016/j.cplett.2005.
11.087
5. Y.W. Zhu, F.C. Cheong, T. Yu, X.J. Xu, C.T. Lim, J.T.L. Thong,
Z.X. Shen, C.K. Ong, Y.J. Liu, A.T.S. Wee, C.H. Sow, Carbon
43, 395 (2005). doi:10.1016/j.carbon.2004.09.029
6. W.Y. Sung, W.J. Kim, S.M. Lee, H.Y. Lee, Y.H. Kim, K.H. Park,S.
Lee, Vacuum 81, 851 (2007). doi:10.1016/j.vacuum.2006.10.002
7. J.W. Lee, H.N. Cho, S.R. Min, C.W. Chung, Integr. Ferroelectr.
90, 95 (2007). doi:10.1080/10584580701249371
8. S. Mathur, R. Ganesan, I. Grobelsek, H. Shen, T. Ruegamer, S.
Barth, Adv. Eng. Mater. 9, 658 (2007). doi:10.1002/adem.2007
00086
9. S.C. Kung, K.C. Hwang, I.N. Lin, Appl. Phys. Lett. 80, 4819
(2002). doi:10.1063/1.1485315
10. K. Yu, Z. Zhu, M. Xu , Q. Li, W. Lu, Chem. Phys. Lett. 373, 109
(2003). doi:10.1016/S0009-2614(03)00541-4
11. J.S. Han, T. Bredow, D.E. Davey, A.B. Yu, D.E. Mulcahy, Sens.
Actuators B 75, 18 (2001). doi:10.1016/S0925-4005(00)00688-2
12. S.N. Frank, A.J. Bard, J. Phys. Chem. 81, 1484 (1977). doi:
10.1021/j100530a011
13. M.V. Reddy, T. Yu, C.H. Sow, Z.X. Shen, C.T. Lim, G.V. Subba
Rao, B.V.R. Chowdari, Adv. Funct. Mater. 17, 2792 (2007). doi:
10.1002/adfm.200601186
14. X.Y. Liu, X.B. Ding, Z.H. Zheng, Y.X. Peng, A.S.C. Chan, C.W.
Yip, X.P. Long, Polym. Int. 52, 235 (2003). doi:10.1002/pi.1031
15. Y.W. Zhu, T. Yu, A.T.S. Wee, X. J. Xu, C.T. Lim, J.T.L. Thong,
C.H. Sow, Appl. Phys. Lett. 87, 023103 (2005). doi:10.1063/
1.1991978
16. Z. Zheng, Y.Z. Chen, Z.X. Shen, J. Ma, C.H. Sow, W. Huang, T.
Yu, Appl. Phys. A 89, 115 (2007). doi:10.1007/s00339-007-4180-9
17. T. Yu, Y.W. Zhu, X.J. Xu, K.S. Yeong, Z.X. Shen, P. Chen, C.T.
Lim, J.T.L. Thong, C.H. Sow, Small 2, 80 (2006). doi:
10.1002/smll.200500234
18. Y.W. Zhu, T. Yu, F.C. Cheong, X.J. Xu, C.T. Lim, V.B.C. Tan,
J.T.L. Thong, C.H. Sow, Nanotechnology 16, 88 (2005). doi:
10.1088/0957-4484/16/1/018
19. Joint Committee on Powder Diffraction Standards (JCPDS), Card
No. 87-1166, hematite (a-Fe
2
O
3
)
20. I.R. Beattie, T.R. Gilson, J. Chem. Soc. A 5, 980 (1983)
21. R. Fowler, L.W. Nordheim, Proc. R. Soc. Lond. A 119, 173
(1928). doi:10.1098/rspa.1928.0091
22. V.E. Hendrich, P.A. Cox, in Surface science of metal oxides
(Cambridge University Press, Cambridge, UK, 1994)
23. Q. Zhao, J. Xu, X.Y. Xu, Z. Wang, D.P. Yang, Appl. Phys. Lett.
85, 5331 (2005). doi:10.1063/1.1825620
Nanoscale Res Lett (2009) 4:1115–1119 1119
123