Báo cáo hóa học: " Research Article Evaluating Pavement Cracks with Bidimensional Empirical Mode Decompositio" potx
Bạn đang xem bản rút gọn của tài liệu. Xem và tải ngay bản đầy đủ của tài liệu tại đây (1.74 MB, 7 trang )
Hindawi Publishing Corporation
EURASIP Journal on Advances in Signal Processing
Volume 2008, Article ID 861701, 7 pages
doi:10.1155/2008/861701
Research Article
Evaluating Pavement Cracks with Bidimensional
Empirical Mode Decomposition
Albert Ayenu-Prah and Nii Attoh-Okine
Department of Civil and Environmental Engineering, University of Delaware, Newark, DE 19716-3120, USA
Correspondence should be addressed to Nii Attoh-Okine,
Received 5 September 2007; Accepted 2 March 2008
Recommended by Daniel Bentil
Crack evaluation is essential for effective classification of pavement cracks. Digital images of pavement cracks have been analyzed
using techniques such as fuzzy set theory and neural networks. Bidimensional empirical mode decomposition (BEMD), a new
image analysis method recently developed, can potentially be used for pavement crack evaluation. BEMD is an extension of the
empirical mode decomposition (EMD), which can decompose nonlinear and nonstationary signals into basis functions called
intrinsic mode functions (IMFs). IMFs are monocomponent functions that have well-defined instantaneous frequencies. EMD is
a sifting process that is nonparametric and data driven; it does not depend on an a priori basis set. It is able to remove noise from
signals without complicated convolution processes. BEMD decomposes an image into two-dimensional IMFs. The present paper
explores pavement crack detection using BEMD together with the Sobel edge detector. A number of images are filtered with BEMD
to remove noise, and the residual image analyzed with the Sobel edge detector for crack detection. The results are compared with
results from the Canny edge detector, which uses a Gaussian filter for image smoothing before performing edge detection. The
objective is to qualitatively explore how well BEMD is able to smooth an image for more effective edge detection with the Sobel
method.
Copyright © 2008 A. Ayenu-Prah and N. Attoh-Okine. This is an open access article distributed under the Creative Commons
Attribution License, which permits unrestricted use, distribution, and reproduction in any medium, provided the original work is
properly cited.
1. INTRODUCTION
Pavement evaluation is an essential part of a good pavement
management system for effective maintenance, rehabilita-
tion, and reconstruction (MR&R) decision making. Pave-
ment evaluation involves condition surveys to monitor the
overall health of the pavement network, and recommen-
dations made regarding maintenance actions. Traditionally,
pavement condition surveys are visual surveys whereby a
crew is sent out to visually inspect sections of pavement for
various types of distress. The most popular method is the
pavement condition index (PCI) method developed by the
United States Army Corps of Engineers. The PCI assessment
is a visual procedure by which a selected pavement section is
visually evaluated for various distress types, distress severity
and quantity. Apart from the method being subjective and
depending on the expertise of the inspector, it is also quite
expensive. A more objective and less expensive method of
distress evaluation is automated pavement distress evalua-
tion, which system consists of automatically getting images
of distresses and analyzing them using feature selection
methods such as edge detection techniques for distress detec-
tion and identification. Various image-processing techniques
such as fuzzy set theory [1], neural networks [2], and Markov
methods [3] have been used to analyze cracking in road
pavements. Furthermore, there has been work in the area of
aggregate shape characteristics [4–6] using various imaging
techniques.
The present paper explores pavement crack detection
using a new method called the bidimensional empirical
mode decomposition (BEMD) together with a well-known
edge detector, the Sobel edge detector. A number of images
are smoothed with BEMD to remove noise, and the residual
image analyzed with the Sobel edge detector for crack
detection. The results are compared with results from the
Canny edge detector, which first filters out noise from
the image with a Gaussian filter before performing edge
detection. The objective is to qualitatively determine how
2 EURASIP Journal on Advances in Signal Processing
well BEMD is able to smooth an image for more effective
edge detection using the Sobel method.
2. BIDIMENSIONAL EMPIRICAL
MODE DECOMPOSITION
The bidimensional empirical mode decomposition (BEMD)
is the 2-D extension of the empirical mode decomposition
(EMD), which is part of the Hilbert-Huang transform
(HHT) developed by Huang et al. [7]. The empirical mode
decomposition (EMD) is a multiresolution decomposition
method that decomposes signals into basis functions that
are adapted from the signals themselves. That is, no a priori
basis functions are defined for the decomposition as in
Fourier-based methods in which sines and cosines are used
as predefined basis functions and then convolved with the
signal. Therefore, Fourier methods are most suitable for
linear and stationary signals. The EMD is hinged on the
idea of instantaneous frequency; instantaneous frequency
becomes valid only in the event the signal is made symmetric
with respect to the local zero-mean line. Upper and lower
envelopes, which cover all local maxima and local minima,
respectively, are constructed, and then their mean iteratively
removed in order to force local symmetry about the zero-
mean line; the procedure has been termed “sifting.” The
sifting process results in the generation of basis functions
known as intrinsic mode functions (IMFs), which are
adaptively derived from the signal within the local time scale
of the signal; IMFs have instantaneous frequency defined for
them at every point. Therefore, while the EMD is a local
decomposition method, Fourier-based methods are global in
nature, which requires a transformation into the frequency
domain in order to determine the energy content of the
signal; it is not possible to achieve that in the time domain.
The HHT represents the energy content of a signal in an
energy-frequency-time domain called the Hilbert spectrum;
energy content is analyzed in the time domain so that the
exact instance an event occurs is known. It differs from
the wavelet transform, however, in that wavelets still need
a priori defined basis sets similar to the Fourier transform.
Huang et al. [7] gives the full treatment of the HHT method.
The process used to generate the Hilbert spectrum is called
the Hilbert spectral analysis (HSA). Thus the HHT consists
of the two parts, EMD and HSA.
IMFs have certain requirements that need to be met in
ordertobeacceptable:
(i) the number of zero crossings and extrema must be
equal or differ by at most one in whole data sets (to
remove riding waves); and
(ii) the mean value of the envelope defined by the
local maxima and the envelope defined by the local
minima must be zero at every point.
An important step in the EMD process is the con-
struction of the maxima and minima envelopes; research
has shown that the cubic spline is the best fit for 1-D
EMD. There are stopping criteria for the EMD process to
prevent the resulting IMFs from being just purely frequency
Original signal
Construct upper and
lower envelopes, and
find mean
Inner loop
Outer loop
Subtract mean
from original
signal
Check inner loop
residue for IMF
qualification
Not IMF IMF
Treat inner loop
residue as
original signal
Store IMF
Subtract IMF from
original signal, and
treat outer loop
residue as original
signal
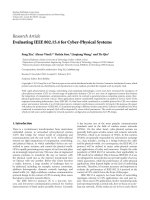
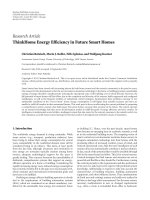
Figure 1: Pictorial representation of EMD.
and amplitude-modulated components. Two stopping cri-
teria have been proposed: a Cauchy-type convergence that
depends on limiting the standard deviation computed from
two consecutive IMFs [7], and one that depends on the
agreement of the numbers of extrema and zero crossings [8].
The whole EMD is stopped when the final residue becomes a
monotonic function, or a constant. A snapshot of the sifting
process to generate IMFs is shown in Figure 1 in which two
loops are presented: the inner loop iterates for IMFs, while
the outer loop subtracts the most current IMF from the
original signal or what is left of it after previous IMFs have
been removed from it, and then passes execution to the inner
loop for the next IMF.
The HHT has a number of advantages that make it desir-
able for signal analysis. The process is empirical and the most
computationally intensive step is the EMD operation, which
does not involve convolution and other time-consuming
operations; this makes HHT ideal for signals of large size.
The Hilbert-Huang spectrum does not involve the concept
of frequency resolution but instantaneous frequency, which
is desirable for local analyses.
The success of the 1-D EMD prompted research into
a 2-D version, which may be used for image process-
ing. Linderhed [9] first introduced 2-D EMD, which has
been subsequently called bidimensional empirical mode
decomposition (BEMD). The basic steps in BEMD are the
same as for the EMD, only in two dimensions. Of much
importance is the envelope construction for maxima and
minima; in this case, scattered data interpolation (SDI) is
used to construct 2-D surfaces. Various SDI methods have
been used to construct maxima and minima envelopes,
A. Ayenu-Prah and N. Attoh-Okine 3
but unpublished results of recent comprehensive analyses
conducted by authors of the present research were not
conclusive regarding the superiority of one SDI method
over another when various methods were used in BEMD
analyses of texture and real images. However, Linderhed
[10] preferred radial basis functions (RBFs) with thin-plate
splines. The appropriate SDI method would depend on
the objective of the BEMD analysis. Before SDI can be
performed, appropriate extrema detection needs to be
carried out. Detection of extrema has been achieved with
methods including morphological reconstruction based on
geodesic operators [11], and neighboring windows [10]. The
stopping criteria for BEMD are similar to that for the 1-D
EMD. BEMD has been used for texture analysis [12]and
image compression [13]. Recently, Sinclair and Pegram [14]
have used it for rainfall analysis and nowcasting.
3. EDGE DETECTION
3.1. Canny method
Edges are areas in an image with sharp intensity gradients.
The objective of edge detection algorithms is to seek out these
points of rapid intensity changes. There are a number of edge
detection algorithms, including the Sobel edge detector, the
Laplacian of Gaussian method, the Canny edge detector, the
fast Fourier transform, the zero-crossing method, the Prewitt
method, and the Roberts method. Of all the edge detection
algorithms, the Canny edge detector seems to be the most
effective in detecting object edges, and the most widely used.
The Canny edge detector detects edges by finding the
pixel points where the gradient magnitude is a maximum
in the direction of the gradient, that is, in the direction
of maximum intensity change. However, the image is first
smoothed with a Gaussian filter to remove noise, which is a
convolution operation. The detection method is summarized
into four steps as follows [15]:
(i) smooth image by convolving with an appropriate
Gaussian filter to reduce image details;
(ii) at each pixel, determine gradient magnitude and
gradient direction along maximum intensity change;
(iii) mark the pixel as an edge if the gradient magnitude
at the pixel is greater than the pixels at both sides of it
in the gradient direction;
(iv) remove the weak edges by hysteresis thresholding.
3.2. Sobel method
Similar to the Canny method, the Sobel edge detector is also
a gradient-based method. It detects edges by searching for
maxima and minima in the first derivative of the image.
However, the Sobel method does not do any presmoothening
of the image; therefore, it is more susceptible to noise, but
is computationally less expensive and faster. The Sobel edge
detector performs a 2-D spatial gradient calculation on a
gray-scale image; two 3
× 3 convolution masks are used to
calculate gradients, one along the x-direction, and the other
along the y -direction. The masks are given as follows:
⎡
⎢
⎣
121
000
−1 −2 −1
⎤
⎥
⎦
in the x-direction;
⎡
⎢
⎣
−
101
−202
−101
⎤
⎥
⎦
in the y-direction.
(1)
3.3. BEMD in edge detection
The potential application of BEMD is in presmoothing of
images before feature detection techniques are applied; this
can pave the way for a hybrid method of edge detection that
involves the BEMD and an edge detector that does not have
a presmoothing step. Images usually tend to be noisy and so
filtering out noise is essential to make the image ready for
further analysis.
In BEMD, an image is decomposed into basis functions
called IMFs; the set of IMFs are complete, so that summing
up the IMFs and any residual left recovers the original image.
EMD essentially acts as a dyadic filter [16, 17], and by
extension, the BEMD also acts as a dyadic filter. It has been
observed that the first IMF constitutes most of the noise in
the signal [11]. Hence removal of the first IMF reduces high
spatial frequencies. Since BEMD is local in nature, image
blurring is reduced. Filtering occurs in time space rather
than in frequency space; therefore, any nonlinearity and
nonstationarity present in the data are preserved. Thus no
spurious harmonics are introduced as occurs in traditional
Fourier analyses that arise out of a priori definition of
sine and cosine basis sets. Although the first IMF has been
observed to contain most of the noise, the first few IMFs
from BEMD still usually contain a lot of the noise in the
original image; therefore, removing them and reconstructing
the image with the remaining IMFs tend to denoise the
image. The number of IMFs needed to be removed depends
on the level of noise in the image; very noisy images require
more high-frequency IMFs removed than do less noisy
images. The Canny edge detector has a prefiltering step in
which images are denoised with a Gaussian filter before
edge detection is accomplished. This detection method can
be computationally more expensive due to the convolution
processes required in Gaussian smoothing. The Sobel edge
detection method has no prefiltering step; however, it is more
susceptible to noise. Therefore, the BEMD is used to first
filter the images before the Sobel method is applied. An
advantage BEMD has over Gaussian filtering is that it does
not involve any convolution process, and it is a local method
of denoising.
Traditional filtering (Gaussian, mean, or median filter-
ing) requires an optimal filter size to perform effectively.
However, it is not a trivial matter to determine the optimal
filter size; a large filter removes much of the noise but leaves
more blur while too small a filter size leaves little blur but
may leave a lot of noise. This problem is circumvented by
the BEMD because it is a local decomposition technique
4 EURASIP Journal on Advances in Signal Processing
Table 1: Detection results for asphalt images.
No. of Images Canny BEMD/Sobel
9
Good detection for 6 of the 9 images Good detection for 3 of the 9 images
or 67% of the 9 images or 33% of the 9 images
Of the 6 images detected, 4 images Of the 3 images detected, 2 images
had cracks (representing 67 % of the 6 images) had cracks (representing 67% of the 3 images)
The remaining 2 images had no cracks The remaining 1 image had no cracks
(representing 33% of the 6 images) (representing 33% of the 3 images)
Table 2: Detection results for PCC images.
No. of Images Canny BEMD/Sobel
6
Good detection for 2 of the 6 images Good detection for 2 of the 6 images
or 33% of the 6 images or 33% of the 6 images
Canny and BEMD/Sobel tied on the remaining 2 of the 6 images
(representing 33% of the 6 images); these images had cracks
Of the 2 images detected, 1 image had cracks Of the 2 images detected, none had cracks
(representing 50% of the 2 images) (representing 0% of the 2 images)
The remaining 1 image had no cracks The remaining 2 images had no cracks
(representing 50% of the 2 images) (representing 100% of the 2 images)
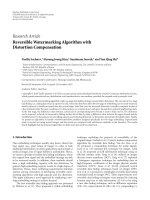
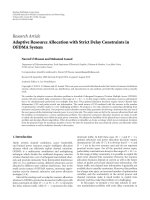
(a) With Canny: asphalt surface
(b) With BEMD/Sobel: asphalt surface
Figure 2
rather than global. For instance, the Gaussian filter incor-
porates the Fourier transform, which is global and hence
introduces some artifacts due to nonstationarity and possible
nonlinearity.
4. ANALYSES
A total of 15 asphalt concrete and portland cement concrete
(PCC) images are analyzed with the Canny edge detector
to detect cracks; the same images are again analyzed with
the Sobel edge detector, but this time BEMD is first used to
smooth the image before detection. The first IMF is removed
from the original image and the residue, which is a smoothed
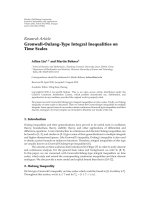
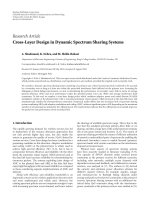
(a) With Canny: asphalt surface
(b) With BEMD/Sobel: asphalt surface
Figure 3
image, is analyzed with the Sobel method; the codes used are
implemented in Matlab. The objective is to find out if BEMD
is able to perform image smoothing for more effective crack
detection. There are 9 asphalt concrete images and 6 PCC
images. A digital camera was used to take the images in clear
weather; each image had a resolution of 256-by-256 pixels.
There are images with cracks and images without cracks.
For brevity, only 8 images are shown in the present paper:
4 asphalt and 4 PCC images.
Hysteresis thresholding is used to aid in crack detection.
The edge detection depends upon selection of appropriate
thresholds; improper thresholds may result in many unnec-
essary edges returned, or insufficient edges that result in
A. Ayenu-Prah and N. Attoh-Okine 5
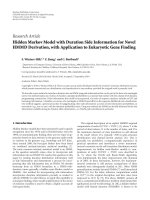
(a) With Canny: asphalt surface
(b) With BEMD/Sobel: asphalt surface
Figure 4
(a) With Canny: asphalt surface
(b) With BEMD/Sobel: asphalt surface
Figure 5
missing important edges. A standard deviation is chosen for
the Gaussian filter, and the effect of thresholding depends on
the chosen standard deviation.
Matlab codes for BEMD are as developed by Nunes et al.
[11]; to generate IMFs, upper and lower envelopes are
constructed from strict extrema using interpolation by
minimum curvature method.
Regarding the images used, asphalt concrete images tend
to have a lot of irregularities due to the nature of the finished
surface while PCC images tend to be smoother with fewer
irregularities. Therefore, detecting cracks on asphalt concrete
surfaces can be more challenging than on PCC surfaces.
5. RESULTS AND DISCUSSION
Figures 2 to 9 show the results of the edge detection attempts
by the Canny edge detector (all the “a” figures above) and by
the combination of BEMD and Sobel edge detector method
(all the “b” figures below). A summary of the detection
results for all 15 images is given in Tables 1 and 2.
After BEMD was performed on an asphalt image, the
first three IMFs were discarded. The image was then recon-
structed with the remaining IMFs, which was then used as
(a) With Canny: PCC surface
(b) With BEMD/Sobel: PCC surface
Figure 6
(a) With Canny: PCC surface
(b) With BEMD/Sobel: PCC surface
Figure 7
the input image for the Sobel Edge Detector. This is necessary
after observing that removing only the first IMF does not
smooth the image enough for edge detection. However,
removal of only the first IMF was sufficient smoothing for the
PCC images. The Canny edge detector already has a Gaussian
filter, so no BEMD was performed for smoothing.
The Canny edge detector, and the BEMD/Sobel method
were able to detect cracks more easily on PCC surfaces, but
with a little bit more difficulty for asphalt surfaces. This
was expected due to the many irregularities on the asphalt
surfaces analyzed. However, the Canny method generally
proved better on asphalt surfaces. It is also observed that
despite the noisy output of the BEMD/Sobel method, crack
edges could be detected on closer examination as may be
seen in Figures 2 and 3.InFigure 2, the edge of the lane
marking and part of the horizontal crack can be made
out in Figure 2(b) despite the noisy output; however, even
with less noise, Figure 2(a) (Canny method) is not able to
detect the whole length of the horizontal crack, but is able
to easily bring out the diagonal crack connecting it at the
junction of the lane marking and the horizontal crack. In
Figure 3, the crack is more easily identified in Figure 3(b)
(BEMD/Sobel). For images with no cracks, as in Figures 4
6 EURASIP Journal on Advances in Signal Processing
(a) With Canny: PCC surface
(b) With BEMD/Sobel: PCC surface
Figure 8
(a) With Canny: PCC surface
(b) With BEMD/Sobel: PCC surface
Figure 9
and 5 for asphalt and Figures 6 and 8 for PCC, both methods
generally give acceptable results; BEMD/Sobel actually gives
less noisy outputs, though, which is better.
Results for both methods were significantly more com-
parable for PCC surfaces. With the exception of Figure 7, the
BEMD plus Sobel method matched the Canny method in the
quality of detection. The BEMD is a local analysis method,
so the expectation is a better performance than the Gaussian
filter, which is a global analysis; fewer artifacts are expected
with BEMD. However, the Sobel method still suffers from the
effects of noise in an image even after smoothing with BEMD
when the image has a lot of irregularities, as is the case for
asphalt concrete surfaces.
6. CONCLUSION
The present paper is an exploration into the possible appli-
cation of BEMD to image smoothing before crack detection
with the Sobel edge detector; the results are compared with
that of the Canny edge detector. Asphalt concrete and PCC
images, both with cracks and without cracks, are analyzed
and compared qualitatively. It is observed that although
BEMD does well smoothing an image before edge detection
with the Sobel method, the Sobel method still suffers from
the effects of noise when the images have lots of irregularities
present, as is the case for asphalt concrete surfaces. For
images with less irregularities, such as the PCC surfaces,
crack detection is more effective, and easily comparable to
results from the Canny method; for PCC surfaces with no
cracks, the BEMD/Sobel method gives outputs with less
noise, which is better. Overall, the Canny edge detector
performed better than the BEMD/Sobel method for asphalt
surfaces, and slightly better for PCC surfaces. More research
is needed to further explore the effectiveness of BEMD as a
smoothing filter for quality crack detection.
ACKNOWLEDGMENT
Part of this paper has been presented at the SPIE Defense
& Security Symposium, Orlando, Florida, USA, 9–13 April
2007.
REFERENCES
[1] H. D. Cheng, J R. Chen, C. Glazier, and Y. G. Hu, “Novel
approach to pavement cracking detection based on fuzzy set
theory,” Journal of Computing in Civil Engineering, vol. 13,
no. 4, pp. 270–280, 1999.
[2] B. J. Lee and H. D. Lee, “Position-invariant neural network
for digital pavement crack analysis,” Computer-Aided Civil and
Infrastructure Engineering, vol. 19, no. 2, pp. 105–118, 2004.
[3] P. Delagnes and D. Barba, “A markov random field for
rectilinear structure extraction in pavement distress image
analysis,” in Proceedings of IEEE International Conference on
Image Processing (ICIP ’95), vol. 1, pp. 446–449, Washington,
DC, USA, October 1995.
[4] C. Chandan, K. Sivakumar, E. Masad, and T. Fletcher,
“Application of imaging techniques to geometry analysis of
aggregate particles,” Journal of Computing in Civil Engineering,
vol. 18, no. 1, pp. 75–82, 2004.
[5] J. M. Brzezicki and J. Kasperkiewicz, “Automatic image analy-
sis in evaluation of aggregate shape,” Journal of Computing in
Civil Engineering, vol. 13, no. 2, pp. 123–128, 1999.
[6] L. Wang, X. Wang, L. Mohammad, and C. Abadie, “Unified
method to quantify aggregate shape angularity and texture
using Fourier analysis,” Journal of Materials in Civil Engineer-
ing, vol. 17, no. 5, pp. 498–504, 2005.
[7] N. E. Huang, Z. Shen, S. R. Long, et al., “The empirical mode
decomposition and the Hilbert spectrum for nonlinear and
non-stationary time series analysis,” Proceedings of the Royal
Society A, vol. 454, no. 1971, pp. 903–995, 1998.
[8] N. E. Huang, M L. C. Wu, S. R. Long, et al., “A confidence
limit for the empirical mode decomposition and Hilbert
spectral analysis,” Proceedings of the Royal Society A, vol. 459,
no. 2037, pp. 2317–2345, 2003.
[9] A. Linderhed, “2-D empirical mode decompositions in the
spirit of image compression,” in Wavelet and Independent
Component Analysis Applications IX, vol. 4738 of Proceedings
of SPIE, pp. 1–8, Orlando, Fla, USA, April 2002.
[10] A. Linderhed, “Variable sampling of the empirical mode
decomposition of two-dimensional signals,” International
Journal of Wavelets, Multiresolution and Information Process-
ing, vol. 3, no. 3, pp. 435–452, 2005.
A. Ayenu-Prah and N. Attoh-Okine 7
[11] J. C. Nunes, Y. Bouaoune, E. Del
´
echelle, O. Niang, and Ph.
Bunel, “Image analysis by bidimensional empirical mode
decomposition,” Image and Vision Computing, vol. 21, no. 12,
pp. 1019–1026, 2003.
[12] J. C. Nunes, S. Guyot, and E. Del
´
echelle, “Texture analysis
based on local analysis of the bidimensional empirical mode
decomposition,” Machine Vision and Applications, vol. 16,
no. 3, pp. 177–188, 2005.
[13] A. Linderhed, “Image compression based on empirical mode
decomposition,” in Proceedings of the 3rd International Con-
ference on Image and Graphics, pp. 430–443, Hong Kong,
December 2004.
[14] S. Sinclair and G. G. S. Pegram, “Empirical mode decompo-
sition in 2-D space and time: a tool for space-time rainfall
analysis and nowcasting,” HydrologyandEarthSystemSciences
Discussions, vol. 2, no. 1, pp. 289–318, 2005.
[15] L. Ding and A. Goshtasby, “On the Canny edge detector,”
Pattern Recognition, vol. 34, no. 3, pp. 721–725, 2001.
[16] P. Flandrin, G. Rilling, and P. Gonc¸alv
´
es, “Empirical mode
decomposition as a filter bank,” IEEE Signal Processing Letters,
vol. 11, no. 2, pp. 112–114, 2004.
[17] Z. Wu and N. E. Huang, “A study of the characteristics of white
noise using the empirical mode decomposition method,”
Proceedings of the Royal Society A, vol. 460, no. 2046, pp. 1597–
1611, 2004.