Báo cáo hóa học: " Research Article Downlink Resource Allocation for Autonomous Infrastructure-based Multihop Cellular Networks" pdf
Bạn đang xem bản rút gọn của tài liệu. Xem và tải ngay bản đầy đủ của tài liệu tại đây (989.27 KB, 14 trang )
Hindawi Publishing Corporation
EURASIP Journal on Advances in Signal Processing
Volume 2009, Article ID 727196, 14 pages
doi:10.1155/2009/727196
Research Article
Downlink Resource Allocation for Autonomous
Infrastructure-based Multihop Cellular Networks
Mahdi Shabany
1
and Elvino S. Sousa
2
1
Department of Electrical Engineering, Sharif University of Technology, P.O. Box 11365-8639, Tehran, Iran
2
Edward S. Rogers Sr. Department of Electrical and Computer Engineering, University of Toronto, Toronto, ON, Canada M5S 3G4
Correspondence should be addressed to Mahdi Shabany,
Received 18 July 2008; Revised 7 December 2008; Accepted 15 February 2009
Recommended by Joerg Kliewer
Considering a multihop cellular system with one relay per sector, an effective modeling for the joint base-station/relay assignment,
rate allocation, and routing scheme is proposed and formulated under a single problem for the downlink. This problem is then
formulated as a multidimensional multichoice knapsack problem (MMKP) to maximize the total achieved throughput in the
network. The well-known MMKP algorithm based on Lagrange multipliers is modified, which results in a near-optimal solution
with a linear complexity. The notion of the infeasibility factor is also introduced to adjust the transmit power of base stations
and relays adaptively. To reduce the complexity, and in order to analyze the underlying key factors in the system, the framework
is restricted to a two-base-station two-relay system. In fact, the output of the proposed algorithm is the joint optimization of the
routing path, and base-station selection to achieve the maximum total throughput in the system, which in conjunction with the
proposed adaptive scheme leads to the implementation of the cell breathing via allocating the proper transmit power to the base-
stations and relays.
Copyright © 2009 M. Shabany and E. S. Sousa. This is an open access article distributed under the Creative Commons Attribution
License, which permits unrestricted use, distribution, and reproduction in any medium, provided the original work is properly
cited.
1. Introduction
Future wireless systems will require the capability to sup-
port very large throughput in selected areas, according
to the location dependent and dynamic user demand,
rather than the capability to support uniform trafficand
coverage throughout a large service area. Ultimately given
the constraint on the available bandwidth, very large system
capacities can only be obtained by going to smaller cells
by devising techniques for the reduction of the intercell
interference. One effective approach to do so is to utilize
multihop cellular network architectures [1–7].
In multihop networks, transmissions from a base station
(BS)toaterminaloccuroveranumberofhops,where
devices other than base stations/access points or end-
user terminals act as repeaters. The repeaters can be user
terminals with a special functionality for relaying messages
in addition to acting as end-user equipment [8–10] (called
Type I multihop in this paper), or they can be devices with
functionality restricted to relaying messages not including
the users (Type II multihop). In Type II multihop, repeaters
can be designed with a simplified functionality, so that their
cost can be significantly less than that of a regular BS or
access point. With this approach and with the capability
of being self-configuring, these relays can be deployed in
an autonomous manner, so that the network infrastructure
grows organically according to the local need for the capacity
increase [11]. Therefore, in this paper, we focus on Type II
multihop cellular networks.
When it comes to the utilized spectrum, multihop
cellular networks fall into two main categories: (i) the
repeaters can be designed to receive and transmit on the
regular frequency division duplex (FDD) bands of a cellular
system with the possible use of a time slot scheduling
structure such that where repeaters receive in even numbered
slots and transmit in odd numbered slots or (ii) an
additional frequency band can be allocated for the use of
transmissions from BSs to the repeaters and also for repeater-
to-repeater transmissions. We refer to transmissions directed
to repeaters, whether from the BS or from another repeater,
2 EURASIP Journal on Advances in Signal Processing
as the forwarding traffic. We also refer to the transmission
on the regular FDD bands as in-band forwarding, and the
transmission on an additional unlicensed band as out-of-
band forwarding. In-band forwarding is normally used in
TypeImultihopnetworks[12],whereasinTypeIImultihop
networks, out-of-band forwarding is preferred. This is due to
the fact that with in-band forwarding, the multihop structure
results in a traffic bottleneck at the BS and at repeaters that
are in the first hop. With out-of-band forwarding, which is
the focus of this paper, the added spectrum alleviates this
bottleneck problem and results in a much larger capacity per
BS. The out-of-band approach also has the attractive feature
that all terminals can be legacy terminals. With the proper
design of the repeaters, the legacy terminals can easily operate
in the multihop cellular network using the same protocols
used in the single-hop cellular networks. In other words, the
multihop architecture becomes transparent to the end-user
terminals. In this case, the approach of adding repeaters in an
autonomous manner and in a multihop structure becomes a
scalable capacity enhancing technique for a regular cellular
system.
We refer to the traffic over hops where the destination
is an end-user terminal as access traffic as opposed to the
forwarding traffic referred to above that involves a repeater
as the receiver. Thus, the forwarding traffic utilizes the out-
of-band spectrum, whereas access traffic utilizes the in-band
spectrum. The out-of-band approach essentially separates
the forwarding and access traffic. In so doing, from the access
traffic standpoint, the repeaters behave as if they are BSs.
In the forward link of wireless systems, a general resource
allocation scheme optimized both in time and frequency
such as the one in next generation network (NGN) can be
considered. Here, without loss of generality, we consider only
a time domain scheduling (TDS) scheme, where over short
time slots, all the transmitted bits are directed to a given
terminal.
In this paper, we propose an architecture for a network
utilizing the out-of-band transmission for the forwarding
traffic along with TDS for the access traffic for the joint
optimization of the degree of the multihop, routing path,
and BS selection to achieve the maximum total throughput in
the system. The architecture under consideration is restricted
to a two-BS two-relay system in two adjacent sectors facing
each other. Although this model seems limited in scope,
studying the resource allocation in this context allows us to
derive a significant insight into the network performance
behavior with respect to some key parameters of interest.
Moreover, this model can be extended to either the case
where the adjacent sectors within a cell are involved in the
resource allocation or the intrasector cooperation where all
BSs and relays within a two-tier hexagonal cell configuration
are considered together.
Multihop cellular systems have been proposed in [1–
3, 8, 13]. These systems have been shown to both improve
the throughput and reduce the required total transmission
power. However, there have been only few results clarifying
how the self-configuring feature can improve the system
capacity. Most current routing algorithms for multihop
cellular systems [8, 9, 14] use path loss between terminals
BW
1
BW
2
BW
2
BW
2
BW
1
Base station
Relay
User
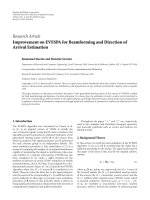
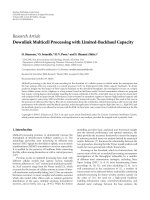
Figure 1: The proposed system model for the scalable self-
configuring networks.
and transmitters as a metric to determine the routing.
Although these approaches are easy to implement, they are
not optimal and cannot manage the congested areas or cells.
The proposed routing algorithm in [15] is based on the
receiver interference, but the underlying proposed scheme
does not optimize the total achieved network throughput. A
centralized eigenvalue-based routing algorithm for multihop
cellular networks is presented in [13]. Regardless of the
substantial disparities in the system topology, the objective
is to balance between signal to interference plus noise ratio
(SINR) and the total network power consumption. Although
[3] addressed the capacity of the multihop relaying with
nonuniform traffic, the topology and the routing issues are
not addressed in [3]. In [16], a multiple-layer access network
that uses the hierarchical routing is proposed, which leads to
a low-power architecture for the uplink transmission.
2. System Model
We consider a two-tier hexagonal cell configuration. Each cell
has a specific geographical coverage area, which is divided
to six sectors. The multihop system under consideration is
realized by the insertion of one relay in each sector of a
BS. Our proposed scalable network architecture is shown
in Figure 1. There are three main elements in the network
meaning: BSs, relays, and the users. Thus, there are three
possible links between the BS and relays and terminals. Since
the insertion of the relays should be transparent to users,
the transmission from the relays and BSs to the users (access
traffic) needs to be on the same frequency band, denoted by
f
2
in Figure 1. In fact, the insertion of relays does not make
any change to the network from the users’ point of view.
However, as justified in the introduction, the transmission
from the BSs to the relays or between two relays (forwarding
traffic) is of a different frequency band (BW
1
) from the one
used by the users in the cellular network (BW
2
). This might
be from an unlicensed frequency band, which makes them
able to receive and transmit at the same time. This makes the
architecture scalable as any other relay can be inserted in the
system without any variation in the system topology.
EURASIP Journal on Advances in Signal Processing 3
1
k
12
k
2
k
21
k
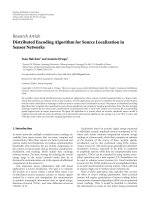
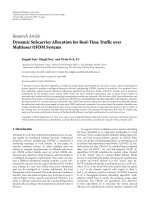
Figure 2: Two-BS two-relay system configuration.
In this paper, without loss of generality and for quan-
titative analysis of the system, we assume that each BS
can coordinate only with its six neighboring BSs, and the
maximum allowable number of hops is two. The system is
shown in Figure 2, which shows two BS sectors facing each
other. Therefore, in a two-BS two-relay system, there are four
transmitters i
= 1,2,3, 4, where i = 1(2) corresponds to the
BS 1(2), and i
= 3(4) denotes the relay 1(2), respectively.
The fast power control, compensating the fast fading, is
assumed to be done by its corresponding mechanism, and
the open-loop power control, compensating the slow fading
or shadowing, is performed every T
w
seconds. Note that
different maximum power constraints for BSs and relays are
considered. We assume that each user j has a required aver-
age data rate (
R
j
). Our proposed scheme for the routing and
resource allocation is performed every T
w
seconds, which
is the length of a frame in time. The typical value of T
w
is
10 milliseconds in the universal mobile telecommunications
system (UMTS) [17]. The proposed scheme in this paper can
be thought of as a scheduler, determining the set of users that
should be served within each time slot. Considering the TDS
scheme, each user in the set is served within a fraction of the
whole period by the maximum BS transmit power.
3. Problem Definition
Our main objective in this paper is to maximize the total
network throughput in a multihop cellular system, while
considering the power constraints of BSs and relays. In fact,
to maximize the total network throughput, the optimum
set of users and their corresponding routes to connect to
the system should be determined. We assume that users do
not have any limitation on their maximum received data
rate, and the buffer size of relays is large enough. Based on
the system in Figure 2, only two BSs, corresponding to two
neighboring sectors, are involved in the resource allocation
independent of the others. We assume that each relay covers
p (0
≤ p ≤ 100) percentage of its corresponding sector area.
The resource allocation problem is solved for a snapshot of
the network whose length is T
w
seconds, so all the parameters
defined hereafter belong to a snapshot of the system. Let us
assume that there are N users in the system and let R
T
denote
the system total achieved rate vector with a 1
× (N +4)
matrix as R
T
= [r
1
, r
2
, r
3
, r
4
, r
5
, , r
N+4
], where r
1
, r
2
, r
3
,
r
4
are the allocated rates of the first BS, second BS, first
relay, and second relay, respectively. The rest of the elements,
r
5
, , r
N+4
, represent the rates of the users. The elements of
R
T
are positive if they represent the received rate and are
negative if they show the transmitted rate. Due to the system’s
assumptions, r
i
> 0fori = 5, , N + 4, as users cannot
forward the access traffic to the others (Type II multihop).
Definition 1. V
i,j
is a base vector whose ith element is −1and
its jth element is +1 and all the other elements are zero. (e.g.,
V
1,3
= [−1, 0, 1, 0, , 0] means that BS 1 transmits and relay
1 receives).
Definition 2. Ve c t o r R
T
defined above is a system rate vector
if and only if it can be written as a linear combination of
V
1,j
j ∈{3,5, , N +4}, V
2,j
j ∈{4, , N +4}, V
3,j
j ∈
{
4, , N +4},orV
4,j
j ∈{3,5, , N +4} with positive
coefficients.
In fact, R
T
simply represents the case, where every
transmitter sends to only one receiver at each time slot
(TDS). Here, the BSs are the transmitters, relays can be either
transmitters or receivers, and the mobiles are always the
receivers. Let R denote the optimal rate allocation vector at
a specific time slot for a set of two neighboring sectors. Thus,
given the time slot length, T
w
, the optimal data allocation
vector would be RT
w
. Since R is a system’s total achieved
rate vector, based on the definition of R
T
,itcanbewritten
as R
= [−R
T1
, −R
T2
,0,0,R
1
, R
2
, , R
N
], where R
T1
,and
R
T2
represent the total allocated data rate by BS 1 and 2,
respectively. Moreover, R
1
, , R
N
denote the total received
data rate of N users. This means that the total amount
of transmitted and received data by relays are the same.
Therefore, no data is buffered in relays at the end of each time
slot (two zeros in the matrix). Note that no data buffering
means that no data is buffered once the current time slot is
over (i.e., at the end of each T
w
seconds, the relays are empty).
However, data can be buffered in a relay during this period
and be sent at the proper time before the time expires. Using
the definition of the system’s rate vector (R) and the fact
that the transmission at this rate happens during T
w
seconds,
the total system’s transmitted data vector can be written as
follows:
RT
w
=
N+4
j=5
τ
1j
R
1j
V
1,j
+ τ
2j
R
2j
V
2,j
+ τ
3j
R
3j
(V
1,3
+ V
3,j
)
+ τ
4j
R
4j
(V
2,4
+ V
4,j
)
+ τ
5j
R
3j
(V
2,4
+ V
4,3
+ V
3,j
)
+ τ
6j
R
4j
(V
1,3
+ V
3,4
+ V
4,j
)
,
(1)
where R
ij
is the maximum data rate that transmitter i (a BS
or relay) can transmit to the receiver j (users) while using
its total allowable power, determined based on the hardware
limitations. Moreover, τ
ij
,(τ
ij
≥ 0, ∀i, j) is the required
time that transmitter i has to consume to be able to support
the average required data rate to user j while transmitting by
the maximum rate R
ij
. Since each user j is assumed to have a
required average rate
R
j
, its serving time, τ
ij
, should be large
enough to be able to support this amount of data. Finally, τ
5j
and τ
6j
represent the amount of time during which relays 1
and 2 transmit the packets that are to be transmitted by two
4 EURASIP Journal on Advances in Signal Processing
hops, respectively (Figure 3). The first (second) term in the
above summation is corresponding to the case that user j is
served by BS 1(2), while the third (fourth) term corresponds
to the case where user j is served by BS 1(2) via relay 1(2).
The last two terms are the cases where user j is served by BS
1(2) via two hops, respectively.
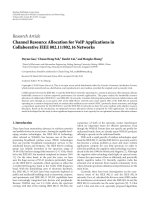
Because there is no diversity in the system, for each
user, only one of the above terms is nonzero meaning that
a user is served by a specific route at each time slot. This
route determines the set of transmitters that are involved in
forwarding the packets of that user and is fixed during each
T
w
seconds. Therefore, the nonzero term determines both
the transmitter to which the user is connected to and the
routing path through which the packets are being forwarded.
For instance, τ
1j
/
=0 means that user j is served by BS 1
directly; τ
3j
/
=0 means that user j gets its packets from BS
1afterbeingforwardedtorelay1;finally,τ
6j
/
=0 means that
packets of user j areforwardedfromBS1torelay1thento
relay 2 and eventually to user j, (see Figure 3 for all possible
combinations).
The total power of BSs, P
BS
, is higher than that of relays,
P
RLY
(e.g., in our simulations, we used P
BS
= LP
RLY
,where
L
= 5). This is because the relays are usually much smaller
and less costly than BSs and can be deployed more easily at
the required locations. Based on this fact and the location of
BSs and relays (Figure 2), which is assumed to be symmetric,
we can conclude that R
13
∼
=
R
24
>R
34
= R
43
.Ourobjective
is to maximize the total downlink throughput in the set of
two neighboring BSs, which leads to a suboptimal solution
for the whole system. Therefore, using (1), the problem can
be written as the following optimization problem:
max
τ
ij
N+4
j=5
(τ
1j
R
1j
+ τ
2j
R
2j
+(τ
3j
+ τ
5j
)R
3j
+(τ
4j
+ τ
6j
)R
4j
)
(2)
s.t.
N+4
j=5
τ
1j
+
τ
3j
R
3j
+ τ
6j
R
4j
R
13
≤
T
w
,
(3)
N+4
j=5
τ
2j
+
τ
4j
R
4j
+ τ
5j
R
3j
R
24
≤
T
w
,
(4)
N+4
j=5
τ
3j
+ τ
5j
+
τ
6j
R
4j
R
34
≤
T
w
,
(5)
N+4
j=5
τ
4j
+ τ
6j
+
τ
5j
R
3j
R
34
≤
T
w
.
(6)
(Note that the above optimization problem can be general-
ized by considering a weighted summation. This would not
change the problem formulation as the proposed suboptimal
framework can also be extended in that case. In other
words, the proposed scheme can be applied to any arbitrary
weighted summation with different coefficients, appearing
in the problem constraints in (3)–(6). Conceptually, the
introduction of the weights can be used to achieve fairness,
prioritize users, or optimize a more general cost function.
However, in this paper, the total achieved throughput is the
objective cost function.)
The summation in (2) represents the total forwarded
data to all the users during a time slot (e.g.,
N+4
j
=5
τ
1j
R
1j
denotes the total amount of data that is sent by BS 1). The
constraints in (3)–(6) represent the time limitations during
each time slot for BS 1, BS 2, relay 1, and relay 2, respectively.
This implies that the total allocated time by a transmitter
should be equal or less than the length of a time slot, T
w
.
For instance, the first term in (3) denotes the required time
to support user j when it is assigned directly to BS 1. The
second term is the amount of time that BS 1 should spend
in order to support user j via relay 1, and finally, the last
term corresponds to the amount of allocated time of BS 1
to support user j via relay 1 and then relay 2, respectively. We
assume that relays can transmit and receive at the same time,
and τ
ij
is normalized by T
w
or simply T
w
= 1.
The optimization problem in (2) along with the con-
straints in (3)–(6) is NP-hard. Moreover, there is a depen-
dency between the constraints in (3)–(6). Using an adaptive
scheme proposed in Section 5, which converts the above
four dependent constraints into six independent constraints,
it is possible to map the above problem to a multidimen-
sional multichoice knapsack problem (MMKP) (Section 4).
Although MMKP is NP-hard, there are polynomial-time
heuristic algorithms to solve it [18, 19]. In our proposed
adaptive scheme, each BS and relay reserves some portion
of its total transmit power for forwarding the trafficof
otherrelaysorBSs.ReferringtoFigure 2, we assume that
BS 1 reserves k
1
P
BS
for serving the packets that should
be forwarded via relay 1. Relay 1 also reserves k
12
P
RLY
for
forwarding the packets that should be transmitted via relay 2.
These packets are transmitted by two hops. The same thing
applies to relay 2 and BS 2. We represent the reserved power
of relay 2 and BS 2 by k
21
P
RLY
and k
2
P
BS
,respectively.The
values of k
1
, k
2
, k
12
, k
21
, all less than 1, are adjusted every
time slot based on the traffic profile of the BSs and relays
so as to make the traffic load as much balanced as possible.
In this paper, we refer to them simply as “k parameters.” In
brief, the proposed adaptive scheme makes the constraints
independent resulting in a balanced traffic load by adjusting
the values of k parameters. The details will be described in
Section 5.
4. Mapping the Problem to MMKP
Using the adaptive scheme, we show that the optimization
problem in (2) can be mapped to an MMKP.
Proposition 1. Using the proposed adaptive scheme, the
constraints in (3)–(6) can be written as
N+4
j=5
τ
1j
≤ 1 −k
1
,
(7a)
N+4
j=5
τ
2j
≤ 1 −k
2
,
(7b)
EURASIP Journal on Advances in Signal Processing 5
(a) (c) (e)
(f)(d)(b)
τ
1j
= 0 τ
3j
= 0 τ
6j
= 0
τ
2j
= 0 τ
4j
= 0 τ
5j
= 0
Figure 3: Possible routing paths for an arbitrary mobile within the network.
N+4
j=5
τ
3j
R
3j
≤ k
1
R
13
−k
12
R
34
,
(8)
N+4
j=5
τ
4j
R
4j
≤ k
2
R
24
−k
21
R
43
,
(9)
N+4
j=5
τ
5j
R
3j
≤ k
21
R
34
,
(10a)
N+4
j=5
τ
6j
R
4j
≤ k
12
R
43
.
(10b)
Proof. See Appendix A.
Inequalities (7a)–(10b) are conceptually related to the
different possible routing scenarios shown in Figures 3(a)–
3(f). Although these inequalities are time-based constraints,
considering the TDS system, they also have power-based
interpretations. In the time domain scheduling, during
each time interval, the total power is allocated to a single
user, while the rest of the users are inactive. The required
time interval (τ
1j
, τ
2j
, ) is inversely proportional to the
maximum deliverable data rate (R
ij
) in the TDS mode, and
R
ij
is proportional to the total available transmit power.
Therefore, more available power means smaller required
time interval to serve a specific user. Thus, the available
resource can be thought as either the time or power. For
example, constraints in (7a)and(7b) are related to the
maximum power limits of BSs 1 and 2, considering the
reserved portion for the packet forwarding to relays 1 and
2, respectively. The constraint in (8) takes into account the
limitation on the transmitted power of the relay 1, which is
limited by the amount of power assigned to it by BS 1 (k
1
P
BS
)
minus the portion of its power reserved for relay 2 (k
12
P
RLY
).
Inequality (9) is the same constraint as (8)butforrelay2.
Finally, constraints in (10a)and(10b) show the limitation on
the amount of data that can be sent by each BS by forwarding
via two relays due to the limited amount of allocated power
for this purpose by relays (k
21
P
RLY
and k
12
P
RLY
).Thevaluesof
k
1
, k
2
, k
12
, k
21
should be adjusted based on the trafficofBSs
and relays. Note that the k parameters should be chosen such
that k
1
R
13
− k
12
R
34
≥ 0andk
2
R
24
− k
21
R
43
≥ 0. These two
conditions correspond to the right hand-side of inequalities
in (8)and(9) meaning that relays cannot forward more than
the amount that is allocated by BSs. The constraints in (7a)–
(10b)canberepresentedinageneralformof
N+4
j=5
a
ij
x
j
≤ C
i
for all i ∈{1, ,6},wherex
j
is 1 when user j is assigned to
the network and 0 otherwise,
a
ij
=
⎧
⎪
⎪
⎪
⎪
⎪
⎪
⎨
⎪
⎪
⎪
⎪
⎪
⎪
⎩
τ
ij
if i = 1, 2,
τ
ij
R
ij
if i = 3, 4,
τ
5j
R
3j
if i = 5,
τ
6j
R
4j
if i = 6,
(11)
C
i
= (1 − k
1
), (1 − k
2
), (k
1
R
13
− k
12
R
34
), (k
2
R
24
−
k
21
R
43
), (k
21
R
34
), and (k
12
R
43
)fori = 1, ,6,respectively.
Assignment of a user to the network implies that the user is
being served during the current time slot.
Using Proposition 1, the optimization problem in (2)
along with its constraints (7a)–(10b) can be mapped to an
MMKP, an extended version of Knapsack problem (KP). In
MMKP, there is an M-dimensional knapsack with M total
allowable volumes of W
1
, W
2
, , W
M
. Furthermore, there
are N groups of items. Group j has n
j
items. Each item
has a value and an M-dimensional volume corresponding to
knapsack’s M dimensions. The objective of the MMKP is to
pick up exactly one item from each group to maximize the
total value of the selected items, which subject to the volume
constraints of knapsack’s dimensions.
The mapping of (2) to an MMKP is as follows. We
consider M knapsacks (here M
= 6) presented by (7a)–
(10b) plus an auxiliary knapsack as “one knapsack”with
M + 1 dimensions, where the total allowable volume of
dimension i is C
i
.Moreover,C
M+1
corresponding to the
resource constraint of auxiliary knapsack is set to zero. Each
6 EURASIP Journal on Advances in Signal Processing
user is considered as a group, which has n
j
(here M +1)
items. All items of user j except the (M +1)thitemhavean
equal value, which is the average required rate of that user.
The value of the last item is always zero. The kth item of jth
user requires an M-dimensional volume, which is defined as
A
ijk
= a
ij
if i = k
/
=M + 1 and zero otherwise.
This ensures that item k of any group, that corresponds
to knapsack k, can only be assigned to knapsack k. Therefore,
if item
k of group j is selected in the optimal solution, it
means that user j has been assigned to the knapsack
k,its
corresponding achieved throughput is
R
j
, and the amount of
resource it requires from the knapsack
k is a
k
j
.Wehaveto
choose exactly one item from each group meaning that each
user can be assigned to at most one knapsack. On the other
hand, by the definition of MMKP, we have to choose exactly
one item from each group. However, the selection of all users
is not feasible at all the times. Therefore, if user j does not
exist in the optimal solution, it means that its last item whose
corresponding value and volumes are zero has been selected.
This indirectly implies that user j has not been assigned to
the network.
Based on the above discussion, we can rewrite the
optimization problem using (2)andA
ijk
as
max
x
kj
N
j=1
M+1
k=1
x
kj
R
j
, (12)
s.t.
N
j=1
M+1
k=1
x
kj
A
ijk
≤ C
i
∀i ∈{1, , M}, (13)
M+1
k=1
x
kj
= 1 ∀j ∈{1, , N}, x
kj
∈{0, 1}, (14)
where x
kj
is one when the item k of user j is selected.
Because of the NP-hardness of the MMKP, exhaustive
search algorithms such as branch-and-bound [20]with
the globally optimal solutions are too time-consuming and
can only be applied to the very small problems. The
computational complexity of these algorithms is O(2
M
2
N
).
However, several heuristic algorithms have been proposed
such as those in [18, 19], which are polynomial-time
suboptimal algorithms. In this paper, we use the modified
version of the algorithm presented in [18],whichisbasedon
the Lagrange multipliers. Numerical results comparing the
performance of the suboptimal methods, and the branch-
and-boundmethod(Section 6) justifies the use of this
heuristic algorithm. Here, for brevity of the discussion, we
briefly outline the theory of Lagrange multipliers and the
algorithm used to solve the MMKP based on the current
notations in this section.
Theorem 1. Let λ
1
, λ
2
, , λ
M
be M nonnegative Lagrange
multipliers, and let x
∗
kj
be the solution of
max
x
kj
N
j=1
M
k=1
x
kj
R
j
−
M
i=1
λ
i
N
j=1
M+1
k=1
x
kj
A
ijk
. (15)
Then, the binary variables x
∗
kj
are also the solution to
max
x
kj
N
j=1
M
k=1
x
kj
R
j
, x
kj
∈{0, 1}, (16)
N
j=1
M+1
k=1
x
kj
A
ijk
≤
N
j=1
M+1
k=1
x
∗
kj
A
ijk,
∀i ∈{1, , M}. (17)
Proof. See [21].
According to this theorem, the solution to the uncon-
strained optimization problem (15) is also the solution
to the constraint optimization problem (16), which is the
MMKP in (13) with the constraint values C
i
replaced by
N
j=1
M+1
k=1
x
∗
kj
A
ijk
. Therefore, if the multipliers λ
i
are known,
the optimization problem is easily solved. This is because that
(15)canbewrittenas
max
x
kj
N
j=1
M
k=1
R
j
−
M
i=1
λ
i
A
ijk
x
kj
, (18)
which implies that the solutions are
x
∗
kj
=
⎧
⎪
⎪
⎨
⎪
⎪
⎩
1ifR
j
−
M
i=1
λ
i
A
ijk
> 0,
0, otherwise.
(19)
Therefore, the only step to do is to compute the Lagrange
multipliers λ
i
. It is worth noting that if these multipliers
be computed such that the terms C
i
−
N
j
=1
M
k
=1
x
∗
kj
A
ijk
are nonnegative, the solution is feasible. The heuristic algo-
rithm based on the Lagrange multipliers, which produces
suboptimal values for λ
i
and x
kj
simultaneously is shown
in Algorithm 1. The algorithm starts with the most valuable
item of each user j as the selected item (
K
j
), and the Lagrange
multipliers initialized to zero such that the constraints in
(14)and(19) are satisfied. In general, however, the volume
constraints will now be violated. The initial choice of the
selected items is revised to obey the volume constraints
by repeatedly improving the most violated constraint,
I,
as shown in Algorithm 1.
Consider the users whose selected items correspond to
the BS
I (i.e., {j |
K
j
=
I}). For each item k of these users,
the increase Δ
kj
in multiplier λ
I
that results from exchanging
the selected item of group j is computed. Eventually, the item
K
∗
of user J
∗
, causing the least increase of multiplier λ
I
,is
chosen for exchange. This choice minimizes the widening of
the gap between the optimal solution characterized by C
i
−
N
j
=1
M
k
=1
x
∗
kj
A
ijk
and the solution returned by the MMKP
algorithm. The process is repeated until for each user an
item has been selected such that the volume constraints are
satisfied. Since each user has always an item whose value
and the M-dimension volume is zero, the solution is always
feasible.
After completion of DROP phase, there may be some
space left in the knapsack. This space may be utilized
to improve the solution by replacing some selected items
EURASIP Journal on Advances in Signal Processing 7
I. INITIALIZATION
step 1.λ
i
←− 0 ∀i = 1, , M;
step 2.A
ijk
←− A
ijk
/C
i
∀j = 1, ,N; ∀k = 1, ,n
j
;
step 3.
K
j
= arg max
k
(R
kj
)andx
k
j
j
←− 1 ∀j = 1, , N;
step 4.T
i
←−
N
j
=1
A
ij
K
j
∀i = 1, , M;
II. DROP PHASE
While (T
i
> 1foranyi)do
step 5.
I = arg max
i
{T
i
}
step 6.
For
{j |
K
j
=
I}
For k = 1:M
Δ
kj
←− (R
Ij
−R
kj
−λ
I
(A
Ij
I
−A
kjk
))/A
Ij
I
end
end
K
∗
J
∗
= arg min
kj
{Δ
kj
}∀j, k
step 7.λ
I
←− λ
I
+ Δ
K
∗
J
∗
x
K
J
∗
J
∗
←− 0
x
K
∗
J
∗
←− 1 (i.e.,
K
J
∗
←− K
∗
)
T
I
←− T
I
−A
IJ
∗
I
T
K
∗
←− T
K
∗
−A
K
∗
J
∗
K
∗
end
III. ADD PHASE
While more items can be exchanged
step 8.
For j
= 1:N
For k
= 1:M +1
μ
kj
=
⎧
⎨
⎩
R
kj
−R
K
j
j
if R
kj
−R
K
j
j
> 0&T
k
+ A
kjk
≤ 1
0o.w.
end
end
step 9.K
J
= arg max
kj
{μ
kj
}∀j, k
step 10.T
k
J
←− T
K
J
−A
K
J
J
K
J
T
K
←− T
K
+ A
K
J
K
x
K
J
J
←− 0
x
K
J
←− 1 (i.e.,
K
J
←− K
)
end
Algorithm 1: MMKP algorithm for resource allocation in multi-
hop cellular.
with more valuable ones. Therefore, in ADD phase of the
algorithm, each item k of every user j is checked against the
selected item of that user (
K
j
). It is tested to see if item k
is more valuable than the selected item and if k can replace
the selected item without violating the volume constraints.
Among all exchangeable items, the item K
of user J
causing
the largest increase of the knapsack value is exchanged with
the selected item of that user (
K
J
). This process is repeated
until no more exchanges are possible. The resulting solution
comprised of the selected items is feasible, and even optimal,
if
N
j
=1
(λ
i
C
i
−
N
j
=1
M
k
=1
x
∗
kj
A
ijk
) = 0.
Note that due to the equality between the values of
different items of each user j,
R
j
, except its last item, we have
to make a tiny modification to be able to apply the algorithm.
One simple way would be adding a very small value but
different to every item of a user. The last item should be
kept zero. Let us denote the value of kth item of jth user by
R
kj
= R
j
+ ε
kj
for k ∈{1, , M},whereε
kj
is a very small
value (e.g., ε
kj
= 0.01 in our simulations) but different for
every item of a user. This modification is necessary when we
are calculating the amount of increasing Δ
kj
of the Lagrange
multiplier corresponding to the most violated constraint,
I,
in Drop phase of the algorithm.
Theorem 2. The maximum difference between the total
achieved throughput using the above suboptimal algorithm and
the globally optimal solution is
M
i=1
λ
i
(C
i
−
N
j=1
M+1
k=1
x
∗
kj
A
ijk
),
where x
∗
kj
is the output of the heuristic algorithm.
Proof. See Appendix B.
Based on Theorem 2, the solution is optimal if
M
i=1
λ
i
(C
i
−
N
j=1
M+1
k=1
x
∗
kj
A
ijk
) = 0 (i.e., the case whereby
error is zero). Numerical results in Section 6 show that most
of the times of this gap is negligible. Therefore, the result is a
good approximation of the globally optimal solution.
4.1. Computational Complexity. The following proposition
indicates that the proposed algorithm has a polynomial-time
computational complexity.
Proposition 2. The heuristic algorithm proposed in
Algorithm 1 has a maximum computat ional complexity
of O(N
2
M
3
).
Proof. Step 1 has the complexity order of O(M), and step 2
to step 4 have the complexity order of O(NM). In the
while loop, step 5 and step 7 have the complexity order
of O(M)andO(1), respectively. In step 6 for each of N
users, there are at most M nonselected routing paths, thus
for each user, the maximum complexity order is M. Since
there is one iteration for each potential path associated with
each user, the total complexity order of step 6 is O(NM
2
).
In every iteration of step 6, one assigned path is removed
from one user, thus, in the worst case, the while loop in the
DROP phase is executed NM times. Therefore, the overall
complexity order for the execution of the while loop of the
DROP phase is O(N
2
M
3
), where we also assume that N
M. In the ADD phase, the complexity order of step 9 and
step 10 is O(NM)andO(1), respectively. In step 8,for
each of the N users, at most M nonselected paths at most are
considered. Each computation has a complexity of M.There
is one iteration for each knapsack, resulting in the complexity
order of O(NM
2
)forstep 8. Since for each user there are, at
most, M potential knapsacks, which could have higher rate
than the assigned one, the outer while loop of the ADD phase
algorithm is executed at most NMtimes. This gives an overall
complexity of O(N
2
M
3
) for the ADD phase. Thus, the overall
computational complexity is O(N
2
M
3
).
5. Adaptive Scheme to Adjust k Parameters
In this section, we propose a scheme for adjusting
k parameters to make the resource allocation scheme
8 EURASIP Journal on Advances in Signal Processing
Table 1: Adjustment of the k parameters.
Two highest Qkvalues adjustments
Q
1
(Q
3
or Q
5
) k
1
↓ k
12
↓ k
2
↑ k
21
↑
Q
1
(Q
4
or Q
6
) k
1
↓ k
12
↑ k
2
↑ k
21
↓
Q
1
Q
2
k
1
↓ k
12
↑ k
2
↓ k
21
↓
Q
2
(Q
3
or Q
5
) k
1
↑ k
12
↓ k
2
↓ k
21
↑
Q
2
(Q
4
or Q
6
) k
1
↑ k
12
↑ k
2
↓ k
21
↓
(Q
4
or Q
6
)(Q
3
or Q
5
) k
1
↑ k
12
↓ k
2
↑ k
21
↓
self-adaptive to the system’s trafficprofile.Theideaof
adjusting the values of k parameters comes from the fact that
the maximum utilization of resources is obtained when there
is cooperation between transmitters (BSs and relays). Let us
assume that at time slot n
− 1, we have solved the problem
(12) with constraints in (13)-(14). Thus, we know the best
suboptimal assignments of users to the relays and BSs at this
time slot. Based on the given assignments, we can define the
infeasibility factors. The infeasibility factor of transmitter i at
time slot n is defined as
Q
i
(n) =
N+4
j=5
a
ij
(n)x
j
(n)
C
i
, (20)
which represents the ratio of the amount of the allocated
resource to the available resource of transmitter i at time slot
n. Remember that i
= 1(2) corresponds to BS 1(2), i = 3, 5
denotes the relay 1, and i
= 4,6 corresponds to the relay 2.
Parameter Q
i
(n) shows the amount of the allocated resource
of the knapsack i at time slot n. Based on these infeasibility
factors at each time slot, we can decide on the values of k
parameters in the next time slot. One can think of step-based
variations in which, at each time slot, the k parameters are
increased or decreased by a specific predetermined value,
which is the strategy used in our simulations. Ta bl e 1 shows
all the different possible scenarios and their corresponding
actions that need to be taken. The tables shows the two
highest infeasibility factors as the base of the decision. For
instance, if Q
1
and Q
3
are the two highest factors, the value
of the k
1
should be decreased to release more resources to
the BS1. At the same time k
12
should be reduced to give more
resources to relay 1. On the other side k
2
and k
21
may increase
to take care of the possible overload of BS1 and relay1. The
other scenarios can be explained in the same way.
6. Simulation Results
We consider a two-tier hexagonal cell configuration with
a wrap-around technique. A universal mobile telecommu-
nication system, with a fast power controller running at
1500 updates per second, is simulated. The total number
of 19 cells with cell radius 1000 m and BTS transmit power
of 10 W were considered. Moreover, the required E/I for
users is
−13 dB, thermal noise density is −174 dBm/Hz, and
propagationlossexponentis4.Wefocusonthecentralcellas
the BS 1 and one of its neighbors as the BS 2 along with their
0.9
0.95
1
1.05
1.1
1.15
1.2
1.25
1.3
1.35
1.4
Total throughput ratio in BS one
0.10.20.30.40.50.60.70.8
Distance of vertex of sub-cell to the boundary of BS (R
c
)
k
1
= 0.1, k
2
= 0.3
k
1
= 0.25, k
2
= 0.3
k
1
= 0.35, k
2
= 0.3
k
1
= 0.25, k
2
= 0.4
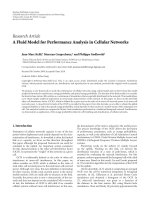
Figure 4: The ratio of the achieved throughput with relaying to the
case without relaying in BS 1 versus the distance of the subcell to the
BS for different values of k
1
.
corresponding sectors. Hereafter, we call them couple BSs and
couple sectors,respectively.
6.1. Throughput Versus Relay Location. First, we consider a
two-BS two-relay set including the neighboring sectors of BS
1 and BS 2 with 70 users distributed nonuniformly through
the BSs’ coverage area as follows. Ten users were distributed
randomly and uniformly throughout both cells (BS 1 and
BS 2). Then, 60 users were distributed nonuniformly in BS
1 within a small hexagonal, called subcell, with radius R
c
/10,
where R
c
is the radius of the cells. The maximum number
of intermediate relays was set to 1. The distance of subcell
to BS is changed from 9R
c
/10 to 2R
c
/10. The ratio of the
achieved throughput in cell 1 for the case with relays to the
case without relays for different values of k parameters is
shown in Figure 4. In this case, we set k
12
= k
21
= 0(i.e.,
at most one relaying), k
2
= 0.3 and we changed the value of
k
1
. It is seen that when users are on the cell boundaries, our
scheme outperforms greatly the case with no relays. However,
by approaching the users toward the BS, our scheme’s result
approaches to the case where there is no relay, which is
expected. The reason is that for users that are closer to the
BS the chance of relaying is small. This concept is seen for
the case where the distance between the center of the sub-
cell and the BS 1 is less than 0.5R
c
. Moreover, if the sub-
cell approaches further to the BS, the result is degenerated
and gets even worse than the case with no relays. The reason
is that, in this case, the BS allocates a special portion of its
power to the relay, which has a tiny role in supporting the
users that are close to the BS. Therefore, the higher the value
of k
1
, the worse the results. This result indirectly implies
the fact that the k parameters (k
1
here) should be adjusted
properly based on the load of every transmitter and the traffic
pattern of the users. Moreover, the ratio of the achieved
throughput for different locations of the sub-cell for the case
where both k
1
and k
2
change is also shown in Figure 4.It
EURASIP Journal on Advances in Signal Processing 9
is seen that the increase in k
2
just affects those cases where
the location of the subcell is close to the cell boundary. The
reason is that by adjusting the k
1
more users are supported
by BS 2 via relay 2.
6.2. Intracell Relay ing Versus Intercell Relaying. The ratio of
the total achieved throughput in cell 1 for the case where
there is at most one-relay forwarding option (intra-cell)
to the case with two-relay forwarding (intercell) versus the
location of the sub-cell for different values of k
21
is shown
in Figure 5.Asitisseen,thewholesystemperformanceis
improved. The location of unity gain is also shifted closer to
the BS. As k
21
increases, the result gets better. This is because
some users are supported by BS 2 via relay 2 and then by
relay 1, respectively (i.e., two-relay forwarding). Moreover,
as the subcell approaches further to the BS further this gain
decreases.
6.3. Adaption to the User Topology and Number of Users.
Figure 6 shows the throughput ratio of both cells, defined as
the ratio of transmitted data over the required data versus
the number of users in cell 2, which are distributed within
a subcell under the relay 2. It clearly shows that depends
on the load of the BS 2, different values for k
21
needs to
be used. For example, for 10 users, k
21
= 0.2 is the best
choice, while for 14 users we have to switch to k
21
= 0.4.
In this simulation, the number of users in BS 1 was set to
40, which were distributed uniformly throughout the cell,
k
1
= 0.3, k
12
= 0, and k
2
= 0.3.
Moreover, 60 users were distributed non-uniformly
through the two-BS two-relay set such that half of the
users were located too close to the relay 1. The value of
k parameters was set initially to k
1
= 0.15, k
12
= 0.5,
k
2
= 0.3, and k
21
= 0.1. The variations of these parameters
were investigated in the four consecutive time slots. We
assumed quantized variations where at each time slot, the k
parameters can increase or decrease at most 0.05 of a unit.
The result is shown in Figure 7, where the horizontal axis
shows the time, and the vertical axis shows the k parameters.
Thevaluesofthek parameters were set improperly initially
to be able to see the performance of our adaptive scheme in
conjunction with the knapsack problem. As it was expected,
the values of the k parameters were adaptively adjusted such
that the load becomes balanced between the transmitters.
This means that the BS 1 allocated more power to the relay
1. The values of k
1
and k
12
changed more compared to k
2
and k
21
as they are directly related to the relay 1. Since the
relay 1 is the most congested transmitter almost in all time
slots, based on the adaptive scheme in Section 5, k
1
and k
12
should increase and decrease, respectively, in the consecutive
time slots in order to provide more available resources to the
relay 1.
The ratio of the total achieved throughput with relays to
that of without relays for the above four consecutive time
slots was calculated. The ratio of the achieved throughput
shows an increase from 1.04 at T
= 0 to 1.14, 1.25, 1.31,
and 1.34 at T
= 1, T = 2, T = 3, and T = 4, respectively.
0.9
0.95
1
1.05
1.1
1.15
1.2
1.25
1.3
1.35
1.4
Total throughput ratio in BS one
0.10.20.30.40.50.60.70.8
Distance of vertex of sub-cell to the boundary of BS (R
c
)
k
21
= 0.35
k
21
= 0.2
k
21
= 0
Figure 5: The ratio of the achieved throughput with relaying to
the case without relaying in BS 1 for one-relaying and two-relaying
cases versus the distance of the sub-cell to the BS for different values
of k
21
.
0.3
0.32
0.34
0.36
0.38
0.4
0.42
0.44
0.46
0.48
Aggregate throughput ratio in both base stations
0 5 10 15 20 25 30
Number of users in BS two
k
21
= 0.2
k
21
= 0.4
k
21
= 0.6
k
21
Figure 6: The aggregate throughput ratio in both base-stations
versus the number of added users in BS 2 for different values of k
21
.
This result clearly shows that the adjustment of k parameters
results in a better performance.
Figure 8 shows the variation of infeasibility factors due
to the adjustments of k parameters. The values of these
factors are different at the first time slot because the values
of k parameters are not properly chosen. The difference
in infeasibility factors is translated to difference in the
load levels of knapsacks. By adjusting the k parameters,
however, as it is seen in the figure, the values of infeasibility
factors approach to each other which mean that the load
10 EURASIP Journal on Advances in Signal Processing
0
0.2
0.4
0.6
0.8
1
01234
k
1
0
0.2
0.4
0.6
0.8
1
01234
k
12
0
0.2
0.4
0.6
0.8
1
01234
k
2
0
0.2
0.4
0.6
0.8
1
01234
k
21
Figure 7: The variation of k parameters due to the nonuniform traffic in the central cell.
of knapsacks are shared as much as the system’s topology
permits.
6.4. Relay’s Coverage. We also considered the effect of the
relays’ coverage area on the total achieved throughput in the
central cell. (There is a minimum SINR value required for
each user to decode its data properly. A relay’s coverage is
defined as the area in the cell with an effective received SINR
larger than the threshold value.) Note that if a user is outside
of a relay’s coverage, it means that the data of that user cannot
be forwarded by that relay, meaning that its corresponding
coefficient in (2) is zero. Two cases are investigated, namely,
the limited coverage and the limited capacity scenarios. In the
limited coverage case, the number of users distributed in the
cell is not too much (50 users in our simulation). However,
in the limited capacity case, 100 users were distributed in the
cell boundary. The results for two different cases (k
1
= 0.12
and k
1
= 0.2) are shown in Figure 9.
In the limited coverage case, by increasing the coverage
area of the relays, the total achieved throughput is increased
accordingly. This is because the number of users is not too
much and they can be supported if there is a good coverage in
the system. In other words, the relay’s coverage is the limiting
factor. However, in the limited capacity case, the number of
users is so large that before increasing the coverage of relays
to the maximum, the system reaches the maximum capacity.
This maximum capacity also depends on the value of k
1
,as
shown in Figure 9.
6.5. Complete System Simulati on. Finally, a cellular network
with a two-tier hexagonal cell configuration consisting of
19 cells is simulated. The wrap-around technique is also
employed. Each cell has six sectors, where each sector is in
cooperation with its neighboring sector in the neighboring
cell. The pilot channel power is adjusted so that 40%
of the users receive the pilot channel of the two BSs
with an acceptable quality. The users’ nonuniform spatial
distribution is represented by a nonuniformity factor, χ. This
means that (1
−χ)N users are distributed uniformly, and the
rest of them are distributed in randomly located spots. For
comparison, we consider three different systems. In system
I, there is no relaying in the system, and the routing scheme
is based on a the pilot signal strength, so that the BS with
the greatest E
c
/I
0
is assigned to the user. In system II, the
transmitter assignment is similar to that of system I; while
we consider two relays in the system. Finally, system III
uses our proposed joint rate allocation and routing scheme
considering both BSs and the relays.
The effect of our proposed scheme on the normalized
average achieved throughput is simulated while considering
the nonuniformity factor. Two cases of user spatial distribu-
tions of χ
= 0.2andχ = 0.5 are considered. The simulations
EURASIP Journal on Advances in Signal Processing 11
0.4
0.6
0.8
1
01234
Q
1
0.4
0.6
0.8
1
01234
Q
2
0.4
0.6
0.8
1
01234
Q
3
0.4
0.6
0.8
1
01234
Q
4
0.4
0.6
0.8
1
01234
Q
5
0.4
0.6
0.8
1
01234
Q
6
Figure 8: The variation of the Q factors due to the adjustment of the k parameters.
are executed 1000 times. For simplicity, the average achieved
throughput of systems II and III is normalized by the average
achieved throughput of system I. Figure 10 illustrates the
normalized average achieved throughput versus the average
number of users in each cell. As it can be seen, the average
throughput of system III is larger than that of system II. The
difference between the throughput gains of systems II and
III indicates the gain due to using the MMKP capability to
exploit the local information about the users locations and
channel quality within the system. This gain is increased by
the nonuniformity of the spatial distribution of the users.
6.6. Complexity Analysis. In order to study the run-time
performance of the algorithm, we implemented it along with
the optimal algorithm based on the branch and bound search
using linear programming for the upper bound computa-
tion. We have performed experiments on an extensive set
of the problem sets, where we used randomly generated
MMKP instances for our tests. For each set of parameters
N and M, we run the algorithm ten times and tabulated the
average of the achieved throughput and the execution time.
Ta bl e 2 shows the percentage of the achieved throughput
using our heuristic method compared to the value achieved
in the optimal case. Moreover, the third column of Tabl e 2
shows the required execution time in the heuristic method
compared to that of the branch-and-bound method. It shows
that the performance is really good for the large sets (greater
than 95% most of the time), while the execution time is just
a few percent of the time required for the optimal solution
(less than 5%).
7. Conclusion
A novel modeling for the joint BS/relay assignment, opti-
mum rate allocation, and routing scheme was proposed
and formulated under a single problem for the downlink
multihop cellular networks. The concept of the capacity
regions in the multihop cellular networks was then exploited
to formulate the above problem as an MMKP to maximize
the total achieved throughput in the system. The MMKP
12 EURASIP Journal on Advances in Signal Processing
0.9
0.95
1
1.05
1.1
1.15
1.2
1.25
1.3
1.35
1.4
The ratio of total achieved throughput
with to without relay
00.05 0.10.15 0.20.25 0.30.35
R
c
Capacity limited, k
1
= 0.2
Capacity limited, k
1
= 0.12
Coverage limited, k
1
= 0.12
Coverage limited, k
1
= 0.2
Figure 9: The total achieved throughput with and without relaying
versus the relays’ coverage.
1.8
2
2.2
2.4
2.6
2.8
3
3.2
Normalised average achieved throughput
20 25 30 35 40 45
Averagenumberofuserspercell
System III, χ
= 0.2
System III, χ
= 0.5
System II, χ
= 0.2
System II, χ
= 0.5
χ
= 0.2
χ
= 0.5
Figure 10: The normalized average achieved throughput of systems
III and II versus the average number of users per cell.
algorithm based on the Lagrange multipliers was then
modified to find a near-optimal solution with a linear
complexity. The concept of the infeasibility factor was
introduced to adjust the transmit powers of both the BSs and
relays. In fact, the output of our algorithm is the joint rate
allocation, routing scheme, and BS/relay assignment, which
in conjunction with the proposed adaptive scheme leads to
the implementation of the cell breathing via allocating the
proper transmit powers to the BSs/relays.
Table 2: Performance comparison of Branch-and-bound and a
Heuristic algorithm in terms of total achieved throughput and
execution time.
N Value % Ti me %
40 92.5 15.3
70 95.6 4.2
100 97.3 3.9
130 98.1 2.7
160 97.7 2.7
190 98.1 2.9
220 98.5 3.1
250 98.7 3.1
280 97.5 3.9
310 97.4 3.0
340 98.3 2.4
370 99.3 1.9
400 99.2 2.6
Appendices
A. Proof of Proposition 1
The idea is to make the constraints independent of one
another to be able to formulate the optimization problem
using MMKP. We assume that T
w
= 1. First, let us
consider the constraint (3).TheBS1reservesk
1
portion
of its total resource (time in TDS) for relay 1, meaning
that the remaining resource that can be used for the direct
transmission from BS 1 to the users can be written as
N+4
j
=5
τ
1j
≤ 1 −k
1
, which in turn implies that
N+4
j=5
τ
3j
R
3j
+ τ
6j
R
4j
R
13
≤
k
1
. (A.1)
On the other hand, allocating k
12
P
RLY
of the total power
of the relay 1 to forward the packets to the relay 2 leads to the
following two constraints:
N+4
j=5
τ
6j
R
4j
R
34
≤
k
12
,
(A.2)
N+4
j=5
(τ
3j
+ τ
5j
) ≤ 1 −k
12
,
(A.3)
where (A.2) represents the part of relay 1 resource that is
allocated to relay 2 (remember τ
6j
denotes the required time
to forward the packets from relay 1 to relay 2), and (A.3)
represents the remaining resource for relay 1 to serve the
users (see Figure 3).
The constraints (A.2) along with (A.1)resultin
N+4
j=5
τ
3j
R
3j
R
13
≤
k
1
−
k
12
R
34
R
13
. (A.4)
EURASIP Journal on Advances in Signal Processing 13
Taking the same approach for relay 2, a counterpart
constraint like the one for τ
5j
can be obtained for τ
5j
as
N+4
j=5
τ
5j
R
3j
R
34
≤
k
21
. (A.5)
There are three constraints on τ
3j
and τ
5j,
namely, (A.3),
(A.4), and (A.5). Therefore, we need to prove that (A.4)
and (A.5) are the limiting constraints, meaning that they are
more restrictive than (A.3). To do so, we use the result of the
following proposition.
Proposition 3. Consider two constraints
N
i
=1
x
i
≤ a and
N
i=1
x
i
y
i
≤ b; x
i
, y
i
≥ 0, the second one is more limiting if
and only if 1/y
i
≤ a/b.
Proof. (Let N
= 2, then two constraints are two straight lines
x
1
+ x
2
≤ a and x
1
y
1
+ x
2
y
2
≤ b in the two-dimensional
Euclidean space. The valid values for each constraint are
the area between its corresponding line and the lines x
1
=
0andx
2
= 0. Therefore, the second constraint is more
limiting when its area is a subset of the first one and this
happens when 1/y
1
≤ a/b and 1/y
2
≤ a/b. Similarly, in the
three-dimensional space, x
1
y
1
+ x
2
y
2
+ x
3
y
3
≤ b is more
limiting than x
1
+ x
2
+ x
3
≤ a when the projection of this
plane in each two-dimensional surface composed of (x
1
, x
2
),
(x
1
, x
3
), (x
1
, x
3
) satisfies the conditions like the above, which
leads to 1/y
i
≤ a/b for all i ∈{1, 2, 3}.Thisideacanbe
generalized for N parameters in N-dimensional Euclidean
space accordingly.)
Proposition 4. The constraints in (A.4) and (A.5) are more
restrictive than (A.3).
Proof. Combining (A.4)and(A.5) yields
N+4
j=5
((τ
3j
+
τ
5j
)R
3j
) ≤ k
1
R
13
− k
12
R
34
+ k
21
R
34
. Using Proposition 3,it
is just needed to show that based on the realistic values of the
parameters, the following inequality holds
1
R
3j
≤
(1 −k
12
)
(k
1
R
13
−k
12
R
34
+ k
21
R
34
)
∀j ∈{5, , N +4},
(A.6)
where y
i
= R
3j
, a = (1 − k
12
), and b = (k
1
R
13
− k
12
R
34
+
k
21
R
34
). On the average, the distance of the relay 1 to any of
its users is less than its distance to the relay 2 and BS (about
half). Moreover, the total power of BSs are L times that of the
relays. These all lead to the result that R
3j
∼
=
16R
13
/L,where
16 is the result of the power dissipation with exponent 4, and
the values of k parameters are assumed in average to be 0.4
in our modeling. Therefore, the inequality in (A.6)evaluates
as 1/(16R
13
/L) ≤ 0.6/0.4R
13
, which considering the fact that
L
∼
=
5(Section 3)holdsforallvaluesof j. This means that
constraints in (A.4)and(A.5) are more limiting than (A.3).
B. Proof of Theorem 2
Let us assume X
∗
={x
∗
kj
}is the output of the algorithm, and
Y
∗
={y
∗
kj
} is the result of the globally optimum solution.
Based on the definition in the above algorithm, T
∗
i
=
N
j=1
M+1
k=1
x
∗
kj
A
ijk
. Therefore, the total achieved throughput
using the heuristic algorithm can be written as
N
j=1
M
k=1
x
∗
kj
R
j
=
M
i=1
N
j=1
M+1
k=1
λ
i
x
∗
kj
A
ijk
+
N
j=1
M
k=1
x
∗
kj
R
j
−
M
i=1
N
j=1
M+1
k=1
λ
i
x
∗
kj
A
ijk
+
M
k=1
λ
i
T
∗
i
+
N
j=1
M
k=1
R
j
−
M
i=1
λ
i
A
ijk
x
∗
kj
,
(B.1)
where (B.1) is derived using the fact that A
ijk
= 0ifk = M+1
for all i, j. For the optimal solution, Y
∗
,wecanrewritethe
same expression as in (B.1)as
N
j=1
M
k=1
y
∗
kj
R
j
=
M
k=1
λ
i
T
∗
i
+
N
j=1
M
k=1
R
j
−
M
i=1
λ
i
A
ijk
y
∗
kj
,(B.2)
where T
∗
i
=
N
j=1
M+1
k=1
y
∗
kj
A
ijk
. By definition, T
i
≤ C
i
for all
i. Therefore, the upper limit for (B.2)is
N
j=1
M
k=1
y
∗
kj
R
j
≤
M
k=1
λ
i
C
i
+
N
j=1
M
k=1
R
j
−
M
i=1
λ
i
A
ijk
y
∗
kj
.
(B.3)
Using (B.1)and(B.3), the difference between the total
achieved throughput using the suboptimal algorithm and the
global optimal solution is
N
j=1
M
k=1
R
j
(y
∗
kj
−x
∗
kj
) ≤
M
k=1
λ
i
(C
i
−T
∗
i
)
+
N
j=1
M
k=1
R
j
−
M
i=1
λ
i
A
ijk
y
∗
kj
−
N
j=1
M
k=1
R
j
−
M
i=1
λ
i
A
ijk
x
∗
kj
.
(B.4)
Let us denote the last term in (B.4)asW
=
N
j=1
M
k=1
β
kj
y
∗
kj
−
N
j=1
M
k=1
β
kj
x
∗
kj
,whereβ
kj
= (R
j
−
M
i=1
λ
i
A
ijk
). We define the following sets H
1
= (X
∗
∪Y
∗
) −
Y
∗
, H
2
= (X
∗
∪Y
∗
) −X
∗
,andH
3
= (X
∗
∩Y
∗
).
For the elements of H
3
, it is clear that W is equal
to zero. For the elements of H
1
,
N
j
=1
M
k
=1
β
kj
y
∗
kj
= 0
and
N
j
=1
M
k
=1
β
kj
x
∗
kj
≥ 0, hence W ≤ 0. As for the
elements of H
2
,
N
j=1
M
k=1
β
kj
y
∗
kj
≤ 0 (since β
kj
≤ 0) and
N
j=1
M
k=1
β
kj
x
∗
kj
= 0, thus, again W ≤ 0. Therefore, in all
cases, we have W
≤ 0, which in conjunction with (B.4)leads
to
N
j
=1
M
k
=1
R
j
(y
∗
kj
−x
∗
kj
) ≤
M
k
=1
λ
i
(C
i
−T
∗
i
) =
M
k
=1
λ
i
(C
i
−
N
j=1
M+1
k=1
x
∗
kj
A
ijk
), which completes the proof.
14 EURASIP Journal on Advances in Signal Processing
Acknowledgment
This work was supported by National Sciences and Engineer-
ing Research Council of Canada (NSERC).
References
[1] 3GPP, ODMA, />[2] Y D. Lin and Y C. Hsu, “Multihop cellular: a new architecture
for wireless communications,” in Proceedings of the 19th
Annual Joint Conference of the IEEE Computer and Commu-
nications Societies (INFOCOM ’00), vol. 3, pp. 1273–1282, Tel
Aviv, Israel, March 2000.
[3] H. Wu, C. Qiao, S. De, and O. Tonguz, “Integrated cellular and
ad hoc relaying systems: iCAR,” IEEE Journal on Selected Areas
in Communications, vol. 19, no. 10, pp. 2105–2115, 2001.
[4] M. DeFaria and E. S. Sousa, “Effect of intercell interference on
the SNIR of a multihop cellular network,” in Proceedings of the
61st IEEE Vehicular Technology Conference (VTC ’05), vol. 5,
pp. 3107–3111, Stockholm, Sweden, May-June 2005.
[5] R G. Cheng, S M. Cheng, and P. Lin, “Power-efficient
routing mechanism for ODMA systems,” IEEE Transactions on
Vehicular Technology, vol. 55, no. 4, pp. 1311–1319, 2006.
[6] P. Lin, W R. Lai, and C H. Gan, “Modeling opportunity
driven multiple access in UMTS,” IEEE Transactions on
Wireless Communications, vol. 3, no. 5, pp. 1669–1677, 2004.
[7] T. Rouse, S. McLaughlin, and I. Band, “Congestion-based
routing strategies in multihop TDD-CDMA networks,” IEEE
Journal on Selected Areas in Communications,vol.23,no.3,pp.
668–681, 2005.
[8] V. Sreng, H. Yanikomeroglu, and D. Falconer, “Coverage
enhancement through two-hop relaying in cellular radio
systems,” in Proceedings of the IEEE Wireless Communications
and Networking Conference (WCNC ’02), vol. 2, pp. 881–885,
Orlando, Fla, USA, March 2002.
[9] T. J. Harrold and A. R. Nix, “Intelligent relaying for future
personal communication systems,” in Proceedings of the IEE
Colloquium on Capacity and Range Enhancement Techniques
for the Third Generation Mobile Communications and Beyond,
pp. 1–5, London, UK, February 2000.
[10] J. Sun, “Uplink capacity enhancement in two-hop cellular
networks with limited mobile relays,” in Proceedings of the
15th IEEE Workshop on Local & Metropolitan Area Networks
(LANMAN ’07), pp. 134–138, Princeton, NJ, USA, June 2007.
[11] E. S. Sousa, “Autonomous infrastructure wireless networks,”
in Proceedings of the 16th IST Mobile and Wireless Communi-
cations Summit, pp. 1–5, Budapest, Hungary, July 2007.
[12] K. Navaie and H. Yanikomeroglu, “Multi-user diversity in
multi-hop cellular networks,” in Proceedings of the Canadian
Workshop on Information Theory (CWIT ’05), Montreal,
Canada, June 2005.
[13] K. M. Pepe and B. R. Vojcic, “Cellular multihop networks
and the impact of routing on the SNIR and total power
consumption,” Journal of SPARTA, pp. 1–18, 2002.
[14] T. Rouse, S. McLaughlin, and H. Haas, “Coverage-capacity
analysis of opportunity driven multiple access (ODMA) in
UTRA TDD,” in Proceedings of the 2nd International Confer-
ence on 3G Mobile Communication Technology, pp. 252–256,
London, UK, March 2001.
[15] T. Rouse, I. Band, and S. McLaughlin, “Capacity and power
investigation of opportunity driven multiple access (ODMA)
networks in TDD-CDMA based systems,” in Proceedings of the
IEEE International Conference on Communications (ICC ’02),
vol. 5, pp. 3202–3206, New York, NY, USA, April-May 2002.
[16] H. Lee and C. C. Lee, “An integrated multihop cellular data
network,” in Proceedings of the 58th IEEE Vehicular Technology
Conference (VTC ’03), vol. 4, pp. 2232–2236, Orlando, Fla,
USA, October 2003.
[17] 3GPP, “Opportunity driven multiple access,” Tech. Rep.
TR25.924 v1.0.0, 3GPP, Valbonne, France, 1999.
[18] M. Moser, “An algorithm for the multidimensional multiple-
choice knapsack problem,” IEICE Transactions on Fundamen-
tals of Electronics, Communications and Computer Sciences
, vol.
80, no. 3, pp. 582–589, 1997.
[19] M. Akbar, E. G. Manning, G. C. Shoja, and S. Khan,
“Heuristic solutions for the multiple-choice multi-dimension
knapsack problem,” in Proceedings of International Conferences
on Computational Science (ICCS ’01), pp. 659–668, Stanford,
Calif, USA, May 2001.
[20] W. Shih, “A branch and bound method for the multiconstraint
knapsack problem,” Journal of the Operational Research Soci-
ety, vol. 30, no. 4, pp. 369–378, 1979.
[21] H. Everett III, “Generalized lagrange multiplier method
for solving problems of optimum allocation of resources,”
Operations Research, vol. 11, no. 3, pp. 399–417, 1963.