Báo cáo hóa học: " Research Article Detecting Distributed Network Traffic Anomaly with Network-Wide Correlation Analysis" docx
Bạn đang xem bản rút gọn của tài liệu. Xem và tải ngay bản đầy đủ của tài liệu tại đây (1.29 MB, 11 trang )
Hindawi Publishing Corporation
EURASIP Journal on Advances in Signal Processing
Volume 2009, Article ID 752818, 11 pages
doi:10.1155/2009/752818
Research Article
Detecting Distributed Network Traffic Anomaly with
Network-Wide Correlation Analysis
Li Zonglin, Hu Guangmin, Yao Xingmiao, and Yang Dan
Key Lab of Broadband Optical Fiber Transmission and Communication Networks,
University of Electronic Science and Technology of China (UESTC), Chengdu 610054, China
Correspondence should be addressed to Li Zonglin,
Received 22 October 2007; Accepted 20 August 2008
Recommended by Rocky Chang
Distributed network traffic anomaly refers to a traffic abnormal behavior involving many links of a network and caused by
the same source (e.g., DDoS attack, worm propagation). The anomaly transiting in a single link might be unnoticeable and
hard to detect, while the anomalous aggregation from many links can be prevailing, and does more harm to the networks.
Aiming at the similar features of distributed traffic anomaly on many links, this paper proposes a network-wide detection
method by performing anomalous correlation analysis of traffic signals’ instantaneous parameters. In our method, traffic signals’
instantaneous parameters are firstly computed, and their network-wide anomalous space is then extracted via traffic prediction.
Finally, an anomaly is detected by a global correlation coefficient of anomalous space. Our evaluation using Abilene traffic traces
demonstrates the excellent performance of this approach for distributed traffic anomaly detection.
Copyright © 2009 Li Zonglin et al. This is an open access article distributed under the Creative Commons Attribution License,
which permits unrestricted use, distribution, and reproduction in any medium, provided the original work is properly cited.
1. Introduction
Network traffic anomaly is referred to as a situation such that
traffic deviates from its normal behavior, while distributed
network traffic anomaly is a traffic abnormal behavior
involving multiple links of a network and caused by the same
source. There are many reasons that can cause distributed
network traffic anomaly, such as DDoS attack, flash crowd,
sudden shifts in traffic, worm propagation, network failure,
network outages, and so forth. Any of these anomalies will
seriously impact the performance of network.
Usually, there are not any obvious features of anomalies
in individual links for distributed network traffic anomaly,
that is, compared with background traffic of backbone
network, even its normal changes, anomalous traffic may
be unnoticeable so that detection based on information
collected from single link is very difficult. However, the
sum of anomalous traffic on many links can be prevailing.
If we put multitraffic singles together and apply networkwide anomaly detection to them, the relationship between
traffic would help to reveal anomaly. Principle component
analysis (PCA) is an existing statistical-analysis technique;
Lakhina et al. [1, 2] applied it as a network-wide detection
method to the field of traffic anomaly detection. It follows
that decomposing overall traffic into two disjoint parts based
on correlation across links or origin-destination (OD) flows,
respectively, corresponds to normal space and anomalous
space. Traffic with less correlation is considered as anomalous
space, the energy of anomalous space; is then compared with
a threshold to diagnosis anomaly.
The distributed traffic anomalies caused by the same
source usually have some similar features in time or
frequency domain. These similarities contribute to strong
correlation between anomalous flows. Since PCA-based
methods deal with the anomalous space that lacks correlation, they are prone to suffer from false negative. Although
the volume of individual anomaly is small, anomalous
flows in many links exhibit inherent correlations. This fact
should be useful for detection. Drawing on the change of
correlation between network-wide anomalous space lends
itself to bypass the limitation of PCA-based methods. In
this paper, we propose a method to detect distributed
traffic anomaly with network-wide correlation analysis of
instantaneous parameters. First traffic signals’ instantaneous
2
EURASIP Journal on Advances in Signal Processing
parameters are computed; and their network-wide anomalous space is then extracted via traffic prediction; finally,
global correlation coefficient as a measure of the correlation
between anomalous space is calculated to reveal anomaly.
The contributions of this paper are as follows.
(i) We perform detection on instantaneous amplitude
and instantaneous frequency of traffic signal, which
can reveal anomalies by its characteristics of time
and frequency domain. To improve computation
speed of instantaneous parameters, we propose a fast
algorithm of instantaneous parameters computation
for anomaly detection.
(ii) We divide anomalous space by means of comparing
the actual instantaneous parameters of OD flows with
the predictions to overcome limitation of PCA in failing to detect the anomalies with strong correlations.
(iii) Targeting at the characteristics of distributed traffic
anomaly, we deploy detection by correlation analysis
of amplitude and frequency between anomalous
space, rather than volume, which can detect small
anomaly in single link.
2. Related Work
Network traffic anomaly detection method can be classified
into single node and multinodes detection by traffic number
being analyzed. Based on whether to take into account
the relationship between traffic, multinodes detection can
be further differentiated between distributed detection and
network-wide detection.
Distributed detection [3–10] is to select some nodes
in the network to construct subdetection networks. First,
each node deploys simple and fast local detection by selfcollected information; second, exchange detecting results of
each node through a certain communication mechanism;
then, synthesize the results of partial or all nodes to
determine whether anomaly occurs. Some related systems
or architecture have been reported, for instance, distributed
attack detection system (DAD) [4, 5], Cooperative Intrusion
Traceback and Response Architecture (CITRA) [6, 7], and so
on. In addition, some try to deploy local detection by frequency domain analysis, as shown in [11]. This collaborative
distributed detection, that determines anomaly by detection
results on many nodes, overcomes the limit of detecting
only by one single node and increases detection accuracy
effectively. However, its final detection result still depends on
local result of each node to a great extent, whereas distributed
network anomaly does not present obvious feature on single
node, which makes it hard to detect one of them.
Being different from the former distributed detection
which tends to detect at different position independently,
network-wide detection is a method that analyzes all traffic
signals together and exposes anomaly through relationship
between traffic. Diagnosis anomaly in network-wide perspective was firstly reported in the works of Lakhina et al.
[1, 2]; they perform PCA to analyze the relationship between
volume of all links or OD flows, in order to divide anomalous
part from traffic. In 2005, Lakhina et al. [12] proposed an
anomaly detection method by applying PCA to the feature
distribution of network-wide traffic, and a DDoS attack
detection method using multiway PCA [13]. Li et al. [14]
introduced a method combining traffic sketch and subspace
for network-wide anomaly detection. Yuan and Mills [15]
defined a weight vector and discovered congestion on many
links by cross-correlation analysis. Huang et al. [16] detected
network disruption via performing PCA to network-wide
routing updates data.
Most of existing network-wide detection methods are
based on PCA. The main advantage of these methods is
the use of the relationship among overall traffic, and can
detect some anomalies effectively, especially abrupt change of
traffic at local point. The basic idea of PCA is to treat traffic
which are highly correlated as normal space and only analyze
the remaining anomaly space. However, distributed traffic
anomalies caused by the same source possess high correlation
with each other, and they are prone to be divided into
normal space by PCA. Therefore, PCA-based method may
suffer from false negative in detecting distributed network
traffic anomaly. Furthermore, these methods still determine
anomaly only by the value of traffic volume, which leads
to the difficulties in detecting relatively small distributed
anomalous traffic from normal ones. In this paper, we
divide anomalous space by comparing predictions of traffic
instantaneous parameters with real value, and make use of
the variation degree of correlation between anomalous space,
rather than volume, to infer anomaly.
Signal process technique has been widely used in traffic
anomaly detection for single node. Cheng et al. [17] found
that the PSD of normal TCP flows exhibit periodicity while
the PSD of DoS attack flow is not. Hussain et al. [18] utilized
the difference of PSD in lower frequency band to classify
the attacks as single or multisource. Chen and Hwang [11]
compared the PSD of normal traffic with attack in lower
frequency band with the aim of periodic pulsing DDoS attack
detection. The PSD of signal illustrates the proportion of
every frequency component as a whole, however it lacks local
information, and cannot be more specific about the time
each frequency component is involved in, while it is more
important to nonstationary traffic signals whose frequency
components are time varying. The instantaneous parameters
can provide information about amplitude and frequency
of nonstationary signal in every time point and how they
change with time. Wang et al. [19] used Hilbert-Huang
transform [20] to acquire the instantaneous frequency of
traffic as an outline of normal behavior for single link. In
this paper, we use both instantaneous parameters of OD
flow, namely, instantaneous frequency and instantaneous
amplitude, and divide anomalous space for each of them.
The main difference between our method and [19] is
that, first, the method proposed by [19] is used for single
node detection, it attempted to find anomaly based on obvious change of traffic instantaneous frequency, however the
variation of instantaneous frequency caused by distributed
anomaly traffic on individual link is potentially small, the
detection method would be hampered by this fact. Whereas,
we analyze network-wide OD flows, and use the change of
EURASIP Journal on Advances in Signal Processing
correlation caused by the effect of alteration simultaneously
across multiple traffic data, to circumvent the difficulty
caused by individual anomaly with small variation in instantaneous frequency. Second, the analysis in [19] was only
for traffic instantaneous frequency. Since anomalous traffic
may cause different impact on instantaneous frequency
and instantaneous amplitude of background traffic, there
might exist false negative in detection from instantaneous
frequency or amplitude solely. Instead, we use instantaneous
amplitude as well as instantaneous frequency so as to achieve
a better detection performance.
3. Distributed Network Traffic
Anomalies Detection
Distributed network traffic anomalies caused by the same
source usually have some similar features. For instance, the
anomalies arose by same attack event, commonly generated
by specific tools, might possess some similarities in their
start time, lasting time, interval time, type and frequency
characteristic, and so forth; likewise, the alternative distributed traffic anomalies caused by nonattack reasons, like
outages, might result in the flows that traverse the location of
anomalous event change simultaneously. These similarities
both in time and frequency domain contribute to the strong
correlation between anomalous flows.
The previous anomaly detection methods usually make
use of the difference between individual anomaly and the
normal pattern to derive judgment. However, they generally
fail to detect the anomalies on individual links which are
relatively small. The alteration of single anomalous flow
is unnoted, while the variational tendency of multiple
anomalous flows in time or frequency domain is easy to
be captured, and by means of this collectively variational
tendency, can conquer the difficulties resulting from small
single anomaly. Therefore, the concept of correlation can
be used to characterize the relationship between multiflows
when they change simultaneously.
As the correlation of anomalous flows is not only
exhibited in time domain, but also reflected in frequency
domain, it is advantageous to consider more kinds of features
of anomalous flows both in time and frequency domains for
correlation analysis to reveal anomaly. Instantaneous parameters (i.e., both instantaneous amplitude and instantaneous
frequency) are physical parameters, which capture transient
characteristic of signal, and characterize it in different ways.
In this sense, we perform correlation analysis on the two
instantaneous parameters of anomalous flows to identify
anomalies more extensively.
Besides the correlation of distributed anomalous flows,
there still exists correlation between normal traffic, such as
the similar diurnal and weekly pattern. Accordingly before
we perform correlation analysis on anomalies, it is necessary
to eliminate the influence of correlation between normal
traffics to avoid the impact on detection result, it is equivalent
to extract anomalous space from the whole traffic signal.
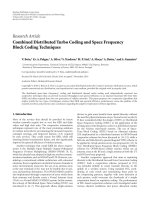
The detection steps are depicted in Figure 1. Firstly, we
compute instantaneous parameters of every OD flows to get
3
Traffic
signal
Instantaneous
parameters
computation
Network-wide
correlation
analysis
Anomalous
space
extraction
Figure 1: Distributed network traffic anomaly detection steps.
their instantaneous amplitude and frequency; then model
the instantaneous parameters with corresponding time series
models, the difference between actual data and predictions
is used to approximate the anomalous space which includes
abnormal flows; finally, network-wide correlation analysis is
performed on the anomalous space and detect distributed
traffic anomaly by the variation degree of correlation. The
computation of instantaneous parameters, extraction of
anomalous space, and network-wide correlation analysis will
be elaborated, respectively, in Sections 4, 5, 6.
4. Instantaneous Parameters and
Fast Algorithm
4.1. Instantaneous Parameters. Traffic signal is nonstationary,
it varies with time, so does its frequency content. The instant
characteristic of nonstationary signal is generally captured by
instantaneous parameters (including instantaneous amplitude (IA), instantaneous frequency (IF)), which decompose
the information of amplitude and frequency, and do not
change the nature of signal, but rather to set up reflections
of different aspects. Instantaneous parameters tend to reveal
some characteristics of signal that are covered by usual time
description. The definitions of instantaneous parameters are
as follow: for any continue time signal X(t), we can get its
+∞
Hilbert transformation: Y (t) = (1/π) −∞ X(τ)/(t − τ)dτ,
then resolve signal Z(t) is obtained by Z(t) = X(t) + iY (t) =
a(t)e jθ(t) , where θ(t) = arctan(Y (t)/X(t)) is the phases
function of Z(t). The instantaneous amplitude of Z(t) is
computed by:
a(t) = X(t)2 + Y (t)2
1/2
.
(1)
Instantaneous frequency ω(t) is denoted as
ω(t) =
dθ(t)
.
dt
(2)
4.2. Fast Algorithm for Instantaneous Parameters Computation. Anomaly detection is usually required to be processed
online. In computation of instantaneous parameters, a whole
traffic series is needed for convolution, however it cannot
meet the need of real-time operation. Accordingly, a sliding
window can be used in practical calculation, to move along
the traffic and intercept data from it. While the window is
sliding, the two data sets, intercepted, respectively, before
and after window moves, always have a same part, and
there would be a lot of redundant results if we compute
the same part twice. So it is convenient to store this part
of instantaneous parameters in advance, and only compute
the new data intercepted by the window to avoid repeating
calculation and improve the detection speed.
4
EURASIP Journal on Advances in Signal Processing
(4)
S2 :
×107
(5)
8
(1)
(2)
(3)
t
6
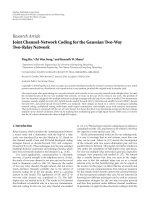
Figure 2: Fast algorithm of instantaneous parameters computation.
Traffic
S1 :
4
2
Let S1 be the traffic data set intercepted by sliding window
at certain time, and the length of window is N, the kernel
of the Hilbert transform 1/(πt), which can be considered as
a filter with the length of 2L, then the Hilbert transform of
S1 (k) can be written as
0
1500
2000
×107
⎧
⎪S1 (k − ΔN),
⎨
0 ≤ k ≤ (N − ΔN),
⎩new input data,
(N − ΔN) < k ≤ N.
Traffic
(3)
5
0
0
500
1000
Time (5 minutes)
1500
2000
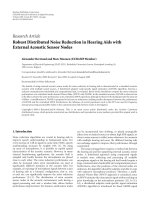
(b) No.50 OD flow unstained
Figure 3: Anomaly in a single flow.
×107
8
(4)
The data of S1 in the section L + ΔN ≤ k ≤ N − L are the
same as the data of S2 in the section L ≤ k ≤ N − L − ΔN,
so the instantaneous parameters IP1 (k) and IP2 (k) of this
part are the same, as represented in Figure 2(2). The number
of the same points is M = N − 2L − ΔN. Therefore, as
long as N > L, we only need to compute the instantaneous
parameters of S2 in the section of k ∈ [0, L] ∪ [N − (L +
ΔN), N].
The fast calculation of instantaneous parameters includes
4 steps.
(i) Compute the instantaneous parameters IP1 (k) of
signal S1 , and store k ∈ [L, N − L − ΔN] part of IP1 (k)
to be the section of IP2 (k) for k ∈ [L, N − L − ΔN],
which is represented in Figure 2(2).
(ii) According to the principle of data periodic repetition
which deals with data beyond the boundary, we pick
up the part of k ∈ [N − L, N] from S2 , and convolute
with filter to get the section of IP2 (k) for k ∈ [0, L),
as it shown in Figure 2(4).
(iii) Pick up the part of k ∈ [0, L] from S2 , and convolute
with filter to get the section of IP2 (k) for k ∈ (N −
(L + ΔN), N), as it shown in Figure 2(5).
(iv) Synthesizing three steps mentioned before, we can get
the whole instantaneous parameters IP2 (k) of S2 .
The fast algorithm of instantaneous parameters based on
sliding window technology adds an array with the length of
6
Traffic
k = 0, 1, . . . , N.
When k − i < 0, namely 0 ≤ k ≤ L, the data of Sk in this
section are out of range and demand process separately, this
section is at the beginning of the signal. When k − i > N,
namely k − i > N, the data in this section are out of range
and demand process separately, this section is at the end of
the signal. When L ≤ k ≤ N − L, the data in this section do
the normal convolution.
As moving along the traffic data, the sliding window
samples the data to get another signal S2 every time lapse of
ΔT, as depicted in Figure 2, it is composed as follows:
S2 (K) = ⎪
1000
Time (5 minutes)
10
4
2
0
0
500
1000
Time (5 minutes)
1500
2000
(a) Adding one anomaly in no.26 OD flow (between vertical dash lines)
×107
10
Traffic
S1 (k)
,
(k − i)π
i=−L
500
(a) Adding one anomaly in no.26 OD flow (between vertical dash lines)
L
HS1 (k) =
0
5
0
0
500
1000
Time (5 minutes)
1500
2000
(b) Adding one anomaly in no.50 OD flow (between vertical dash lines)
Figure 4: Two anomalies in two flows.
M (M = N − 2L − ΔN), to record the same part between
IP1 (k) and IP2 (k), by comparison with normal computation.
When calculating IP2 (k), the same part with IP1 (k) can be
transferred directly to the result to improve the computation
speed of instantaneous parameters.
EURASIP Journal on Advances in Signal Processing
5
×1014
Residual vector
3
2
1
0
0
500
1000
Time (5 minutes)
1500
2000
Figure 5: PCA for one anomalies in two flows.
×1014
Residual vector
3
2
1
0
0
500
1000
Time (5 minutes)
1500
2000
Figure 6: PCA for two anomalies in two flows.
Observing from normal OD flows, traffic usually consists
of normal part and the part representing some random factors, which might be the result of accidental behavior of users
when there exists no anomaly. Owing to the similar daily and
weekly pattern of traffic, the normal part must have some
correlation, if the behavior of normal traffic is separated, the
residual of different OD flows should not have correlation,
which means that the residual traffic are independent of
each other. While anomaly occurs, anomalous flows are of
strong correlation. For this reason, the correlation of normal
traffic is necessary to be restrained. ARIMA (p, d, q) (Auto
Regressive Integrated Moving Average) model [21, 22] are
adopted to forecast the instantaneous parameters of OD
flows, the prediction results as an estimation of normal
pattern are subtracted by actual data so as to divide normal
behavior, and the residual that represents the anomalous
space is needed for the next correlation analysis.
Due to the strong correlation of two injected anomalies in
time domain, as shown in Figure 4, we extract the anomalous
space of instantaneous amplitude through our method,
the result is shown in Figures Figure 7(a) and Figure 7(b),
the similar changing tendency features of anomalies in
instantaneous amplitude are captured accurately. This similar characteristic will contribute to strong correlation of
anomalies, it will be introduced in the Section 6.
6. Network-Wide Correlation Analysis
5. Anomalous Space Extraction
The extraction of anomalous space from traffic signal is
implemented via getting rid of normal traffic behavior. Most
of network-wide anomaly traffic detection methods are PCAbased method, they draw on PCA to divide traffic into
normal and abnormal space, the normal part is determined
while they have strong temporal trend among links or OD
flows. It performs well in detecting abrupt change in the local
of single traffic, but may be limited to the case of distributed
traffic anomaly, for the anomalies with strong correlation are
possibly divided into normal space. We will illustrate it by
changing the number of anomalous flows.
Figure 3 is the traffic of no. 26, 50 OD flows of Abilene
network (more detail in Section 7.1) in the 3rd week. In
Figure 3(a), we inject one anomaly to 26 OD flow with five
times of the mean of it, from 1000 to 1004 sample point,
which corresponds to the spike and can be easily visually
isolated. 50th OD flow is unstained. The anomalous space
derived by PCA is depicted in Figure 5, and the abrupt
change of 26th OD flow is correctly partitioned. In the same
way, we inject another anomaly with 5 times of its mean
and the same lasting time on 50th OD flow, as shown in
Figure 4(b). There are similarities between two anomalies in
the beginning, lasting time, and the change of volume. The
outcome of PCA for the two anomalies is shown in Figure 6.
It shows that the anomalies nearby the 1000th sample point
are not divided into the anomalous space, instead they are
considered as the normal due to the strong correlation.
Therefore, PCA method cannot separate anomalous space
for distributed traffic anomaly with strong correlation.
6.1. Network-Wide Correlation Analysis for Anomalous Space
of OD Flows. The correlation of anomalous space from two
different OD flows in time or frequency domain can be
measured by correlation coefficient in statistical, which is
defined as follows.
Let X and Y stand for two random variables, the
covariance of X and Y is Cov(X, Y ) = E{[X − E(X)][Y −
E(Y )]}, where D(X) and D(Y ) are the variance of X and
Y , respectively. The correlation coefficient of X and Y is
computed by
ρxy =
Cov(X, Y )
.
D(X)D(Y )
(5)
The correlation coefficient is a measure of the linear
relationship between two variables. The absolute value of ρxy
varies between 0 and 1, with 1 indicating a perfect linear
relationship, and ρxy = 0 indicating no relationship.
Due to the path and delay in the network, the distributed
anomalous flows may not rise in the same time, thereby it
is not wise to consider the correlation of two anomalous
space only in the same period. Two sliding windows are
introduced to calculate the correlation coefficient between
two neighborhood periods.
As shown in Figure 8, Oi and O j are the anomalous spaces
extracted from two different OD flows. Window w1 starts at
time t, intercepting the data of Oi with length of w1, as one
of the vector. For the other anomalous space O j , the window
with start point varies between (t − w2, t + w2), intercept the
same length of data to be another vector. Every time the start
point of window on O j moves, a correlation coefficient can
EURASIP Journal on Advances in Signal Processing
be computed, the biggest one is output as coefficient of Oi
and O j at time t:
coff(i, j, t) = maxcorrcoef[Ti (t), T j (t j )],
(6)
where t j is the bound of start point of intercepted vector on
O j . Define the global correlation coefficient of the network at
time t as the mean of coefficients of all two OD flows:
coff(i, j, t),
i
×107
5
0
−5
0
500
(7)
j
where m is the total number of coff(i, j, t), when i = j.
/
To detect anomaly accurately, a threshold is needed
to determine whether the global correlation coefficient is
abnormal. Study on history network traffic shows that
the correlation coefficient of the network follows normal
distribution. Therefore, coefficient’s distribution in a period
of historical time can be selected to set the baseline [23].
Assume in this period of time that the mean of coefficient
is m, variance is δ, standard variance is δ 2 , and threshold
parameter is α. The threshold d is determined by
d = m + α∗δ.
1500
2000
×107
5
0
−5
0
500
1000
Time (5 minutes)
1500
Figure 7: Anomalous space from instantaneous amplitude.
W1
(9)
indicating anomaly at time t.
The global correlation coefficient of two anomalous
spaces in instantaneous amplitude of no.26 and 50 OD flows
in the Section 5 (see Figure 7) is shown in Figure 9. There is a
pronounce spike about 1000 sample point, a sudden increase
and close to 1, and accurately capture the strong correlation
between the anomalous space in instantaneous amplitude.
6.2. Error Analysis for Anomalous Space Extraction to Correlation Computation. Since the purpose of anomalous space
extraction by prediction is to get the trend of traffic and
extract the violation part from them, then examine whether
there is correlation across multiviolation parts, rather than
to get the precise predictions, thereby the accuracy of
prediction algorithm is not the primary consideration in our
method, but the simplicity and rapidness for the real-time
detection. Since there are always deviation between the real
and predictions, we now consider the influence of prediction
error to the computation of correlation coefficient.
The anomalous space of every OD flows RTt consists of
two components: the prediction error et and the anomalous
part At , namely, RTt = et + At , when there exists no anomaly,
At = 0. For the anomalous space of two OD flows, RT1t ,
RT2t , the instantaneous parameters are forecasted independently, so the prediction errorse1t and e2t are independent of
each other. The prediction error and anomalous part which
come from different OD flows, for instance, e1t and A2t or
e2t and A1t , are independent of each other. Therefore, it
2000
(b) Anomalous space of 50 OD flow
(8)
In (8), set α = 2.4, confidence interval m ± 2.4δ,
confidence level of detect percent is 99.6%, variance is 0.4%.
Compare the global correlation coefficient Globalcoff(t) to
the threshold, with
Globalcoff(t) ≥ d
1000
Time (5 minutes)
(a) Anomalous space of 26 OD flows
Instantaneous amplitude
anomalous space
1
Globalcoff(t) =
m
Instantaneous amplitude
anomalous space
6
Oi
W2
W2
Oj
t
Figure 8: The correlation coefficient computation of two anomalous space.
can be proved that Cov(RT1t , RT2t ) = Cov(e1t + A1t , e2t +
A2t ) = Cov(A1t , A2t ). Assuming that there are no prediction
errorse1t = 0, e2t = 0, the correlation coefficient of two OD
flows can be rewritten as:
ρ(RT1)(RT2) = ρ(A1)(A2) =
Cov(A1, A2)
D(A1)D(A2)
(10)
while prediction error does exist, the correlation coefficient
is computed as
ρ(RT1)(RT2) =
Cov(RT1, T2)
=
D(RT1)D(RT2)
Cov(A1, A2)
,
D(A1)D(A2) + Δ
(11)
where Δ = D(e1)D(e2) + D(e1)D(A2) + D(e2)D(A1) is
nonnegative. To summarize, the more prediction errors,
the smaller correlation coefficient will be. However in our
method, we compute the correlation of every two anomalous
7
×107
1
3
0.5
0
2
Traffic
Correlation coefficient of
instantenous amplitude
EURASIP Journal on Advances in Signal Processing
0
500
1000
Time (5 minutes)
1500
1
2000
0
0
Figure 9: Global correlation coefficient of instantaneous amplitude
in no.26, 50 OD flows.
500
1000
Time (5 minutes)
1500
2000
1500
2000
(a) Before injected attack
×107
space in the network, and all the coefficients are reduced
compared with no error, it can be viewed as the overall effect.
To eliminate the impact of the error, a statistical threshold of
correlation coefficient in case of normal can be selected with
the aim of comparison.
Traffic
3
2
1
0
7. Simulation and Analysis
7.2.1. Nonperiodic DDoS Attack. According to the distributed characteristic of DDoS attacks, we choose node 4
as the node which is connected with victim’s ISP, the OD
flows 76, 88, 100, 112, 124, 136 are destined to this node.
We randomly select three time points respectively near 400th,
900th, 1600th of above OD flows at the sixth week, as the
start of anomalies being injected. At each beginning point,
we insert three different attacks in turn which are noise,
increasing rate attack, constant rate attack. Every attack lasts
100 sample points. The traffic before and after inserted
attacks of 112 OD flows in the sixth week are depicted in
Figure 10. The time intervals when attacks were injected have
been marked by vertical dash lines.
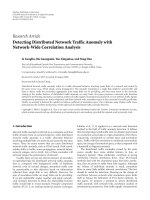
The detection result of instantaneous amplitude is shown
in Figure 11(a), in which the dotted line represents the correlation coefficient directly resulting from of the instantaneous
amplitude of traffic, which means the correlation of normal
1000
Time (5 minutes)
Figure 10: 112 OD flow (6th week) before and after injected nonperiodic DDoS attacks.
Correlation coefficient of
instantenous amplitude
7.2. Detection of Injected DDoS Attacks. To validate the
power of our method, we apply our method to detect
one of the distributed network anomaly—DDoS attack. In
the simulation, we inject nonperiodic and periodic DDoS
attacks. The attacks were added according to the following
principles: the injected attacks are proportional to the mean
of OD flows in which they are inserted; the attacks are
unnoticeable compared to the volume of normal traffic; and
they are not injected at the same time.
500
(b) After injected attack
0.6
0.5
0.4
0.3
500
1000
Time (5 minutes)
1500
(a) The correlation coefficient of instantaneous amplitude
Correlation coefficient of
instantenous frequency
7.1. Simulation Data. The data for simulation in this paper is
collected from American education backbone net Abilene by
Yin Zhang [24], which has 11 Points of Presence (PoP) and
30 links in total. According to sample interval 1%, we can
get end-to-end data at each node and construct a time point
every five minutes. Therefore, there are 2016 time points in
each week. Totally 24 weeks’ data are sampled from 2004-0301 to 2004-09-10.
0
0.6
0.5
0.4
0.3
500
1000
Time (5 minutes)
1500
(b) The correlation coefficient of instantaneous frequency
Figure 11: The detection results of nonperiodic DDoS attacks.
traffic are not been cleared; the dash-dot line is the correlation
coefficient of anomalous space without inserted attacks. Two
observations are available from the dash-dot line (comparing
with the dotted line): (1) it changes more moderate than coefficient resulting directly from the instantaneous amplitude
8
EURASIP Journal on Advances in Signal Processing
×106
Traffic
15
10
5
0
0
500
1000
Time (5 minutes)
1500
2000
1500
2000
(a) Before injected attack
×106
15
Traffic
10
5
0
0
500
1000
Time (5 minutes)
(b) After injected attack
Correlation coefficient of
instantenous amplitude
Figure 12: 124 OD flow (17th week) before and after injected
periodic DDoS attacks.
0.5
0.4
0.3
500
1000
Time (5 minutes)
1500
Correlation coefficient of
instantenous frequency
(a) The correlation coefficient of instantaneous amplitude
0.5
0.4
0.3
500
1000
Time (5 minutes)
1500
(b) The correlation coefficient of instantaneous frequency
Figure 13: The detection results of nonperiodic DDoS attacks.
of traffic (dotted line), because correlation parts in normal
traffic is erased by subtracting predictions from actual data,
accordingly the residual standing for random factor has less
correlation than normal traffic. (2) a offset phenomenon
of dash-dot line towards the bottom, it consists with our
reasoning before that the prediction error causes a overall
effect to the computation of coefficient.
After the attacks were injected, the correlation coefficient
(solid line) changes drastically and surpass the threshold
(horizontal dash line) (set α = 3) during each period
of attacks were injected. The work of [19] has showed
there are difference between the instantaneous frequency of
anomalous traffic and that of normal, therefore it can be used
as a feature to detect some part of network attacks. In our
work, we discover a few anomalies tend to cause relatively
smaller impact to instantaneous frequency of background
traffic than influence on instantaneous amplitude, or vice
versa. As shown in Figure 11(b), the detection results of
instantaneous frequency to increasing rate and constant rate
attack, correlation coefficient corresponding to the attack
were injected exceeds the threshold and are smaller than that
of instantaneous amplitude (Figure 11(a)). This is due to
attackers can easily change the pattern of attack during attack
is launched, anomalous traffic may cause different impact
to instantaneous frequency and instantaneous amplitude
of background traffic. For this reason, a better detection
performance could be achieved by combining the analysis
of instantaneous frequency and instantaneous amplitude of
traffic.
7.2.2. Periodic DDoS Attack. The periodic DDoS attacks are
injected in 17th week traffic data, target node 4. Nearby the
time points 400th, 800th,1400th of 76, 88, 100, 112, 124, 136
OD flows respectively been inserted: periodic increasing rate
attack, middle frequency attack, high frequency attack. Each
lasts 100 time points. In Figure 12 is the traffic of 124 OD
flows before and after added attacks.
As the periodic feature of attacks in time domain, there
are same intrinsic property in frequency (such as the same
frequency components) between the attacks, which leads to
well performance in instantaneous frequency, as depicted in
Figure 13(b), the correlation coefficient (solid line) drastically
exceeds the threshold (horizontal dash line). Furthermore,
periodic attacks also can be revealed by instantaneous
amplitude due to the periodicity in time domain, as shown
in Figure 13(a). As a result, simultaneously analyzing the
correlation of time domain and frequency domain can
increase the possibility of detecting attacks.
7.3. Detection of Real Distributed Anomaly. As we employed
our method on the original Abilene data, without injected
attack, some detection results attracted our attention, the
coefficient of both instantaneous amplitude and frequency
in the third week nearby 1420th sample point, surpass the
threshold (Figures 14(a), 14(b)). Studying the traffic of this
week, we found that 77, 89, 101, 113, 125, 137 OD flows
which have the same destination node 5, appear to suddenly
fall or rise at the 1420th sample point, as marked between
vertical dash lines in Figure 15. The traffic pattern is different
from other weeks. With the experience of network operators,
there might be a anomalous event (e.g., outage, egress shift,
failure) happening in a certain node or link, where 77, 89,
113, 125 OD flows both passed by and resulted in these
9
×107
0.5
2
Traffic
0.45
0.4
0.35
13
14
Time (5 minutes)
15
0
500
1000
1500
2000
500
1000
1500
2000
500
1000
1500
2000
500
1000
1500
2000
500
1000
1500
2000
500
1000
Time (5 minutes)
1500
2000
×108
16
×102
5
Traffic
0.3
12
(a) The coefficient of instantaneous amplitude
Correlation coefficient of
instantenous frequency
1
0
0.4
0
0.35
0
×107
10
0.3
12
13
14
Time (5 minutes)
15
16
×102
Traffic
Correlation coefficient of
instantenous amplitude
EURASIP Journal on Advances in Signal Processing
5
0
(b) The coefficient of instantaneous frequency
×107
Figure 14: The detection results of 3rd week.
Traffic
2
1
0
4
2
0
0
×108
2
Traffic
7.4. Comparison with PCA-Based Method. PCA-based detection method decomposes network-wide traffic into normal
space and anomalous space with the help of PCA, the latter
is also referred to as residual part. The essence of PCA is
a dimension reduction method in the mean-square sense.
More specifically, given the dimension of data set is m, the
objective of PCA is to find a few orthogonal principle axes
w1 , w2 , . . . , wn (n < m), so that the projection on these
directions, namely principle component, is as faithful as
possible to capture the variance of original data, the first
principle axis points in the direction of maximum variance
in original data, other principle axes which in turn point
in the directions of maximum variance remaining in data.
The basis of PCA-based method which divides anomalous
space is to examine the projection on every principal axis
in order, if projection containing 3δ deviation from the
mean is found, the projection on this principal axis and all
subsequent axes are considered as residual part, once the
squared magnitude of residual part surpasses a threshold
deriving from Q-statistic, an alarm is triggered.
In Section 5, we have showed that PCA-based method
tends to assign the anomalies with strong correlation into
normal space. Now we perform PCA method described in
[1] to detect the same injected nonperiod and period DDoS
attacks. The residual parts divided by PCA are respectively
0
×107
Traffic
traffic falling down; at the same time, the OD flows that
directed to node 5 had to bypassed this node or link, and
arrived at their destination through other path, consequently
the traffic of 101, 137 OD flows rose up. These OD flows
were changed abruptly by the same reason, and formed
distributed traffic anomalies. The results of this experiment
show that our method still works well in detecting real
distributed anomalies of network traffic.
0
1
0
0
Figure 15: 77, 89, 101, 113, 125, 137 OD flows of 3rd week.
presented in Figures 16(a) and 16(b), in which the solid lines
represent the residual parts after injected attacks while the
dash-dot lines are that of original data. A zoom is shown as
an insideplot in Figure 16(b).
During the period when attacks were inserted, as marked
with vertical dotted lines, the residual parts of before and
after attacks were injected almost superpose upon each other,
they show that PCA-based method did not assign anomalies
into residual part. As the residual parts divided from which
attacks were inserted (corresponding to solid lines in both
figures), are far less than thresholds which represented by
horizontal dash lines on the top of the figures, alarm could
not be triggered.
10
EURASIP Journal on Advances in Signal Processing
×1016
Residual vector
3
2
1
0
0
500
1000
Time (5 minutes)
1500
2000
(a) Non-period DDos attack (before injected attacks (dash-dot line),
after injected attack (solid line))
×1016
Residual vector
3
×1014
10
2
8
6
820
1
0
0
500
1000
Time (5 minutes)
840
1500
860
2000
(b) Period DDos attack (before injected attacks (dash-dot line), after
injected attack (solid line))
×1016
Residual vector
3
2
1
0
1200
1300
1400
Time (5 minutes)
1500
1600
(c) Analysis of 3rd week
Figure 16: The detection results based on PCA.
The residual part of real distributed anomalies in 3rd
week separated by PCA is shown in Figure 16(c). As
anomalies occurring (marked with vertical dotted lines), the
residual vector does not change obviously and retains lower
than threshold (corresponding to horizontal dash line). As
a result, PCA-based method cannot reveal the anomalies
which appear in multi OD flows simultaneously.
8. Conclusion
Distributed traffic anomaly is small in single link and
hard to detect while total volume of anomalies in multiple links is great and anomalous traffic signals of each
link are similar in time or frequency domain. Aiming at
its similar features between different links, we propose a
method to detect distributed network traffic anomaly with
network-wide correlation analysis of instantaneous parameters. We experimented with different anomalous modes:
non-periodic DDoS attacks, periodic DDoS attacks and
real distributed anomaly. Our simulation results show that:
(1) Instantaneous amplitude and instantaneous frequency
of traffic signal can reveal anomalies by its characteristics
of time and frequency domain; (2) Our anomalous space
extraction method based on traffic prediction can overcome
the limitations of PCA-based method in failing to detect the
anomalies with strong correlations; (3) the network-wide
correlation analysis of amplitude and frequency can detect
distributed network traffic anomaly while anomaly in single
link is very small.
Acknowledgments
The authors would like to thank Yin Zhang for providing us
with Abilene traffic data. The work described in this paper
was supported by NSFC (Project no. 60872033), Program
for New Century Excellent Talents in University(NCET-070148), and The National Key Basic Research Program of
China “973Project” (2007CB307104 of 2007CB307100).
References
[1] A. Lakhina, M. Crovella, and C. Diot, “Characterization of
network-wide anomalies in traffic flows,” in Proceedings of the
ACM SIGCOMM Internet Measurement Conference (IMC ’04),
pp. 201–206, Taormina, Italy, October 2004.
[2] A. Lakhina, M. Crovella, and C. Diot, “Diagnosing networkwide traffic anomalies,” in Proceedings of the ACM SIGCOMM
Conference on Applications, Technologies, Architectures, and
Protocols for Computer Communications, pp. 219–230, Portland, Ore, USA, August-September 2004.
[3] K. Park and H. Lee, “On the effectiveness of route-based packet
filtering for distributed DoS attack prevention in power-law
Internets,” in Proceedings of the ACM SIGCOMM Conference
on Applications, Technologies, Architectures, and Protocols for
Computers Communications, pp. 15–26, San Diego, Calif, USA,
August 2001.
[4] R. K. C. Chang, “Defending against flooding-based distributed
denial-of-service attacks: a tutorial,” IEEE Communications
Magazine, vol. 40, no. 10, pp. 42–51, 2002.
[5] K. K. Wan and R. Chang, “Engineering of a global defence
infrastructure for DDoS attacks,” in Proceedings of the 10th
IEEE International Conference on Networks (ICON ’02), pp.
419–427, Singapore, August 2002.
[6] D. Sterne, K. Djahandari, B. Wilson, et al., “Autonomic
response to distributed denial-of-service attacks,” in Proceedings of the 4th International Symposium on Recent Advances
in Intrusion Detection (RAID ’01), pp. 134–149, Davis, Calif,
USA, October 2001.
[7] D. Schnackenberg, K. Djahandari, and D. Sterne, “Infrastructure for intrusion detection and response,” in Proceedings of the
DARPA Information Survivability Conference and Exposition
(DISCEX ’00), vol. 2, pp. 3–11, Hilton Head, SC, USA, January
2000.
[8] Q. Zhang and R. Janakiraman, “Indra: a distributed approach
to network intrusion detection and prevention,” Tech. Rep.
WUCS-01-30, Washington University, Saint Louis, Mo, USA,
2001.
[9] G. Koutepas, F. Stamatelopoulos, and B. Maglaris, “Distributed management architecture for cooperative detection
and reaction to DDoS attacks,” Journal of Network and Systems
Management, vol. 12, no. 1, pp. 73–94, 2004.
EURASIP Journal on Advances in Signal Processing
[10] J. Ioannidis and S. Bellovin, “Implementing pushback: routerbased defense against DDoS attacks,” in Proceedings of the Network and Distributed System Security Symposium (NDSS ’02),
San Diego, Calif, USA, February 2002.
[11] Y. Chen and K. Hwang, “Collaborative detection and filtering
of shrew DDoS attacks using spectral analysis,” Journal of
Parallel and Distributed Computing, vol. 66, no. 9, pp. 1137–
1151, 2006.
[12] A. Lakhina, M. Crovella, and C. Diot, “Mining anomalies
using traffic feature distributions,” in Proceedings of the
ACM SIGCOMM Conference on Applications, Technologies,
Architectures, and Protocols for Computer Communications, pp.
217–228, Philadelphia, Pa, USA, August 2005.
[13] A. Lakhina, M. Crovella, and C. Diot, “Detecting distributed
attacks using network-wide flow traffic,” in Proceedings of the
FloCon Analysis Workshop (FloCon ’05), Pittsburgh, Pa, USA,
September 2005.
[14] X. Li, F. Bian, M. Crovella, et al., “Detection and identification
of network anomalies using sketch subspaces,” in Proceedings
of the 6th ACM SIGCOMM on Internet Measurement Conference (IMC ’06), pp. 147–152, Rio de Janeriro, Brazil, October
2006.
[15] J. Yuan and K. Mills, “Monitoring the macroscopic effect of
DDoS flooding attacks,” IEEE Transactions on Dependable and
Secure Computing, vol. 2, no. 4, pp. 324–335, 2005.
[16] Y. Huang, N. Feamster, A. Lakhina, and J. Xu, “Diagnosing
network disruptions with network-wide analysis,” in Proceedings of the International Conference on Measurement and
Modeling of Computer Systems (SIGMETRICS ’07), pp. 61–72,
San Diego, Calif, USA, June 2007.
[17] C.-M. Cheng, H. T. Kung, and K.-S. Tan, “Use of spectral
analysis in defense against DoS attacks,” in Proceedings of IEEE
Global Telecommunications Conference (GLOBECOM ’02), vol.
3, pp. 2143–2148, Taipei, Taiwan, November 2002.
[18] A. Hussain, J. Heidemann, and C. Papadopoulos, “A framework for classifying denial of service attacks,” in Proceedings
of the ACM SIGCOMM Conference on Computer Communications, pp. 99–110, Karlsruhe, Germany, August 2003.
[19] W. Wang, K. Pei, X. Jin, et al., “Using Hilbert-Huang
transform to characterize intrusions in computer networks,”
in Proceedings of the 3rd International Conference on Natural
Computation (ICNC ’07), vol. 5, pp. 749–753, Haikou, China,
August 2007.
[20] N. E. Huang, Z. Shen, S. R. Long, et al., “The empirical mode
decomposition and the Hilbert spectrum for nonlinear and
non-stationary time series analysis,” Proceedings of the Royal
Society of London, vol. 454, no. 1971, pp. 903–995, 1998.
[21] K. Papagiannaki, N. Taft, Z.-L. Zhang, and C. Diot, “Longterm forecasting of Internet backbone traffic: observations
and initial models,” in Proceedings of the 22nd Annual Joint
Conference on IEEE Computer and Communications Societies
(INFOCOM ’03), vol. 2, pp. 1178–1188, San Francisco, Calif,
USA, March 2003.
[22] G. E. Box and G. M. Jenkins, Time Series Analysis: Forecasting
and Control, Holden Day, San Francisco, Calif, USA, 1976.
[23] S. S. Kim, A. L. N. Reddy, and M. Vannucci, “Detecting traffic
anomalies through aggregate analysis of packet header data,”
in Proceedings of the 3rd International IFIP-TC6 Networking
Conference on Networking Technologies, Services, and Protocols; Performance of Computer and Communication Networks;
Mobile and Wireless Communications (Networking ’04), pp.
1047–1059, Athens, Greece, May 2004.
[24] />
11