Báo cáo hóa học: "Research Article Load Balancing Routing with Bounded Stretch" pptx
Bạn đang xem bản rút gọn của tài liệu. Xem và tải ngay bản đầy đủ của tài liệu tại đây (1.62 MB, 16 trang )
Hindawi Publishing Corporation
EURASIP Journal on Wireless Communications and Networking
Volume 2010, Article ID 623706, 16 pages
doi:10.1155/2010/623706
Research Article
Load Balancing Routing with Bounded Stretch
Fan Li,
1
Siyuan Chen,
2
and Yu Wang
2
1
Beijing Laboratory of Intelligent Information Technology, School of Computer Science, Beijing Institute of Technology,
Beijing 100081, China
2
Department of Computer Science, College of Computing and Informatics, The University of North Carolina at Charlotte,
Charlotte, NC 28223, USA
Correspondence should be addressed to Yu Wang,
Received 27 April 2009; Accepted 19 June 2009
Academic Editor: Benyuan Liu
Copyright © 2010 Fan Li et al. This is an open access article distributed under the Creative Commons Attribution License, which
permits unrestricted use, distribution, and reproduction in any medium, provided the original work is properly cited.
Routing in wireless networks has been heavily studied in the last decade. Many routing protocols are based on classic shortest path
algorithms. However, shortest path-based routing protocols suffer from uneven load distribution in the network, such as crowed
center effect where the center nodes have more load than the nodes in the periphery. Aiming to balance the load, we propose a
novel routing method, called Circular Sailing Routing (CSR), which can distribute the traffic more evenly in the network. The
proposed method first maps the network onto a sphere via a simple stereographic projection, and then the route decision is made
by a newly defined “circular distance” on the sphere instead of the Euclidean distance in the plane. We theoretically prove that for
a network, the distance traveled by the packets using CSR is no more than a small constant factor of the minimum (the distance of
the shortest path). We also extend CSR to a localized version, Localized CSR, by modifying greedy routing without any additional
communication overhead. In addition, we investigate how to design CSR routing for 3D networks. For all proposed methods, we
conduct extensive simulations to study their performances and compare them with global shortest path routing or greedy routing
in 2D and 3D wireless networks.
1. Introduction
Recently, wireless networks draw lots of attention due to their
potential applications in various areas. They intrinsically
have many special characteristics and some unavoidable
limitations compared with traditional fixed infrastructure
networks. Energy conservation and scalability are probably
two most critical issues in designing protocols for large
scale wireless networks because wireless devices are usually
powered by batteries only with limited computing capability
and the number of such devices could be very large.
Routing is one of the key topics in wireless networks and
has been well studied. Many routing protocols were proposed
for different purposes. For example, there are power efficient
routing for better energy efficiency, cluster-based routing
for better scalability and geographical routing to reduce the
overhead. In this paper, we are interested in designing a load
balancing routing for large wireless networks. By spreading
the traffic across the wireless network via the elaborate design
of the routing algorithm, load balancing routing averages the
energy consumption. This extends the lifespan of the whole
network by extending the time until the first node is out of
energy. Load balancing is also useful for reducing congestion
hot spots thus reducing wireless collisions. Notice that there
are already several load balancing routing protocols [1–5]
in literature. However, most of them try to dynamically
adjust the routes to balance the real time trafficloadbased
on the knowledge of current load distribution (or current
remaining energy distribution), which is not very scalable
for large wireless networks. Here, we assume that individual
node does not know the current load and each node may
want to talk with all other nodes. We then address how to
design load balancing routing for all-to-all communication
scenario in a network.
Notice that most of routing protocols are based on
shortest path algorithm where the packets are traveled via
the shortest path between a source and a destination. Even
for the geographical localized routing protocols, such as
greedy routing, the packets usually follow the shortest paths
when the network is dense and uniformly distributed. In
2 EURASIP Journal on Wireless Communications and Networking
(a) network topology
10
8
6
4
2
0
0
5
10
0
200
400
600
800
(b) load of all-to-all traffic
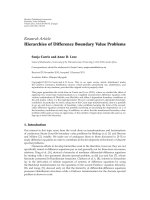
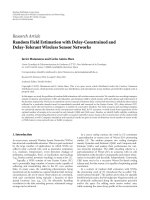
Figure 1: In a grid network, nodes in the center area have much heavier traffic load than nodes in other areas. Here, shortest path routing is
applied for all possible source-destination pairs.
greedy routing, the packet is forwarded to the neighbor
which is nearest to the destination. Taking the shortest path
can achieve smaller delay or traveled distance, however it
can also lead to the uneven distribution of trafficloadin
a network. For example, nodes in the center of a network
will have heavier traffic since most of the shortest routes
go through them. This is just like the transportation system
around a big city where the downtown area is always
the “hot spot.” Figure 1 shows a simulation result on this
scenario. The network is distributed on a 9
× 9 grid, and the
network topology is shown in Figure 1(a). Consider an all-
to-all communication scenario, that is, each node sends one
packet to all other nodes using Shortest Path Routing (SPR)
algorithm. Figure 1(b) illustrates the cumulative trafficload
(i.e., number of packets passing through) for each node. It is
clear that nodes in the center area have much higher traffic
load than nodes in other areas, therefore, nodes in the center
will run out of their batteries very quickly.
To avoid the uneven load distribution of shortest path
routing, we focus on designing routing protocols for wireless
networks which can achieve both small traveled distance and
evenly distributed load in the network. Inspired from circular
sailing (or called globular sailing), which sails on the arc
of a great circle to make the shortest distance between two
places on the earth, we propose a new routing algorithm
called Circular Sailing Routing (CSR). In CSR, wireless nodes
in a 2D network are mapped to a sphere using reversed
stereographic projection and the routing decision is made
based on a newly defined “circular distance” on the sphere
instead of the Euclidean distance in 2D plane. By doing so,
the traffic from one side to another side of the network area
will avoid the center area. Thus, “hot spots” are eliminated
and the load is balanced.
However, there is no such thing as a free lunch. While
load balancing routing protocol try to even the load distri-
bution, it also uses longer routes than the shortest paths.
In general, this means load balancing routing may need
more relaying nodes to deliver the packets thus leads to
large energy consumption. We treat the increase of path
length as the cost of load balancing. We formally define
the compet itiveness and stretch factor of any routing method
compared to SPR. Given a routing method A,letP
A
(s, t)
be the path found by A to connect the source node s and
the target node t. A routing method A is called l-competitive
if for every pair of nodes s and t, the total length of path
P
A
(s, t) is within a constant factor l of the length of the
shortest path connecting s and t in the network. The constant
factor l is called stretch factor (or competitiveness factor) of
A. Then, we theoretically prove that for any networks, the
stretch factor of CSR is bounded by max(π(1+
)/2, π), where
is a constant parameter only depends on the ratio between
the size of the network and the radius of the sphere used in
CSR. In other words, CSR can guarantee the total distance
traveled by packets is constant competitive even in the worst
case.
Notice that recently Popa et al. [6] also proposed a
similar routing technique, called curveball routing (CBR),
which maps the 2D network on a sphere using another
stereographic projection method and route the packets based
on spherical distances between their virtual coordinates on
the sphere. However, the authors did not provide any formal
study on the competitiveness of CBR, except claimed that
“in the presented simulation, curveball routing increases the
average path length by less than 7.5% compared to the greedy
paths. Similarly, the longest path increases by 59%.”
CSR can be easily implemented based on either shortest
path routing or greedy routing. The only modification is
a simple mapping calculation of the position information
and the computational overhead is negligible. There are
no changes to the communication protocol and no any
additional communication overhead.
The rest of the paper is organized as follows. In Section 2,
we first introduce stereographic projection and different dis-
tance metrics. Then we present our Circular Sailing Routing
(CSR) protocol, prove its bounded stretch, and compare its
performance with Shortest Path Routing via simulations in
EURASIP Journal on Wireless Communications and Networking 3
S(0, 0, 0)
N(0, 0, 2r)
O(0, 0, r)
r
m(x, y, 0)
m’(x’, y’, z’)
(a) Stereographic projection I
m’(x’, y’, z’)
S(0, 0, −r)
r
N(0, 0, r)
O(0, 0, 0)
m(x, y, 0)
(b) Stereographic projection II
O(0, 0, r)
S(0, 0, 0)
r
m(x, y, 0)
d
d
m’(x’, y’, z’)
N(0, 0, 2r)
(c) Lambert azimuthal equal-area projection
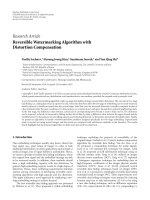
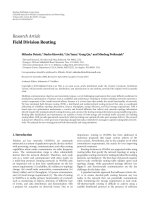
Figure 2: Projection from a sphere to a plane: one-to-one mappings
from a node m
on a sphere S to a node m in a plane.
Section 3.InSection 4, we extend CSR to a localized version
(LCSR) and compare its performance with greedy routing. In
Section 5, we further extend CSR and LCSR to 3D versions
for 3D networks. Two mapping methods for 3D CSR are
proposed and theoretical analysis of their stretch factor are
provided. We review related work in Section 6 and conclude
our paper in Section 7. A preliminary conference version
of this article appeared in [7]. This version introduces a
new definition of circular distance which fixes a bug in the
proof of Lemma 2, contains a new 3D projection method and
stretch analysis for 3D networks, and provides better overall
presentation.
(a) 2D grid topology
S
10
5
2
(b) Size of sphere
2
1
0
−1
−2−2
−1
0
1
2
0
0.5
1
1.5
2
2.5
3
3.5
4
(c) On sphere (r = 2)
5
0
−5
−5
0
5
0
2
4
6
8
10
(d) On sphere (r = 5)
10
5
0
−5
−10
−10
−5
0
5
10
0
5
10
15
20
(e) On sphere (r = 10)
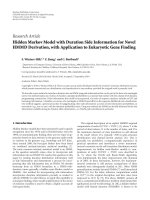
Figure 3: The reversed stereographic projections of a grid network
(9
×9gridina20×20 square area) to the sphere with various radii
(2,5,and10).
2. Preliminaries
2.1. Stereographic Projection. In projective geometry, the
stereographic projection [8] is a certain mapping (function)
that projects a sphere onto a plane. Intuitively, it gives
a planar picture of the sphere. The projection is defined
on the entire sphere, except at one point—the projection
point. Where it is defined, the mapping is smooth and
4 EURASIP Journal on Wireless Communications and Networking
bijective. It is also conformal, meaning that it accurately
represents angular relationships (i.e., local angles on a sphere
are mapped to the same angles in the projection). On the
other hand, it does not accurately represent area, especially
near the projection point. Stereographic projection finds
usage in many fields including cartography, geology, and
crystallography. Sarkar et al. [9] first applied stereographic
projection in wireless networks. They proposed a double
rulings scheme for information brokerage in sensor networks
wheredatareplicaarestoredatacurve(acircleonthe
sphere), and the consumer travels along another curve which
is guaranteed to intersect with the producer curve. In this
paper, we use a reversed stereographic projection to map
wireless nodes in a 2D plane onto a 3D sphere. (When the
context is clear, we ignore the word of “reversed”.)
Figures 2(a) and 2(b) show two approaches to perform
stereographic projection and they place the plane differently.
In this paper, we use the first approach. As shown in
Figure 2(a), we put a sphere with radius r tangent to the
plane at the origin (0, 0,0). Denote this tangent point as the
south pole S and its antipodal point as the north pole N.A
point m on the 2D plane is mapped to m
on the sphere,
which is the intersection of the line through m and N and
the sphere. This provides a one-to-one mapping from the
2D projective plane to a 3D sphere. Notice that stereographic
projection preserves circles and angles. That is, a circle on
the sphere is a circle in the plane and the angle between two
lines on the sphere is the same as the angle between their
projections in the plane.
By simple geometric calculations, we can compute the
3D position on the sphere via the reversed projection by the
following method.
Method 1. Given a node m with position (x, y) in the
2D plane, the 3D position of its reversed stereographic
projection point m
is (x
, y
, z
), where x
= 4r
2
x/(x
2
+ y
2
+
4r
2
); y
= 4r
2
y/(x
2
+y
2
+4r
2
); z
= 2r(x
2
+y
2
)/(x
2
+y
2
+4r
2
).
Figure 3 illustrates examples of reverse stereographic
projection of an 81-node grid network (9
×9gridina20×20
square area). We use the position of the center node as the
tangent point where the sphere is put. Nodes in the grid
network are mapped to nodes on the sphere. Here, we try
different sizes of the sphere (with radii 2, 5, or 10). It is
clear that the size of the sphere affects the distribution of the
mapped nodes on the sphere. With a larger sphere (r
= 10),
the mapped nodes are all nearer to the south pole in the
lower half sphere and have similar distribution of the original
grid network. With a smaller sphere (r
= 2), more nodes
are mapped to the upper half sphere. With r
= 5whichis
near the half of the radius of the grid network, all nodes are
mapped to the lower half sphere more evenly.
Actually, there are several one-to-one projections to
map points on a sphere to points in the plane. Besides
stereographic projections (Figures 2(a) and 2(b)), there
are area-preserving map projections, such as the Lambert
azimuthal equal-area projection. As shown in Figure 2(c),
Lambert azimuthal equal-area projection maps m
on the
sphere to m in the plane, such that the distance from m
to the tangent point S is equivalent to the distance from its
projection m to S. This mapping is not conformal, but equal-
area. An equal-area projection maintains size at the expense
of shape. In this paper, we use stereographic projection in our
scheme and remark that other spherical mapping can also be
used but the bounded stretch may not hold.
2.2. Distance Metrics. In this paper, we will use three different
distances as the route metric in routing algorithm: Euclidean
distance, spherical distance and circular distance.
The Euclidean distance between two pints u and v,
denoted by
uv, is the length of the straight line connected
u and v. This distance metric is used by classic shortest path
routing and greedy routing.
The spherical distance (also called great circle distance or
geodesic shortest distance) between two projection points
u
and v
on the sphere, denoted by d(u
v
), is the shortest
distance between any two points on the surface of a sphere
measured along a path on the surface of the sphere. See
Figure 4(a) for illustration. The shortest distance of m
and n
on the surface is the arc distance d(m
n
) along the greatest
circle defined by the positions of m
, n
,andO. Given the
positions of m
and n
, we can easily get the distances of
Om
, On
,andm
n
.Then,θ = arccos((Om
2
+
On
2
−m
n
2
)/(2Om
On
)), and thus, d(m
n
) =
θr. Notice that θ ≤ π. This distance metric is used by
curveball routing.
The third distance, circular distance d
∗
(m
n
)between
two projection points u
and v
, is a new distance on the
sphere introduced by us in this paper. Let the great circle
passing m
, n
and centered at O be C(m
, n
, O). Then its
corresponding projection in the 2D plane is also a circle,
denoted by C(m, n, o), which passes m, n and is centered at o.
Here, o may be different with the south pole S.Letd(mn)be
the arc on C(m, n, o) which is the projection of the arc of the
spherical distance d(m
n). Let the angle of d(m, n)∠mon be
denoted by ϕ as shown in Figure 4.Ifϕ
≤ π, we define the
spherical distance as the circular distance, that is, d
∗
(m
n
) =
d(m
n
), as shown in Figure 4(a). Otherwise, we use the
length of the longer arc on the great circle C(m
, n
, O)as
the circular distance, as shown in Figure 4(b). In this case,
d
∗
(m
n
) >d(m
n
). In summary, the circular distant can be
calculated as follows:
d
∗
(
m
n
)
=
⎧
⎨
⎩
θr = d
(
m
n
)
if ϕ
≤ π,
(
2π
−θ
)
r if ϕ>π.
(1)
3. Circular Sailing Routing
In this section, we first present our Circular Sailing Routing
(CSR) based on stereographic projection, and then give
both theoretical analysis on the stretch factor of CSR and
simulation results of CSR compared with the shortest path
routing.
3.1. Routing Algorithm. The stereographic projection maps
an infinite plane onto a sphere. For a wireless network, the
area in which the wireless nodes lie corresponds to a finite
EURASIP Journal on Wireless Communications and Networking 5
n’
m’
m
n
o
d
∗
(mn)
d(mn)
ϕ
S(0, 0, 0)
N(0, 0, 2r)
O(0, 0, r)
θ
d
∗
(m’n’)
d(m’n’)
(a) ϕ ≤ π
n’
m’
m
n
o
d(mn)
ϕ
S(0, 0, 0)
N(0, 0, 2r)
O(0, 0, r)
θ
d
∗
(m’n’)
d
∗
(mn)
d(m’n’)
(b) ϕ>π
Figure 4: The shortest distance between two points m
and n
on the sphere is the shorter segment of the greatest circle between m
and n
.
In this case, the circular distance is equal to the spherical distance, since ϕ<π. Otherwise, the circular distance is the longer segment of the
greatest circle.
1: Mapping: Map each node m(x, y, 0) in the 2D plane to a
node m
(x
, y
, z
) on the sphere S (using Method 1).
2: New Metrics: For any existing link mn between two
nodes m and n in the network, calculate the shortest
circular distance on the sphere between their projected
nodes m
and n
(i.e., d
∗
(m
n
)). We use d
∗
(m
n
)as
thecostoflink,mn and call it circular distance.
3: Routing: Applying general shortest path routing with
circular distance as the routing metric, choose the route
with smallest total circular distance.
Algorithm 1: Circular sailing routing.
region of the plane. Let this region be called P. With the
information of the network region, we can place the south
pole S of a sphere
S at the center of the network, whose
coordinate is (0, 0, 0). The radius r of
S is an adjustable
parameter for our proposed routing method. Here, we
assume each node knows the radius r of the projection
sphere. This can be done via either a pre set before the
deployment or a broadcast operation after the deployment.
Any point m(x, y,0)in
P maps to m
(x
, y
, z
) on the sphere
S. It is a one-to-one mapping, where z
≤ k for some 0 <
k<2r.Herek is the z
value of the highest projection on the
sphere.
The basic idea of circular sailing routing is letting packet
follow the circular shortest paths on the sphere instead of
the Euclidean shortest paths in 2D plane. Because there is
no hot spot on the sphere where most of the circular shortest
paths must go through, we expect circular sailing routing can
achieve better load balancing than shortest path routing. The
detailed routing algorithm is given as Algorithm 1.
3.2. Analysis of Stretch Factor. In this section, we provide
theoretical analysis on the stretch factor of CSR. Recall that
a routing method A is called l-competitive or withl-bounded
stretch if for every pair of nodes s and t, the total length of
path P
A
(s, t)foundbyA is within l times of the shortest
path connecting s and t in the network. Hereafter, we call l
the Stretch Factor (SF).
3.2.1. Relationships among D istance Metrics. Before giving
the proof, we need to present some preliminaries for
stereographic projection. Assume that the furthest wireless
node is of distance D from the center (i.e., south pole of the
sphere), then the z
value of the highest projection on the
sphere (i.e., the value of k)is
k
= z
max
= 2r
⎛
⎝
D
D
2
+(2r)
2
⎞
⎠
2
=
2rD
2
D
2
+4r
2
. (2)
As in [9], we choose r
= D
√
/2, > 0, thus k = 2r/(1 + ).
Recall that circles on the sphere map to circles in the
plane, thus the projection of a great circle on the sphere
S
is also a circle in the plane. The spherical distance d(m
n
)is
the distance of the shorter arc C
from a node m
to a node
n
along the great circle on the surface of S.Letd(mn) be the
distance of an arc C between m and n along the projection
of C
and the great circle in the plane (Figure 5). The circular
distance d
∗
(m
n
) is also the distance of the shorter arc from
m
to n
on the great circle (i.e., d
∗
(m
n
) = d(m
n
), as
shown in Figure 4(a)) when ϕ
≤ π and is the distance of the
longer arc from m
to n
on the great circle when ϕ>πas
shown in Figure 4(b).Letd
∗
(mn) be the distance of an arc
in the plane between m and n along the projection of the arc
of d
∗
(m
n
)asinFigure 4(b). Remember that mndenotes
the Euclidean distance between m and n in the plane. The
following two lemmas show that the relationships among
d
∗
(m
n
), d(m
n
), and mn. The major part (relation
between d(m
n
)andd(mn)) of Lemma 1 and its proof are
the same with those of [9,Theorem1].However,weprovide
its proof for completeness.
Lemma 1. Consider any two nodes m
and n
on the sphere S
w ith their projections in the plane m and n, one has
mn≤d
(
mn
)
≤
(
1+
)
d
(
m
n
)
≤
(
1+
)
d
∗
(
m
n
)
. (3)
Proof. First, since the Euclidean distance of two points is
always smaller than the distance along any arc passing them,
6 EURASIP Journal on Wireless Communications and Networking
m
p
q
C’
C
p’
q’
n
||mn||
d(mn)
S(0, 0, 0)
N(0, 0, 2r)
n’
m’
O(0, 0, r)
d(m’n’)
p
∗
Figure 5: The length of the projection d(mn)(ord
∗
(mn)) is
bounded by the length of the shorter segment of great circle d(m
n
)
(or d
∗
(m
n
)) on the sphere, that is, d(mn) ≤ d(m
n
)(1 + ).
d
∗
(mn)C
mn nm
o
ϕ
λ
Figure 6: The relationship between the arc distance d
∗
(mn)along
a circle and Euclidean distance
mn.
that is, mn≤d(mn). Second, the spherical distance on
the sphere is always smaller than the circular distance on the
sphere, that is, d(m
n
) ≤ d
∗
(m
n
). Thus, we only need to
prove d(mn)
≤ (2r/(2r −k))d(m
n
) = (1 + )d(m
n
).
Notice that it is one-to-one mapping between points on
C
and points on C ·
C
dx
= d(m
n
), where dx
is a
miniature segment on C
. Similarly,
C
dx = d(mn), where
dx is the projection of dx
in the plane. See Figure 5 for
illustration. p
q
is a tiny segment on C
with length dx
→
0, and dx
=p
q
. The projection of p
q
is pq with the
length dx
=pq.Letp
∗
be the projection of p
on the line
segment
NS.Thez
valued of p
∗
(or p
)isdenotedbyz
p
∗
.
Then
Np
∗
NS
=
2r −z
p
∗
2r
. (4)
When dx
, dx → 0, that is, pq, p
q
→ 0, we can look pq
and p
q
as in the same plane (the plane defined by nodes
N, p and q), more specifically, the two arcs pass through pq
and p
q
are concentric at north pole N.Then,
dx
dx
=
p
q
pq
=
Np
Np
=
Np
∗
NS
=
2r −z
p
∗
2r
. (5)
Because the highest value of z
p
∗
is k,wehave
dx
dx
≥
2r −k
2r
=
2r −
(
2r
/
(
1+
))
2r
=
1
1+
. (6)
Thus,
d
(
m
n
)
=
C
dx
≥
C
dx
(
1+
)
=
d
(
m, n
)
(
1+
)
. (7)
This finishes our proof.
Lemma 2. Consider any two points m
and n
on the sphere
w ith their projections on the plane m and n, one has
d
∗
(
m
n
)
≤ d
∗
(
mn
)
≤
π
2
mn. (8)
Proof. Similar to the proof of Lemma 1, assume that dx
is a
miniature segment on C
defined for d
∗
(m
n
)anddx is the
projection of dx
in the plane. From the proof of Lemma 1,
we know dx
/dx = (2r −z
p
)/2r ≤ 1. Thus, dx
≤ dx,and
d
∗
(
m
n
)
=
C
dx
≤
C
dx = d
∗
(
mn
)
. (9)
Figure 6 shows a top view of the arc C of d
∗
(mn) in the plane
P.ArcC is a segment between m and n of a circle centered at
o with the radius λ. Notice that o is not necessarily the center
O of the sphere. Then we have d
∗
(mn) = ϕλ and mn=
2λ sin(ϕ/2). By the definition of circular distance, the angle ϕ
of the arc d
∗
(mn)islessorequaltoπ. Therefore,
d
∗
(
mn
)
mn
=
ϕλ
2λ sin
ϕ/2
=
ϕ
2sin
ϕ/2
.
(10)
When ϕ
= π, ϕ/2sin(ϕ/2) reaches its maximum value,
π/2. Thus, d
∗
(mn)/mn≤π/2. This concludes the proof:
d
∗
(m
n
) ≤ d
∗
(mn) ≤ (π/2)mn.
Notice that the relation in above lemma does not hold for
spherical distance, since ϕ for spherical distance maybe larger
than π as shown in Figure 4(b). In other words, d(mn)could
be larger than (π/2)
mn.
3.2.2. Bounded Stretch Factor of CSR. Now we are ready to
prove the main theorem of this paper about the stretch factor
of CSR. We want to prove CSR can find a path whose length
is within a small constant factor of the minimum even in the
worst case scenario.
There are four paths we will use in the proof. Figure 7
illustrates their definitions and the relationship among them.
The dotted line in the plane represents the shortest path
generated by a shortest path routing connecting the source
s and the destination t,denotedbyP
SPR
(s, t). The dotted
line on the sphere is the surface path connecting all the
projections on the sphere of each node along P
SPR
(s, t) using
the circular distance, denoted by P
SPR
(s, t). The solid line
in the plane represents the path found by CSR protocol,
denoted by P
CSR
(s, t) and the solid line on the sphere is
the surface path connecting all the projections of each node
along P
CSR
(s, t), denoted by P
CSR
(s, t). Notice that, in any
two points along a path in the plane, the shortest distance
is the straight line connecting them, meanwhile the circular
distance of its projection on the sphere is a segment (an arc)
ofagreatcircle.ForapathP
A
in the plane, we define P
A
EURASIP Journal on Wireless Communications and Networking 7
O(0,0,r)
i
i−1
v
i−1
v’
i
u
u
i−1
i
u’
v’
i
i−1
u’
P
(s,t)
CSR
SPR
(s,t)
P
SPR
P’
(s,t)
CSR
P’
t
t’
S(0,0,0)
v
s
s’
N(0,0,2r)
(s,t)
Figure 7: The Euclidean path length of proposed CSR protocol is
bounded by the Euclidean path length of shortest path routing.
as the summation of the Euclidian distance of each link in
P
A
.ForapathP
A
on the sphere, we define d(P
A
) as the
summation of the length of each arc in P
A
.
Theorem 1. The stretch factor of CSR is bounded by (π/2)(1+
),thatis,
P
CSR
(
s, t
)
≤
π
2
(
1+
)
P
SPR
(
s, t
)
. (11)
Proof. Let P
CSR
(s, t) = v
0
, v
1
, v
2
, , v
n
,wherev
0
= s and
v
n
= t. Let the projection of P
CSR
(s, t) on the sphere
P
CSR
(s, t) = v
0
, v
1
, v
2
, , v
n
. Similarly, let P
SPR
(s, t) =
u
0
, u
1
, u
2
, , u
m
,whereu
0
= s = v
0
and u
m
= t = v
n
.
Let the projection of P
SPR
(s, t) on the sphere P
SPR
(s, t) =
u
0
, u
1
, u
2
, , u
m
,whereu
0
= s
= v
0
and u
m
= t
= v
n
.
s
and t
are the projections of source s and destination t on
the sphere. Notice that m may not equal to n.
From Lemma 1, we know
v
i−1
v
i
≤(1 + )d
∗
(v
i−1
v
i
),
therefore,
P
CSR
(s, t)=
n
i
=1
v
i−1
v
i
≤
n
i
=1
(1 +
)d
∗
(v
i−1
v
i
) = (1 + )d(P
CSR
(s, t)). According to the CSR
protocol, d(P
CSR
(s, t)) ≤ d(P
SPR
(s, t)) since P
CSR
(s, t) is the
shortest path using circular distance metric on the sphere.
From Lemma 2,wehaved
∗
(u
i−1
u
i
) ≤ (π/2)u
i−1
u
i
.Thus,
d(P
SPR
(s, t)) =
n
i
=1
d
∗
(u
i−1
u
i
) ≤
n
i
=1
(π/2)u
i−1
u
i
=
(π/2)P
SPR
(s, t). Consequently, we have
P
CSR
(
s, t
)
≤
(
1+
)
d
P
CSR
(
s, t
)
≤
(
1+
)
d
P
SPR
(
s, t
)
≤
π
2
(
1+
)
P
SPR
(
s, t
)
.
(12)
Theorem 1 gives a theoretical bound of the stretch factor
of CSR protocol. It shows that the path length in CSR proto-
colisnottoomuchdifferent from the shortest path routing.
Since
= D
2
/(4r
2
), with the adjustable parameter r (i.e., the
radius of the sphere), we can control the stretch factor.
3.3. Simulation. We now evaluate the performance CSR via
simulations for both grid networks and random networks. In
both cases, wireless nodes are distributed in a 20
×20 square
area. In CSR, the south pole of the sphere is tangent at the
center of this area. Nodes in the area are mapped to nodes on
the sphere during the calculation of new metric. Here, we try
different sizes of the sphere (with radii 2, 5, or 10, as shown
in Figure 3). It is clear that the size of the sphere affects the
distribution of the mapped nodes on the sphere.
Grid Networks. We first deploy the 81 nodes on a 9
×9gridin
a20
×20 square area, and then set the transmission range R of
all nodes to 3. The resulted topology is shown in Figure 3(a).
We compare the performance of the shortest path routing
(SPR) and the circular sailing routing (CSR) under the all-
to-all communication scenario. In other words, we assume
every pair of nodes in the network has unit message to
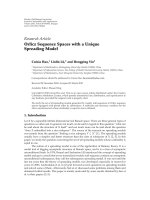
communicate. Figure 8(a) shows the distributions of each
node’s traffic load for both SPR and CSR when the radius
of the sphere r
= 5. It is clear that the load of CSR
(Figure 8(a) (i)) is more evenly distributed than the load of
SPR (Figure 8(a) (ii)). The hot spot problem (center nodes
with highest load) is avoided in CSR. Figure 8(b) shows the
average (Avg), maximum (Max) traffic load, and standard
deviation (STD) of traffic load for all nodes in the network
for SPR and CSR with different radii. The average trafficload
of CSR are larger than SPR, especially when r
= 2(i.e.,
most nodes are mapped to the upper half sphere). This is
reasonable because the SPR has the least total trafficload
than any other routing algorithms. Remember that SPR uses
the shortest path for each pair of nodes. When r
= 5and
10, CSR has smaller maximum load and the STD of load is
much less than SPR. Thus, CSR can balance the load traffic
for each node (s.t., the power consumptions of all nodes are
more even). These results meet our design objective well with
only a little bit more average traffic load. We also find that
when the nodes are mapped to the bottom half sphere (i.e.,
r
= 5), CSR has the best performance compared with other
sizes of the sphere. When the radius is very large, the nodes
are mapped to the area around the south pole, which has
similar distribution with the original network. In such case,
simulation results show that CSR’s performance is similar to
SPR on the original network.
We also study the stretch factor (SF) of CSR.
From Theorem 1, the distance traveled by CSR satisfies
P
CSR
(s, t)≤(π/2)(1+)P
SPR
(s, t),where = D
2
/(4r
2
).
In our simulation settings, D
= 10
√
2. Thus, when r = 2, 5,
and 10, CF
= 21.2, 4.7, and 2.4, respectively. We measure
the SF for each route generated by CSR in our simulation.
Ta bl e 1 gives the average and maximum stretch factor (Avg
SF and Max SF) of CSR with different radii. The simulation
results of SFs confirm our theoretical bounds. Actually the
practical SFs are much smaller than the bounds, and very
close to 1. In other words, not only CSR has balanced traffic
load but also the distance traveled by the packets is almost
the same as the minimum (the distance of the shortest path).
Random Networks. We also test the performance of CSR
with random networks. 81 nodes are randomly deployed in
the field with transmission range R set to 4. We run the
simulation for 100 random networks and take the average.
8 EURASIP Journal on Wireless Communications and Networking
Shortest path routing (SPR)
10
5
0
−5
−10−10
−5
0
5
10
0
200
400
600
800
Shortest path routing (SPR)
10
5
0
−5
−10 −10
−5
0
5
10
0
200
400
600
800
Circular sailing routing (CSR) r
= 5
(i) (ii)
(a)
CSR r = 10
CSR r
= 5
CSR r
= 2
SPR
0
50
100
150
200
250
300
350
400
450
500
Avg load
CSR r = 10
CSR r
= 5
CSR r
= 2
SPR
0
200
400
600
800
1000
1200
Max load
CSR r = 10
CSR r
= 5
CSR r
= 2
SPR
0
50
100
150
200
250
300
350
STD load
(b)
CSR r = 10
CSR r
= 5
CSR r
= 2
SPR
0
50
100
150
200
250
300
350
400
450
Avg load
CSR r = 10
CSR r
= 5
CSR r
= 2
SPR
0
500
1000
1500
2000
2500
Max load
CSR r = 10
CSR r
= 5
CSR r
= 2
SPR
0
100
200
300
400
500
600
STD load
(c)
Figure 8: Load of SPR and CSR: (a) trafficloadofSPRandCSR(r = 5) on a 9 × 9 grid; (b) comparison of traffic load of SPR (black), and
CSR on a 9
×9 grid with r = 2 (green), 5 (blue), and 10 (red); (c) comparison of traffic load of SPR and CSR on 81-nodes random networks
with r
= 2, 5, and 10.
1: For each neighbor v,nodeu maintains both a 2D
position of v in the plane and a 3D position of its
projection v
on the sphere S.Nodeu also maintains
its own 2D position and its projection’s 3D position.
2: While node u receives a packet with destination tdo
3: if
ut≤R,whereR is the transmission range then
4: Forward the packet to t directly and return.
5: Map t to its projection t
(i.e., get its 3D position).
6: if
∃v, s.t.,itsprojectionv
satisfies d
∗
(v
t
) <d
∗
(u
t
)
then
7: Forward packet to node v with the minimum d
∗
(v
t
).
8: else
9: Simply drop the packet.
Algorithm 2: Localized circular sailing routing.
Figure 8(c) and the lower half of Tabl e 1 summarize the
performance comparison of CSR for random networks. CSR
(r
= 5) has the best performance, that is, much smaller
maximum load and load STD with little greater average load
and the average SF is very close to 1.0. CSR (r
= 10) has
similar performance with SPR because the mapped positions
on the sphere are similar to those in the original network.
4. Localized Circular Sailing Routing
The geometric nature of wireless networks allows the
promising idea: localized routing protocols. In localized
routing protocols, by assuming each node has position
information, the routing decision is made at each node by
using only local neighborhood information. It does not need
the dissemination of route discovery information, and no
routing tables are maintained at each node. The most popu-
lar localized routing is greedy routing [10] where the current
node u always finds the next relay node v such that the dis-
tance
t−vis the smallest among all neighbors of u.Ourcir-
cular sail routing is easy to be extended to a localized version
which can achieve better load balancing than greedy routing.
4.1. Routing Algorithm. Similar to the classical greedy rout-
ing, the Localized Circular Sailing Routing (LCSR) just
forwards the packet to the neighbor whose projection is
closest to the projection of the destination on the sphere.
Notice that each node only needs to know its neighbors’
positions to make the routing decision. The detailed routing
algorithm is given in Algorithm 2.
If LCSR can find a neighbor to forward the packet at
each step, it will guarantee to reach the destination in finite
steps. The proof will be similar to the one for greedy routing.
EURASIP Journal on Wireless Communications and Networking 9
LCSR r = 10
LCSR r
= 5
LCSR r
= 2
Greedy
0
50
100
150
200
250
Avg load
LCSR r = 10
LCSR r
= 5
LCSR r
= 2
Greedy
0
50
100
150
200
250
300
350
400
Max load
LCSR r = 10
LCSR r
= 5
LCSR r
= 2
Greedy
0
10
20
30
40
50
60
70
80
90
100
STD load
LCSR r = 10
LCSR r
= 5
LCSR r
= 2
Greedy
0
0.1
0.2
0.3
0.4
0.5
0.6
0.7
0.8
0.9
1
Delivery ratio
(a) 3D Grid Network
LCSR r = 10
LCSR r
= 5
LCSR r
= 2
Greedy
0
20
40
60
80
100
120
140
160
180
Avg load
LCSR r = 10
LCSR r
= 5
LCSR r
= 2
Greedy
0
50
100
150
200
250
300
350
400
450
500
Max load
LCSR r = 10
LCSR r
= 5
LCSR r
= 2
Greedy
0
10
20
30
40
50
60
70
80
90
STD load
LCSR r = 10
LCSR r
= 5
LCSR r
= 2
Greedy
0
0.1
0.2
0.3
0.4
0.5
0.6
0.7
0.8
0.9
1
Delivery ratio
(b) 3D Random Network
Figure 9: TrafficloadofGreedyRoutingandLCSR:(a)trafficloadofa9×9gridnetwork;(b)traffic load of 81-nodes random networks.
However, LCSR cannot always find the forwarding neighbor
since it could fail into a local minimum where no such
neighbor v exists. To solve this problem, we can switch to
greedy routing to find a forwarding neighbor who is nearest
to destination in 2D plane. If the greedy routing cannot find
a forwarding neighbor either, face routing in the plane can
be applied to get out of the local minimum as in [10, 11].
If the packet reaches a location whose projection is closer to
the projection of the destination than the projection of the
position where the previous LCSR has failed, then LCSR is
resumed.
4.2. Simulati on. We test the performance of LCSR algorithm
by using the same grid and random networks which are
used in Section 3.3. We also assume all-to-all communica-
tion in the networks. Classical greedy routing is used for
comparison. For simplicity, in the simulation, we implement
LCSR without any recovery mechanisms, that is, LCSR
(Algorithm 2) simply drops the packet at the local minimum.
Figures 9(a) and 9(b) show the performance comparison
of Greedy Routing and LCSR for the grid networks and
random networks, respectively. Here, the data for random
networks is the average value of 50 random generated
networks. It is clear that LCSR with r
= 5 has the best
performance, that is, smallest maximum trafficloadandSTD
load for both gird and random networks. The delivery ratio
is 100% and almost 100% for grid and random networks,
respectively. For example for the gird network, the max
load
of Greedy Routing is 400 while the max
load of LCSR (r = 5)
is 350, which is reduced about 12.5%. The STD
load is also
decreased by about 22.2%(from 90 to 70). The avg
load of
LCSR (r
= 5) and Greedy Routing are at the same value of
208. Again, LCSR (r
= 10) has very similar performance with
greedy routing, since the larger the sphere, the more alike the
distribution on the sphere to the original 2D distribution.
We also measure the Stretch Factor (SF) of CSR. Here,
CF is the factor between the distance traveled by the packet
in CSR and the distance traveled in greedy routing, if both
Table 1: Stretch factor (SF) of CSR (various sphere size).
Network topology Radius r Avg SF Max SF
Grid
2 1.2202 2.6485
5 1.0085 1.2589
10 1.0000 1.0000
Random
2 1.2150 3.2625
5 1.1122 1.0384
10 1.0135 1.0869
Table 2: Stretch factor (SF) of LCSR (various sphere size).
Network topology Radius r Avg SF Max SF
Grid
2 1.0100 1.2761
5 1.0073 1.2071
10 1.0036 1.1380
Random
2 1.1123 2.5688
5 1.0235 1.6125
10 1.0137 1.4656
routing methods can find a path between the source and the
destination. In the simulation, we randomly select 100 routes
(10 source nodes and 10 destination nodes are randomly
chosen ) and calculate the SF for each route. Tab l e 2 gives
the results for both grid and random networks. Though we
do not have any proof of theoretical bounds, the SFs are very
small in practice.
5. 3D Circular Sailing Routing
So far we consider routing in 2D network and how to map the
nodes onto a sphere so that routing along the sphere can bal-
ance the traffic load. The assumption of 2D network is some-
what justified for applications where wireless devices are
deployed on earth surface and where the height of the net-
work is much smaller than the transmission radius of a node.
10 EURASIP Journal on Wireless Communications and Networking
(a) 3D grid network
Tr afficloadforSPRatlevel4
Tr afficloadforSPRatlevel5
Tr afficloadforSPRatlevel6
10
5
0
−5
−10−10
−5
0
5
10
0
1000
2000
10
5
0
−5
−10
−10
−5
0
5
10
0
1000
2000
10
5
0
−5
−10−10
−5
05
10
0
1000
2000
Tr afficloadforSPRatlevel1
Tr afficloadforSPRatlevel2
Tr afficloadforSPRatlevel3
10
5
0
−5
−10−10
−5
0
5
10
0
1000
2000
10
5
0
−5
−10
−10
−5
0
5
10
0
1000
2000
10
5
0
−5
−10−10
−5
05
10
0
1000
2000
(b) Load of SPR
Figure 10: Uneven load in 3D network using SPR: (a) a 3D grid network with 216 nodes, and (b) the traffic load distribution of SPR at each
node on each level.
However, 2D assumption may no longer be valid if a wireless
network is deployed in space, atmosphere, or ocean, where
nodes of a network are distributed over a three-dimensional
(3D) space and the difference in the third dimension is
too large to be ignored. In fact, recent interest in wireless
sensor networks hints at the strong need to design 3D
wireless networks. 3D wireless networks can be used in many
applications, such as a underwater wireless sensor network
[12] for 3D ocean environment observation or a 3D space
network for space explorations [13]. In a 3D network, the
problem of uneven load distribution also exists. Figure 10(a)
shows a 3D grid network with 6
× 6 × 6 nodes. Consider an
all-to-all communication scenario, that is, each node sends
one packet to all other nodes using shortest path routing
protocol. Figure 10(b) illustrates the cumulative node traffic
(i.e., number of packets passing through) for each node.
Clearly, the center nodes of each level have higher load and
the two middle levels have much higher load than the top and
bottom levels. Therefore, nodes in the center or in the middle
levels may run out of their batteries very quickly. To avoid
the uneven load distribution of shortest path routing, we are
also interested in how to extend the circular sailing routing
to 3D wireless networks. To the best of our knowledge, our
3D method (3D-CSR) is the first one to target at the design
of load balancing routing in 3D wireless networks.
Fortunately, the idea of circular sailing routing can also
be extended to 3D. Instead of mapping a plane to the surface
of a sphere, 3D-CSR maps wireless nodes in a 3D region to
the surface of a 3D or 4D sphere.
5.1. One-to-One Projection Methods. We propose two projec-
tion methods to map the nodes in 3D Euclidean space to a
sphere (either a 3D sphere or a 4D sphere).
Projection Method 1: Projection on 3D Sphere. For a 3D
wireless network, wireless nodes are distributed in a finite
3D region
R (e.g., a cube). With the information of the
network region, we can place the center O of a 3D sphere at
the center of the network, whose coordinate is (0, 0, 0). The
radius r of the 3D sphere is again an adjustable parameter.
Any point m(x, y, z)in
R maps to m
(x
, y
, z
, φ) on the 3D
sphere. Here (x
, y
, z
) is the 3D position of the projection
node m
,andφ is the Euclidean distance from m to the center
O. As shown in Figure 11(a), m
is the intersection point of
the 3D sphere and line
mO. Sometimes the node is inside the
sphere as node n in Figure 11(a). It is easy to show that the
virtual coordinates of m
can be computed by the following
equations: x
= (r/
x
2
+ y
2
+ z
2
)x, y
= (r/
x
2
+ y
2
+ z
2
)y,
z
= (r/
x
2
+ y
2
+ z
2
)z,andφ =
x
2
+ y
2
+ z
2
.Notice
EURASIP Journal on Wireless Communications and Networking 11
O(0, 0, 0)
n
m’
m
n’
d
∗
(m’n’)
(a)
O(0, 0, 0)
n
m’(n’)
m
d
∗
(m’n’)
(b)
S(0, 0, 0, 0)
N(0, 0, 0, 2r)
O(0, 0, r)
r
m(x, y, z)
m’(x’, y’, z’, w’)
4D sphere
3D hyperplane
(c)
Figure 11: (a)-(b) Projection Method 1: from a node m(x, y, z)
in 3D space to a node m
(x
, y
, z
, φ) on the 3D sphere. There
are two cases for the calculation of spherical distance d
∗
(m
, n
):
(a) m
and n
are different points on the sphere; (b) m
and n
are the same point on the sphere. (c) Projection Method 2—
Stereographic Projection: an one-to-one mapping from a node m
in a 3D hyperplane to a node m
on a 4D sphere.
that we need to specially deal with the node O(0,0,0) to
guarantee that the projection is a one-to-one mapping. Here,
we force to map it to the north pole with virtual coordinates
(0, 0, r,0).
To calculate the circular distance d
∗
(m
n
) between two
projections m
and n
, there are two cases as shown in
Figures 11(a) and 11(b).Ifm
and n
are in different
positions on the sphere (Figure 11(a)), d
∗
(m
n
) is the
shortest surface distance on the sphere, which can be
computed by d
∗
(m
n
) = r arccos((Om
2
+ On
2
−
m
n
2
)/(2Om
On
)). In the second case, m
and n
are at the same point on the sphere (Figure 11(b)), then we
calculate d
∗
(m
n
) as the Euclidean distance between nodes
m and n, that is, d
∗
(m
n
) =mn=|φ
m
−φ
n
|.
Projection Method 2: Projection on 4D Sphere. In the second
projection method, we still use the stereographic projection
to map the nodes in 3D networks to a 4D sphere. Stere-
ographic projection can be extended to high-dimensional
space and sphere. Here, we use it to map a 3D region (a 3D
hyperplane) onto a 4D sphere. A 4D sphere (also called 3-
sphere in math), often written as
S
3
, is the set of points in
4-dimensional Euclidean space which are at distance r from
a fixed point of that space. This fixed point is the center of
the 4D sphere. Stereographic projection is conformal in any
dimension, that is, it preserves the angles at which curves
cross each other and also preserves circles. Therefore, a circle
on the sphere is also a circle in the plane (or hyperplane).
As shown in Figure 11(c),weputa4Dspherewithradiusr
tangent to the 3D hyperplane at the center of the network.
Denote this tangent point as the south pole S(0,0,0,0) of
the 4D sphere and its antipodal point as the north pole
N(0,0,0,2r). This 4D sphere can be defined as x
2
+ y
2
+
z
2
+(w −r)
2
= r
2
. A point m(x, y, z) in the 3D hyperplane
is mapped to m
(x
, y
, z
, w
) on the 4D sphere, which is the
intersection of the line
mN with the 4D sphere. This provides
a one-to-one mapping of the 3D projective hyperplane to a
4D sphere. It is easy to show that the virtual coordinates of m
can be computed by the following equations: x
= 4r
2
x/(x
2
+
y
2
+ z
2
+4r
2
), y
= 4r
2
y/(x
2
+ y
2
+ z
2
+4r
2
), z
= 4r
2
z/(x
2
+
y
2
+ z
2
+4r
2
), and w
= 2r(x
2
+ y
2
+ z
2
)/(x
2
+ y
2
+ z
2
+4r
2
).
Geodesics are curves on a surface which give the shortest
distance between two points. They are generalization of the
concept of a straight line in the plane. For all spheres, the
geodesics are great circles. For any two nodes m and n in 3D
network, the geodesic of its projection m
and n
on the 4D
sphere is d(m
n
) = rθ where θ = ∠m
On
= arccos((x
m
x
n
+
y
m
y
n
+ z
m
z
n
+(w
m
−r)(w
n
−r))/r
2
).Similarto2Dcase,we
can then define our circular distance as follows,
d
∗
(
m
n
)
=
⎧
⎨
⎩
θr = d
(
mn
)
if ϕ
≤ π,
(
2π
−θ
)
r if ϕ>π,
(13)
where ϕ
= ∠mon in 3D space.
5.2. Routing Algorithm. All the routing algorithms (3D-CSR
or 3D-LCSR) in 3D networks are the same as 2D-CSR and
2D-LCSR (Algorithms 1 and 2), except for the projection
method and the definition of circular distance d
∗
(m
n
).
In 3D CSR, each node u uses the above projection method
(either method 1 or method 2) to compute the virtual
coordinates of itself and its neighbors on the sphere. For any
link uv, 3D-CSR can calculate the circular distance on the
sphere between projected nodes u
and v
(i.e., d
∗
(u
v
)) and
use it as the routing metric. For 3D-LCSR, current node u
chooses the neighbor v if d(v
t
) is the minimum among all
neighbors.
5.3. Analysis of Stretch Factor. Similar to CSR in 2D networks,
3D CSR can balance the load and eliminates the crowed
12 EURASIP Journal on Wireless Communications and Networking
center effect, but at the same time it uses longer path between
the source and the destination than the shortest path routing.
This may increase the total delay of the packet delivery.
Therefore, we now theoretically study the stretch factor of
3D CSR with Projection Method 1 or Projection Method 2.
Theorem 2. The stretch factor of 3D CSR with Projection
Method 1 (3D-CSR-I) is not bounded.
Proof. We prove the theorem by constructing an exam-
ple where CSR has a arbitrary large SF. See Figure 12
for illustration. The network only has four nodes: s, t,
m,andn with coordinates (ε,0,0), (0,ε, 0), (0, 0, ε), and
((
√
2/2)r,(
√
2/2)r,0), respectively. Here, ε could be an
arbitrary small number. The network only has four links:
sm, sn, tm,andtn.Froms to t, there are two paths,
s
→ m → t and s → n → t. Applying the first
projection method (Projection Method 1), 3D-CSR-I gets
the positions of the projected nodes: s
(r,0,0,ε), t
(0, r,0,ε),
m
(0, 0, r, ε), and n
((
√
2/2)r,(
√
2/2)r,0,r). Since d
∗
(s
n
)+
d
∗
(n
t
) = πr/2, which is smaller than d
∗
(s
m
)+d
∗
(m
t
) =
πr, 3D-CSR-I will chose node n to be the relay node for
packets between s and t. The total distance of P
CSR
(s, t) =
sn + nt=2
((
√
2/2)r −ε)
2
+((
√
2/2)r)
2
.However,
the length of shortest path P
SPR
(s, t) =sm + mt=
2
√
2ε. Thus, the stretch factor l = P
CSR
(s, t)/P
SPR
(s, t) =
(((
√
2/2)r −ε)
2
+((
√
2/2)r)
2
)/2ε
2
. When ε is arbitrary
small, l can be arbitrary large.
Theorem 2 implies that 3D-CSR-I may use an arbitrary
longer path than the shortest path in the worst case.
Fortunately, the worst case seldom occurs in a random
network. Later, our simulation results show that the SF of
3D-CSR-I is not very large for grid or random networks in
practice.
For the stretch factor of CSR with Projection Method
2 (3D-CSR-II), the analysis is very similar to the case of
2D CSR. Recall that stereographic projection is conformal
in any dimension. Using the similar proofs (as we did for
Lemma 1, Lemma 2,andTheorem 1), we can prove the
following theorem.
Theorem 3. The stretch factor of 3D CSR with Projection
Method 2 (3D-CSR-II) is bounded by (π/2)(1 +
),thatis,
P
CSR
(
s, t
)
≤
π
2
(
1+
)
P
SPR
(
s, t
)
. (14)
The only difference in the proofs is in 2D case the nodes
in the 2D network plane are projected onto a 3D sphere and
in 3D case the nodes in the 3D hyperplane are projected
onto a 4D sphere. Theorem 1 shows that the path length of
3D-CSR-IIprotocolisnottoomuchdifferent from the path
length of the shortest path routing.
5.4. Simulation. We now evaluate the performance of 3D-
CSR and 3D-LCSR via extensive simulations for both 3D
grid networks and 3D random networks in a 20
× 20 × 20
cubic area. Again, we compare their performance under
m’
x
y
z
O
s
s’
m
t’
n(n’)
t
ε
ε
ε
Figure 12: Illustration for the proof of unbounded SF for CSR with
Projection Method 1.
Table 3: Stretch factor (CF) of CSR (various sphere size).
Network
r
Avg SF Max SF
topology 3D-CSR-I 3D-CSR-II 3D-CSR-I 3D-CSR-II
Grid
3 1.1554 1.0116 6.6569 1.3314
5 1.1438 1.0019 6.6569 1.1716
15 1.1245 1.0000 3.8284 1.0000
Random
3 1.0809 1.0432 2.8972 1.6342
5 1.1125 1.0245 3.1463 1.3987
15 1.1076 1.0124 2.6744 1.3462
the all-to-all communication scenario. Hereafter, we use
3D-CSR-I/3D-LCSR-I to denote the routing methods with
Projection Method 1 (mapping nodes on a 3D sphere) and
3D-CSR-II/3D-LCSR-II to denote the routing methods with
Projection Method 2 (mapping nodes on a 4D sphere).
5.4.1. CSR versus SPR. For grid network, 216 wireless nodes
are distributed in 6
× 6 × 6 grids (see Figure 10(a)). The
transmission range (Tr) is set to 4.5. For 3D random
networks, 100 nodes are randomly distributed in the 20
×20×
20 cube with each node’s Tr set to 6. We run the simulation
for 100 random networks and take the average. For both grid
and random networks, we try different sizes of the sphere
(with radii 3, 5, and 15). The furthest node is of distance
D
= 10
√
2 = 14.1 from the center of the network cube (or
projection sphere). When r
= 15, the projection sphere is a
little bit larger than the network cube.
Figure 13 demonstrates the average (Avg), maximum
(Max) traffic load, and standard deviation (Std) of load for
SPR, 3D-CSR-I and 3D-CSR-II with different sphere sizes
(r
= 3, 5, and 15) for the grid and random networks.
The leftmost bar of each sub-graph represents the Shortest
Path Routing (SPR) method, the red bars represent 3D-
CSR-I and blue bars represent 3D-CSR-II. The average
load of 3D-CSR-I is larger than SPR. However, 3D-CSR-
II has even smaller average load than SPR especially for
random networks. All CSR algorithms have much smaller
maximumloadandStdofloadthanSPR,forexample,the
EURASIP Journal on Wireless Communications and Networking 13
Table 4: Stretch factor (SF) and delivery ratio of LCSR (various sphere size).
Network Topology Radius r
Avg SF Max SF Delivery ratio
3D-LCSR-I 3D-LCSR-II 3D-LCSR-I 3D-LCSR-II Greedy 3D-LCSR-I 3D-LCSR-II
Grid
3 1.0392 1.0308 1.5892 1.3060
1.0000
1.0000 1.0000
5 1.0318 1.0479 1.3060 1.3060 0.9960 1.0000
15 1.0368 1.0308 1.3060 1.3060 1.0000 1.0000
Random
3 1.0613 1.0592 2.9016 3.2485
0.9835
0.9533 0.9165
5 1.0621 1.0601 2.4369 2.4265 0.9487 0.9529
15 1.0597 1.0603 2.7630 2.4967 0.9687 0.9863
r = 15
r
= 5
r
= 3
0
100
200
300
400
500
600
700
800
900
Avg load
r = 15
r
= 5
r
= 3
0
200
400
600
800
1000
1200
1400
1600
1800
2000
Max load
r = 15
r
= 5
r
= 3
0
50
100
150
200
250
300
350
400
450
STD load
(a) 3D Grid Network
r = 15
r
= 5
r
= 3
0
50
100
150
200
250
300
350
400
Avg load
r = 15
r
= 5
r
= 3
0
200
400
600
800
1000
1200
1400
1600
1800
Max load
r = 15
r
= 5
r
= 3
0
50
100
150
200
250
300
350
STD load
(b) 3D Random Network
Figure 13: Traffic load comparison among SPR, 3D-CSR-I and 3D-
CSR-II with radii r
= 3, 5, and 15: (a) trafficloadofa6
3
grid
network; (b) traffic load of 100-nodes random networks.
maximum load of 3D-CSR-II (r = 5) for grid network has
decreased about 40.9% compared with SPR (from 1978.0to
1050.0); and the Std of 3D-CSR-I (r
= 3) has about 55.4%
deduction compared with SPR (from 423.4 to 188.9). Thus,
our simulation results show that 3D-CSR can achieve better
load balancing than SPR.
r = 15
r
= 5
r
= 3
0
20
40
60
80
100
120
Avg load
r = 15
r
= 5
r
= 3
0
50
100
150
200
250
300
350
Max load
r = 15
r
= 5
r
= 3
0
10
20
30
40
50
60
STD load
(a) 3DGridNetwork
r = 15
r
= 5
r
= 3
0
10
20
30
40
50
60
70
80
90
100
Avg load
r = 15
r
= 5
r
= 3
0
50
100
150
200
250
Max load
r = 15
r
= 5
r
= 3
0
5
10
15
20
25
30
35
STD load
(b) 3D Random Network
Figure 14: Traffic load comparison among greedy routing, 3D-
LCSR-I and 3D-LCSR-II with radii r
= 3, 5 and 15: (a) trafficload
of a 3D grid (4
×4×4); (b) traffic load of 64-nodes random network.
We also study the stretch factor (SF) of CSR by measuring
the SF of each route generated by CSR in our simulation.
Ta bl e 3 gives the average and maximum stretch factor (Avg
SF and Max SF) of CSR with various radii. Remember that
3D-CSR has unbounded SF in theory. As shown in Ta bl e 3,
Max SFs of 3D-CSR-I (r
= 3and5)forgridnetworks
14 EURASIP Journal on Wireless Communications and Networking
are around 6.6 which are much larger than the Max SFs
of 3D-CSR-II. From Theorem 1, the distance traveled by
3D-CSR-II satisfies
P
CSR
(s, t)≤(π/2)(1 + )P
SPR
(s, t),
where
= D
2
/(4r
2
). In our simulation settings, D = 10
√
2.
Thus, when r
= 3, 5, and 15, respectively, SF bounds are
10.3, 4.7, and 1.9. The simulation results of SFs confirm our
theoretical bounds of 3D-CSR-II. Actually the practical SFs
are much smaller than the bounds, and very close to 1 (from
1.00 to 1.64). In other words, not only 3D CSR has balanced
traffic load but also the distance traveled by the packets is
almost the same as the minimum.
5.4.2. LCSR versus Greedy. We then study the performance
of 3D LCSR via 3D grid and random networks. For grid
network, we use a network with 64 nodes in a 4
×4 ×4 grids
and set Tr to 8. For random network, we generate 50 random
networks with 64 nodes in a 20
3
cube and set Tr to 8. For all
results, we take the average of these 50 networks.
Figure 14 shows the performance comparison of greedy
routing, 3D-LCSR-I and 3D-LCSR-II for the grid and ran-
dom networks. The leftmost bar of each subgraph represents
the greedy routing method, red bars represent 3D-LCSR-I,
and blue bars represent 3D-LCSR-II. For the grid network,
3D-LCSR-I has larger maximum load than greedy algorithm
for all radii, but 3D-LCSR-II has much better performance
than greedy, that is, almost the same average load with much
smaller maximum load and Std of load. For example, the Std
of load for 3D-LCSR-II (r
= 3) has decreased dramatically
from 30.0to9.6 (about 68%). In the scenario of random
networks, 3D-LCSR-I and 3D-LCSR-II both have similar
average load to greedy routing, and their maximum load and
Std of load are smaller than greedy routing.
We measure the SFs of 3D LCSR compared with greedy
routing method by randomly selecting 100 node pairs and
calculating the SF for each successful route. Ta ble 4 provides
the results for both grid and random networks. Though we
do not have any theoretical bounds for 3D LCSR, the SFs are
very small in practice, that is, ranged from 1.03 to 3.25. This
table also gives the delivery ratios. The delivery ratios of 3D-
LCSR-II and -I are 100% and almost 100%, respectively, for
grid network with different radii. For the random networks,
the delivery ratios of both 3D-LCSR-II and -I are still very
high (more than 91%).
6. Related Work
Load balancing routing protocols has been studied recently.
Most load balancing routing protocols are based on reactive
routing and evaluate the routes by weights, which depend on
the traffic load information collected by each intermediate
nodes. The load state information can be collected from
the queue size of each node, the transmission quality of
each radio link, or the number of connection held by each
node. Based on the collected information, each hop in a
route is assigned a corresponding weight and the route
with the lowest weight is selected as the default route
for the connection. We call this kind of load balancing
routing protocols as load aware based routing. Dynamic
Load-Aware Routing (DLAR) [1], Load-Balanced Ad hoc
Routing (LBAR) [2], and Load-Sensitive Routing (LSR) [3]
are some examples of this category. Some load aware routing
schemes such as Load aWare Routing [4]andSimpleLoad-
balancing Approach (SLA) [5] focus on the route reply phase
to prevent unnecessary flooding packet forwarding thus to
reduce congestion and interference. They allow each node to
drop RREQ packet or give up packet forwarding depending
on its own traffic load. If the traffic load is high, node may
deliberately give up packet forwarding to save its own energy.
In Hotspot Mitigation Protocol (HMP) [14], mobile nodes
independently monitor local buffer occupancy, packet loss,
MAC contention and delay conditions, and take local actions
in response to the hotspots, such as suppressing new route
requests and rate controlling TCP flows. Most of the existing
load aware based routing try to dynamically adjust the routes
to balance the real time traffic based on the knowledge of
current load distribution, which is not very scalable for large
wireless networks.
Multipath routing between any source-destination pair
of nodes has been studied thoroughly in the context of wired
networks. The general understanding is that dividing the
traffic flow among a number of paths (instead of using a
single path) results in a better balancing of load throughout
the network [15–18]. Although research has been covered
quite thoroughly in wired networks, similar research for
wireless networks is still in the early ages. Wu and Harms
[19] propose an on-demand method to efficiently search
for multiple node-disjoint paths and present the correlation
factor as the criteria for selecting the multiple paths.
Correlation factor of two node-disjoint paths is defined as
the number of links connecting the two paths which is used
to describe the interference of trafficbetweentwonode-
disjoint paths. Dynamic Source Routing [20] inherently
supports Multipath routing by allowing caching multiple
paths. Multipath Routing Protocol with Load Balancing
(MRP-LB) [21] is an extension of DSR. MRP-LB replies first
N request packets and the source routes data packets over
N paths in such a way that the total number of congested
packets on each route is equal. However, [22] showed unless
using a very large number of paths the load distribution is
almost the same as single path routing. Furthermore, how to
discover, maintain and coordinate multiple routing paths is
a very complicated issue.
Global load balancing in fixed networks has also been
studied [23, 24]. The proposed methods usually define the
load balancing routing as flow problems and use integer
linear programming to solve them. Even they can optimally
handle arbitrary traffic distribution (other than all-to-all unit
traffic here), these methods are too complex for wireless
systems with small devices (e.g., sensor networks) or large
dense networks.
Unlike all the above load balancing routing protocols,
the routing protocols in the next category focus on balance
the load for the whole network without knowing the current
load information. Our circular sailing routing protocol also
falls into this category. Hyyti
¨
aandVirtamo[25] studied how
to avoid the crowded center problem by analyzing the load
probability in a dense network. They proposed a randomized
choice between shortest path and routing on inner/ outer
EURASIP Journal on Wireless Communications and Networking 15
radii to level the load. Gao and Zhang [26]considera
special case when all nodes are located in a narrow strip with
width at most
√
3/2 times the communication radius. They
proposed an algorithm that achieve bounded stretch factor
and bounded load-balancing ratio (the constant bounds are
4and3,resp.).In[27], the same authors discussed the trade-
offs between the competitiveness factor and load balancing
ratio in routing on certain type of graphs (namely, growth
restricted graphs). Recently, Popa et al. [6] also proposed
a similar routing technique with our CSR, called curveball
routing, to map the 2D network on a sphere using the
stereographic projection method and route the packets based
on their virtual coordinates on the sphere. The differences
between our CSR and curveball routing are (1) the mapping
method is different, CBR uses the projection method as
shown in Figure 2(b) while CSR uses the projection method
as shown in Figure 2(a); (2) CBR directly uses the spherical
distance as the routing metric while CSR uses the circular
distance; (3) they did not give any theoretical analysis of the
stretch factor of their routing method, while we theoretically
proved that CSR has a bounded stretch factor, that is, it can
guarantee the total distance traveled by packets is constant
competitive even in the worst case compared with shortest
path routing; (4) we extend CSR to a localized version
by modifying the greedy routing without any additional
communication overhead, which is more suitable for wireless
networks; (5) we investigate how to design CSR for 3D
networks by providing two mapping methods for 3D CSR,
that is, wireless nodes in a 3D network are projected on a
3D and 4D sphere and give theoretical proofs of their stretch
factors. All the previous work deals with load balancing in
2D networks, to the best of our knowledge, our paper is the
first one to target at the design of load balancing routing in
3D wireless networks.
7. Conclusion
In this paper, we proposed a set of novel routing proto-
cols, called Circular Sailing Routing for multihop wireless
networks to avoid the uneven load distribution caused by
shortest path routing or greedy routing. By spreading the
traffic across a virtual 3D sphere which is mapped from the
network and routing packets based on newly defined circular
distance, CSR (LCSR) can reduce hot spots in the networks
and increase the energy lifetime of the network. CSR can
be easily implemented using any existing routing protocols
without any major changes or additional overhead. The only
modification is a simple mapping calculation of the position
information. In this paper, we not only provided a theoretical
proof of the bounded stretch factor of CSR, but also con-
ducted extensive simulations to evaluate the proposed proto-
cols. We leave theoretical analysis of (1) the load distribution
of CSR and (2) stretch factor of CBR as our future work.
Notice that the stretch factor of CBR is still an open problem.
Acknowledgments
The authors would like to thank Xiang-Yang Li for the
helpful discussions which inspired this work. Special thanks
to Jie Gao for providing the detailed proof of [9,Theorem
1] which is included here as Lemma 1.Thisworkwas
supported in part by the US National Science Foundation
(NSF) under Grant No. CNS-0721666 and CNS-0915331,
and funds provided by the University of North Carolina
at Charlotte. The work of Fan Li was partially supported
by Beijing Key Discipline Program and funds provided by
Beijing Institute of Technology.
References
[1] S J. Lee and M. Gerla, “Dynamic load-aware routing in
adhocnetworks,”inProceedings of the IEEE International
Conference on Communications (ICC ’01), vol. 10, pp. 3206–
3210, Helsinki, Finland, June 2001.
[2] H. Hassanein and A. Zhou, “Routing with load balancing
in wireless ad hoc networks,” in Proceedings of the 4th ACM
International Workshop on Modeling, Analysis and Simulation
of Wireless and Mobile Systems (MSWIM ’01), pp. 89–96, ACM,
2001.
[3] K. Wu and J. Harms, “Load-sensitive routing for mobile ad hoc
networks,” in Proceedings of the 10th International Conference
on Computer Communications and Networks, pp. 540–546,
2001.
[4] Y. Yi, T. J. Kwon, and M. Gerla, “A load aware routing (LWR)
based on local information,” in Proceedings of the 12th IEEE
International Symposium on Personal, Indoor and Mobile Radio
Communications (PIMRC ’01), vol. 2, pp. 65–69, 2001.
[5] Y. Yoo and S. Ahn, “A simple load-balancing approach in
cheat-proofadhocnetworks,”inProceedings of the IEEE
Global Telecommunications Conference (GLOBECOM ’04), vol.
6, pp. 3573–3577, Dallas, Tex, USA, November-December
2004.
[6] L. Popa, A. Rostamizadeh, R. Karp, C. Papadimitriou, and
I. Stoica, “Balancing traffic load in wireless networks with
curveball routing,” in Proceedings of the 8th ACM International
Symposium on Mobile Ad Hoc Networking and Computing
(MobiHoc ’07)), pp. 170–179, September 2007.
[7] F. Li and Y. Wang, “Circular sailing routing for wireless
networks,” in Proceedings of the 27th IEEE Conference on
Computer Communications (INFOCOM ’08), pp. 2020–2028,
2008.
[8] H. S. M. Coxeter, Introduction to Geometry,JohnWiley&Sons,
New York, NY, USA, 2nd edition, 1969.
[9] R. Sarkar, X. Zhu, and J. Gao, “Double rulings for information
brokerage in sensor networks,” in Proceedings of the 12th
Annual International Conference on Mobile Computing and
Networking (MOBICOM ’06), pp. 286–297, Los Angeles, Calif,
USA, September 2006.
[10] P. Bose, P. Morin, I. Stojmenovi
´
c, and J. Urrutia, “Routing
with guaranteed delivery in ad hoc wireless networks,” Wireless
Networks, vol. 7, no. 6, pp. 609–616, 2001.
[11] B. Karp and H. T. Kung, “GPSR: greedy perimeter stateless
routing for wireless networks,” in Proceedings of the 6th Annual
International Conference on Mobile Computing and Networking
(MOBICOM ’00), pp. 243–254, ACM, 2000.
[12] I. F. Akyildiz, D. Pompili, and T. Melodia, “Underwater acous-
tic sensor networks: research challenges,” Ad Hoc N etworks,
vol. 3, no. 3, pp. 257–279, 2005.
[13] X. Hong, M. Gerla, R. Bagrodia, T. J. Kwon, P. Estabrook,
and G. Pei, “The Mars sensor network: efficient, energy
aware communications,” in Proceedings of the IEEE Military
16 EURASIP Journal on Wireless Communications and Networking
Communications Conference (MILCOM ’01), vol. 1, pp. 418–
422, 2001.
[14]S B.Lee,J.Cho,andA.T.Campbell,“Ahotspotmitigation
protocol for ad hoc networks,” Ad Hoc Networks,vol.1,no.1,
pp. 87–106, 2003.
[15] R. Krishnan and J. A. Silvester, “Choice of allocation granu-
larity in multipath source routing schemes,” in Proceedings of
the 12th Annual Joint Conference of the IEEE Computer and
Communications Societies (INFOCOM ’93), vol. 1, pp. 322–
329, 1993.
[16] I. Cidon, R. Rom, and Y. Shavitt, “Analysis of multi-path
routing,” IEEE/ACM Transactions on Networking,vol.7,no.6,
pp. 885–896, 1999.
[17] M. R. Pearlman, Z. J. Haas, P. Sholander, and S. S. Tabrizi,
“On the impact of alternate path routing for load balancing
in mobile ad hoc networks,” in Proceedings of the 1st ACM
International Sym posium on Mobile Ad Hoc Networking &
Computing (MobiHoc ’00), pp. 3–10, IEEE Press, Piscataway,
NJ, USA, 2000.
[18] P. P. Pham and S. Perreau, “Performance analysis of reactive
shortest path and multi-path routing mechanism with load
balance,” in Proceedings of the 14th Annual Joint Conference
of the IEEE Computer and Communications Societies (INFO-
COM ’03), vol. 1, pp. 251–259, 2003.
[19] K. Wu and J. Harms, “Performance study of a multipath
routing method for wireless mobile Ad hoc networks,” in
Proceedings of the IEEE International Workshop on Modeling,
Analysis, and Simulation of Computer and Telecommunication
Systems (MASCOTS ’01), pp. 99–107, 2001.
[20] D. B. Johnson and D. A. Maltz, “Dynamic source routing in
ad hoc wireless networks,” in Mobile Computing, T. Imielinski
and H. Korth, Eds., vol. 353, chapter 5, pp. 153–181, Kluwer
Academic Publishers, Dordrecht, The Netherlands, 1996.
[21] P. Pham and S. Perreau, “Multi-path routing protocol with
load balancing policy in mobile ad hoc network,” in Proceed-
ings of the 4th IEEE International Workshop on Mobile and
Wireless Communications Network, pp. 48–52, 2002.
[22] Y. Ganjali and A. Keshavarzian, “Load balancing in ad hoc
networks: single-path routing vs. multi-path routing,” in
Proceedings of the 23rd Annual Joint Conference of the IEEE
Computer and Communications Socie ties (INFOCOM ’04), vol.
2, pp. 1120–1125, 2004.
[23] Y. Wang and Z. Wang, “Explicit routing algorithms for internet
traffic engineering,” in Proceedings of the International Con-
ference on Computer Communications and Networks (ICCCN
’99), pp. 582–588, 1999.
[24] L. Fratta, M. Gerla, and L. Kleinrock, “The flow deviation
method: an approach to store-and-forward communication
network design,” Networks, vol. 3, no. 2, pp. 97–133, 1973.
[25] E. Hyyti
¨
aandJ.Virtamo,“Ontraffic load distribution
and load balancing in dense wireless multihop networks,”
EURASIP Journal on Wireless Communications and Network-
ing, vol. 2007, no. 1, p. 21, 2007.
[26] J. Gao and L. Zhang, “Load balanced short path routing in
wireless networks,” in Proceedings of 23rd Annual Joint Con-
ference of the IEEE Computer and Communications Societies
(INFOCOM ’04), 2004.
[27] J. Gao and L. Zhang, “Tradeoffs between stretch factor and
load balancing ratio in routing on growth restricted graphs,” in
Proceedings of the 23rd Annual ACM Symposium on Principles
of Distributed Computing (PODC ’04), pp. 189–196, ACM,
2004.