Báo cáo hóa học: "Research Article Multiuser Resource Allocation Maximizing the Perceived Quality" pdf
Bạn đang xem bản rút gọn của tài liệu. Xem và tải ngay bản đầy đủ của tài liệu tại đây (1 MB, 15 trang )
Hindawi Publishing Corporation
EURASIP Journal on Wireless Communications and Networking
Volume 2009, Article ID 341689, 15 pages
doi:10.1155/2009/341689
Research Article
Multiuser Resource Allocation Maximizing the Perceived Quality
Andreas Saul and Gunther Auer
DOCOMO Euro-Labs, Landsberger Str. 312, 80687 Munich, Germany
Correspondence should be addressed to Andreas Saul,
Received 1 August 2008; Accepted 24 January 2009
Recommended by Thomas Michael Bohnert
Multiuser resource allocation for time/frequency slotted wireless communication systems is addressed. A framework for
application driven cross-layer optimization (CLO) between the application (APP) layer and medium access control (MAC) layer
is developed. The objective is to maximize the user-perceived quality by jointly optimizing the rate of the information bit-stream
served by the APP layer and the adaptive resource assignment on the MAC layer. Assuming adaptive transmission with long-term
channel state information at the transmitter (CSIT), we present a novel CLO algorithm that substantially reduces the amount of
parameters to be exchanged between optimizer and layers. The proposed CLO framework supports user priorities where premium
users perceive a superior service quality and have a higher chance to be served than ordinary users.
Copyright © 2009 A. Saul and G. Auer. This is an open access article distributed under the Creative Commons Attribution License,
which permits unrestricted use, distribution, and reproduction in any medium, provided the original work is properly cited.
1. Introduction
With the high envisaged data rates of beyond 3rd generation
(B3G) wireless communication systems [1, 2], multimedia
broadband applications can be offered to mobile users.
Multimedia applications are characterized by a multitude of
data rate and quality of service (QoS) requirements. On the
other hand, owing to the nature of the mobile radio channel,
frequency selective fading, distance dependent path loss, and
shadowing cause vast variations in the attainable spectral
efficiency per user. The objective of multiuser resource
allocation is to assign the available resources over the
shared wireless medium to mobile users running different
applications [3].
Orthogonal frequency division multiple access
(OFDMA) provides orthogonal transmission slots in
time and frequency, which may be flexibly assigned to
the individual users [4, 5]. In B3G systems, this feature
is exploited by the medium access control (MAC) layer
to freely distribute the available bandwidth between users
[6]. Provided channel state information at the transmitter
(CSIT) is available, the number of transmitted information
bits per slot can be adjusted to the channel conditions of a
particular user.
The application (APP) layer outputs encoded applica-
tions, for example, a video stream. For the scalable video
coding (SVC) extension [7, 8] of the advanced video coding
(AVC) standard H.264/MPEG-4 AVC the stream may be
received with a variable information bit rate. Other kinds of
video streams may be encoded or transcoded [9] with the
desired data rate. In general, any application may be delivered
with variable information bit rate, allowing to trade user-
perceived quality with data rate.
The high level of flexibility and adaptability offered
by emerging system architectures provides an opportu-
nity for dynamic allocation of resources across users and
applications, to increase the network resource usage and
to enhance the user satisfaction. This effectively requires
interaction between system layers, a paradigm known as
cross-layer design [10–12]. For the multiuser resource allo-
cation problem at hand, a global cross-layer optimization
(CLO) problem is formulated: maximize the user-perceived
quality by tuning the served data rate on the APP layer
jointly with the adaptive resource assignment on the MAC
layer. Application-driven CLO has been studied for systems
supporting one single type of applications [11, 13, 14]aswell
as for various application classes [15].
Several publications [15–17] consider a logarithmic
relation between utility metric and data rate, which may
result in a concave optimization problem. A more realistic
utility metric, measuring the user-perceived quality, is given
by the concept of mean opinion score (MOS) [18]. In [15],
2 EURASIP Journal on Wireless Communications and Networking
a framework is established that allows to mathematically
formulate the MOS for multiple applications like voice, video
streaming, and file download. The resulting nonconcave
optimization problem may be approximated, for example,
with a greedy algorithm that maximizes the sum of the MOSs
for all users [19].
In this paper, the optimum multiuser resource allocation
supporting multiple applications is derived in closed form
for the case of adaptive transmission with long-term CSIT,
assuming a logarithmic relation between utility metric and
data rate. Interestingly, the cross-layer optimization problem
is shown to become independent of the channel conditions
but is entirely determined by the application characteristics,
provided that the offered data rate at the APP layer is
matched to the adaptive transmission parameters in the
MAC layer. For the special case where all users share the
same application class, it turns out that the overall perceived
quality is maximized when all users are allocated the same
bandwidth, which corresponds to equal resource sharing.
This implies that users with good channel conditions
transmit with higher rate and therefore enjoy better QoS,
as adaptive transmission is more bandwidth efficient in this
case. This is in a sharp contrast to conventional approaches
for QoS provisioning that assume a fixed target rate per
user [3–5], where users with poor channel conditions are
allocated more bandwidth, so that all receivers perceive the
same QoS.
The theoretical analysis serves as a basis for a novel CLO
algorithm that allows for a more realistic utility function
that is based on the MOS. The proposed algorithm for
the underlying nonconcave optimization problem is easy to
implement and exhibits significantly lower complexity than
the generic solutions in [19, 20]. Moreover, priority classes
can be supported in the way that premium users perceive
superior service quality and are more likely to be served, even
under poor channel conditions. The proposed framework
also allows to cater for additional constraints, such as a
guaranteed minimum perceived quality for all users.
The developed CLO framework for application driven
multiuser resource allocation is evaluated by mathematical
and numerical analysis. We elaborate for which application
classes CLO attains the most significant gains, and the origin
of these gains is identified. Furthermore, the computational
cost and the overhead due to exchange of CLO related
parameters between layers is studied. It is demonstrated
that the overhead of the proposed CLO framework grows
only linearly with the number of users and available slots,
which compares to an exponentially growing overhead for
conventional techniques [11, 12, 21, 22]. This is particularly
relevant to B3G systems with their high degree of freedom for
resource allocation, due to the large number of served users
and available slots.
The remainder of this paper is structured as follows.
Section 2 provides an overview of the considered multiuser
downlink with focus on MAC and APP layers. Section 3
introduces the CLO framework and the flow of exchanged
parameters between layers and optimizer. In Section 4, the
optimum multiuser resource allocation strategy is derived,
assuming idealized application characteristics. The proposed
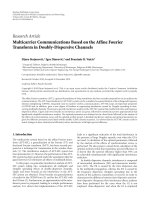
User 1: α
1
= 40%
User 2: α
2
= 40%
User 3: α
3
= 20%
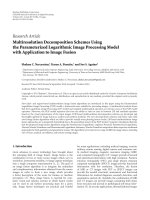
Figure 1: Packet-based generalized processor sharing (PGPS).
CLO framework for the more realistic nonconcave optimiza-
tion problem is established in Section 5, and its performance
is evaluated by computer simulations in Section 6.
2. System Overview
A wireless downlink shared by K users is considered. An
application server is transferring multimedia applications via
core network and base station to mobile users. There are K
applications, which, without loss of generality, generate K
bit-streams, associated to K different users.
2.1. Link and Physical Layer. In the considered shared wire-
less downlink the resources are divided into slots occupying a
given bandwidth and time, which can be flexibly allocated to
users.Ascenariowheremobileuserstravelwithpotentially
high velocities is considered. The high dynamics of the time
varying channel prohibit the utilization of instantaneous
CSIT. However, long-term CSIT that includes distance
dependent path loss and log-normal shadowing is assumed
to be available. As the long-term CSIT is constant over the
whole frequency band, multiuser scheduling corresponds to
the well known packet-based generalized processor sharing
(PGPS) [23]. A PGPS scheduler aims to assign slots to user
k proportionally to a coefficient α
k
, which serves as input
parameter for the scheduler, as illustrated in Figure 1.
The long-term CSIT allows to extract the average signal-
to-noise ratio (SNR) for user k, which is used to select
an appropriate modulation and coding scheme for the
respective user. The spectral efficiency of the selected symbol
mapping and coding scheme for user k is denoted by η
k
in [bit/s/Hz]. Denote the number of symbols per slot by
n
slot
; the number of transmitted information bits per slot
for user k amounts to η
k
n
slot
. Given user k is assigned all
available slots N
slot
exclusively, the maximum achievable data
rate yields R
max,k
= N
slot
n
slot
η
k
. The actual data rate to user k
by the PGPS scheduler is then given by
R
k
= α
k
R
max,k
= α
k
N
slot
n
slot
η
k
. (1a)
Additionally, the constraints
0
≤ α
k
≤ 1 ∀k ∈ K ,
k∈K
α
k
= 1(1b)
need to be fulfilled with K
{1, ,K} being the set of
all users; that is, the amount of assigned resources cannot
be negative and the sum of all assigned resources equals the
available resources.
EURASIP Journal on Wireless Communications and Networking 3
2.2. Application Layer. The objective MOS is recommended
as utility metric for voice transmission by the ITU-T [18]
as a measure for the user satisfaction. Practically, the MOS
may take values between 1 (not acceptable) and 4.5 (very
satisfied). In [15], the MOS is extended to other services
like video streaming, file download, and web browsing. The
obtained mathematical model of the user-perceived quality
can be used as universal utility metric for CLO, allowing for
joint optimization of different application classes.
The application characteristic is mainly influenced by
data rate and packet losses, described by the applications’
rate-loss distortion [24]. In this paper, the perceived quality
is exclusively expressed as a function of the data rate R
k
, while
packet losses are not considered as an explicit parameter.
While this conveniently simplifies the analysis, this choice
requires some further motivation, since certain kinds of
source encoded bit-streams are sensitive to packet losses [11].
Packet losses may be caused by transmission errors over
the mobile radio channel or by system overload. Regarding
the wireless channel the link layer may compensate for packet
losses by means of adaptive modulation and channel coding
in combination with automatic repeat request (ARQ). While
link adaptation ensures that transmission errors occur with
low probability, low latency retransmissions of erroneous
packets within the link layer [6] maintain reliable delivery of
packets, at the expense of a certain rate reduction.
In an overloaded scenario, the offered load by the APP
layer exceeds the capacity of the wireless link. Such an
overload scenario can be effectively avoided by a fine grained
adjustment of the offered data rate at the APP layer so as to
match the capacity of the wireless link.
For instance, in case of video streaming, transcoding [9]
or using the SVC extension of H.264/MPEG-4 AVC [7, 8]
allows to vary the data rate in a rather fine granularity. As
packets can be dropped at either the application server or
the base station, a low latency rate adaption mechanism is
feasible, at the same physical location as the scheduler in the
MAC layer, effectively allowing to express perceived quality
by data rate.
Moreover, the possibility to selectively drop packets offers
one further opportunity to adjust the data rate. Likewise,
for file downloads the data rate can also be adjusted in
arbitrarily small steps. Hence, it is reasonable to assume that
the application data rates can be adjusted continuously.
2.2.1. Video Streaming. We choose video streaming as one
relevant example of an application class. In [25], a simple
concave rate-distortion model is proposed for H.264/MPEG-
4 AVC that relates the data rate of a video stream to the peak
signal-to-noise ratio (PSNR):
PSNR
k
dB
= a + b
R
k
c
1 −
c
R
k
. (2)
The parameters a, b,andc characterize a specific video
stream or sequence, which is source encoded with rate
R
k
. These parameters may be determined by matching the
distortion-rate model to the measured bit stream of a video.
Mean opinion score
1
1.5
2
2.5
3
3.5
4
4.5
Data rate (bit/s)
10
5
10
6
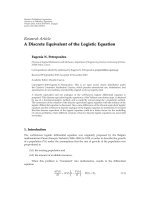
Figure 2: Time variant application characteristic of “Foreman”
video stream.
According to [15, 26], the relationship between PSNR
and MOS may be approximated by the bounded logarithmic
function:
MOS
k
PSNR
k
=
⎧
⎪
⎪
⎪
⎪
⎨
⎪
⎪
⎪
⎪
⎩
1:PSNR
k
≤ PSNR
1.0
,
d log PSNR
k
+ e :PSNR
1.0
< PSNR
k
< PSNR
4.5
,
4.5:PSNR
k
≥ PSNR
4.5
,
(3a)
with
d
=
3.5
log PSNR
4.5
− logPSNR
1.0
,
e
=
log PSNR
4.5
− 4.5logPSNR
1.0
log PSNR
4.5
− logPSNR
1.0
.
(3b)
The parameters PSNR
1.0
and PSNR
4.5
denote the PSNR
at which the perceived quality drops to “not acceptable”
(MOS
= 1.0) and exceeds “very satisfied” (MOS = 4.5),
respectively.
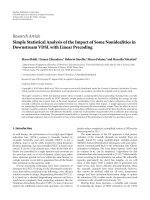
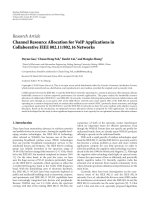
The rate-distortion characteristic of a video typically
varies over time, which means that the parameters a, b,andc
are time variant. For example, during a scene cut a higher
data rate is required to maintain a certain quality. As an
example Figure 2 shows the rate-MOS model for PSNR
1.0
=
30 dB and PSNR
4.5
= 42 dB of the well known “Foreman”
video. The 9 different curves correspond to different parts of
the video of 1 second duration each.
3. Application-Driven
Cross-Layer Optimization
Cross-layer design implies that additional parameters are to
be exchanged between link and APP layers, denoted as con-
trol information. Figure 3 illustrates the system architecture
including the flow of control information. In the following,
the architecture, functional blocks, and variables depicted in
Figure 3 are described.
4 EURASIP Journal on Wireless Communications and Networking
U
R
R
MOS
α
R
max
R
opt
α
opt
Application
models
Optimizer
Link model
Cross-layer
optimizer
Application
parameters
Adaptive
applications
Operating
system
Application server
Data
Core network
Data
Adaptive
scheduler
Data rate
estimation
Modulation
Base station
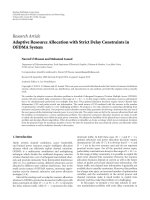
Figure 3: Control information processing and flow.
3.1. Layer Model. A major challenge in cross-layer design is
the abstraction of parameters exchanged as control informa-
tion. In order to limit the amount of control information,
we introduce a layer model at the optimizer that emulates
the relevant characteristics of the layer. The parameters of
the layer model are determined at the corresponding layer,
and only these parameters are sent as control information
to the optimizer. The optimizer then tunes the model so as
to identify the operating modes that maximize the chosen
utility, which are then fed back to the system layers.
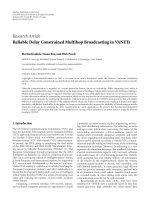
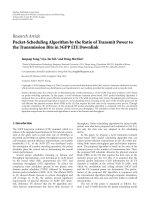
Figure 4 demonstrates the difference between the pro-
posed model-based approach, and conventional parameter
abstraction based on operating modes (crosses) and points
(circles) [11, 12, 21, 22]. The X-axis indicates the choice of
one parameter a
1
, and the Y-axis indicates the corresponding
utility metric u
=
f (a
1
, a
2
, ). Depending on the choice of
a
1
and further parameters a
2
, that cannot be determined
from Figure 4 different operating modes of the utility metric
are achieved.
For instance, applied to a video stream the local utility
f could be the PSNR or MOS, and according to (2) the
parameters a
1
, might represent source coding parameters
such as the chosen codec, the frame rate, and the data rate
R
k
. As a second example, applied to the PHY layer the local
utility might be the sum throughput of all users, and a
1
,
are parameters such as the channel coefficients or the velocity
of the mobile terminal.
Following the conventional idea of parameter exchange,
an intralayer optimization might deliver the subset of
operating modes that maximize the utility function u, called
efficient set in [22], also known as Pareto frontier. These
operating modes are the crosses being located on the curve in
Figure 4. A subset of operating modes is selected as operating
Local utility metric
Parameter value
Model (proposed)
Operating point (conventional)
Operating mode
Figure 4: Visualization of operating modes.
Mean opinion score
1
2
3
4
Data rate
R
1.0
R
4.5
Figure 5: Considered generic application characteristic for one
example application class.
points (circles). These are provided to the optimizer, which
performs CLO by choosing the overall best operating point.
The proposed layer model is the curve in Figure 4,
which represents an approximation of the utility metric u
=
f (a
1
, a
2
, ) as a continuous function. As demonstrated in
the following the proposed parameter abstraction by a layer
model exhibits a significant advantage for multiuser resource
allocation, due to the potentially large number of available
slots.
3.1.1. Link Layer Model. For conventional CLO the parame-
ters that are provided to the optimizer are the set of possible
data rates for all users
{R
k
} in (1). Considering an OFDMA-
based B3G air interface with a large number of available
slots, a prohibitive set of possible data rates is obtained.
Insteadofoffering a set of discrete values to the optimizer, the
link layer model defines the shares of the available resources
per users, α
k
∈ [0,1] in (1), as continuous functions. The
factors α
k
allow the optimizer to tune the link layer model.
Then, according to (1) an arbitrary number of data rate
combinations R
1
, ,R
K
can be emulated at the optimizer.
The only required parameters at the optimizer are the set of
K parameters
{R
max,k
}. Hence, the link layer model for the
optimizer is fully determined by (1). Once the optimizer has
found an optimum set of coefficients
{α
opt,k
}, these are fed
back to the link layer.
EURASIP Journal on Wireless Communications and Networking 5
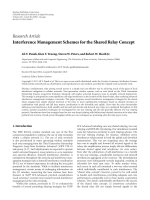
3.1.2. Application Layer Model. The considered generic
application characteristic resembles a bounded logarithmic
relation between perceived quality and data rate as illustrated
in Figure 5, described by the MOS as a function of the data
rate R
k
of user k ∈ K
MOS
k
R
k
=
⎧
⎪
⎪
⎪
⎪
⎪
⎨
⎪
⎪
⎪
⎪
⎪
⎩
1:R
k
≤ R
1.0,k
,
MOS
0,k
log
R
k
R
0,k
: R
1.0,k
<R
k
<R
4.5,k
,
4.5:R
k
≥ R
4.5,k
,
(4a)
with
MOS
0,k
=
3.5
log
R
4.5,k
/R
1.0,k
,(4b)
R
0,k
= R
1.0,k
R
1.0,k
R
4.5,k
1/3.5
,(4c)
0
≤ R
1.0,k
<R
4.5,k
∀k ∈ K. (4d)
The semilogarithmic plot of Figure 5 visualizes the related
parameters: the parameter MOS
0,k
determines the slope of
MOS
k
(R
k
) while R
0,k
shifts the curve along the X-axis.
Each user’s application characteristic can be
parametrized by only two parameters,
{R
1.0,k
, R
4.5,k
},or
alternatively
{MOS
0,k
, R
0,k
}. The optimizer then tunes the
model by maximizing the user-perceived quality and returns
the set of optimum user data rates to the APP layer.
3.2. Parameter Exchange
3.2.1. System Description. Figure 3 shows a block diagram of
the considered CLO framework and illustrates the signal flow
of the exchanged control information between optimizer and
layers. In order to formally describe the proposed model-
based method of parameter exchange and optimization, we
define the vector
R
max
R
max,1
, ,R
max,K
T
(5)
containing the maximum data rates of all users, the vector
α
α
1
, ,α
K
T
(6)
containing the optimization coefficients, the vector
R
R
1
, ,R
K
T
(7)
containing the actual data rates of all users, and the vector
U
U
1
, ,U
K
T
. (8)
The parameter U
k
describes the application characteristic for
user k,whichisR
1.0,k
and R
4.5,k
for the APP layer model from
Section 3.1.2. In addition more detailed information about
the applications in a real system may also be contained in U
k
.
The link layer model described in Section 3.1.1 is defined
by the vector function f
L
( f
L,1
, , f
L,K
)
T
with elements
f
L,k
: α
k
, R
max,k
−→ R
k
= f
L,k
α
k
,(9)
which is given by (1). This means that based on the opti-
mization coefficients α, which reflect the resource allocation
on the link layer, the achievable data rates R of the users are
determined.
The application layer models detailed in Section 3.1.2,
f
A
( f
A,1
, , f
A,K
)
T
, are defined by the relationship
f
A,k
: U
k
, R
k
−→ MOS
k
= f
A,k
R
k
. (10)
That means for each application k there is a corresponding
application model f
A,k
available at the optimizer. The
application model establishes a relationship between the data
rate R
k
and a utility metric. As common utility metric the
mean opinion score MOS
k
is used, defined by the vector
MOS
MOS
1
, ,MOS
K
T
(11)
containing the MOS of all users, which according to Figure 3
is delivered to the optimizer.
The optimizer uses a utility function
f
O
: f
A,1
, , f
A,K
−→ f
O
f
A,1
, , f
A,K
(12)
providing a relationship between applications. The utility
function should be symmetric regarding a permutation of its
arguments and monotonic for each argument. We decide to
maximize the sum of the MOSs of all applications and choose
the utility function
f
O
f
A,1
, , f
A,K
=
k∈K
f
A,k
. (13)
Using this utility function, the optimization problem
arg max
{α
1
, ,α
K
}
f
O
f
A,1
f
L,1
α
1
, , f
A,K
f
L,K
α
K
(14a)
subject to
0
≤ α
k
∀k ∈ K,
k∈K
α
k
= 1 (14b)
is to be solved, which delivers α
opt
and via (1) also R
opt
.
The optimizer outputs the resource assignments α
opt
and rate
allocation R
opt
to the MAC and APP layer, respectively.
3.2.2. Required Overhead. Reviewing the exchanged param-
eters, we notice that the vectors R
max
and α contain
only long-term information. No instantaneous CSIT, power
allocation, modulation, or schedules have to be exchanged
between PHY/MAC layer and the optimizer. Likewise the
APP layer model specified in Section 3.1.2 is determined
by only two parameters that are slowly time varying. This
has the advantage that the system is less sensitive against
delays caused by parameter exchange between layers and
the optimizer. Robustness against delays is of importance
for CLO as base station and application server are most
likely located at different physical locations so that control
information is to be exchanged over the core network.
If the principles of conventional CLO systems [21]are
applied to our case, all considered schedules have to be
6 EURASIP Journal on Wireless Communications and Networking
Table 1: Number of exchanged parameters.
Number of slots
N
slot
52 8
Number of users
K 28
Exchanged
parameters for:
all possible schedules
K
N
slot
+1
+1 9.0e15 1.3e8
only schedules with
different data rates
K
K + N
slot
− 1
!
N
slot
!(K − 1)!
+ 1 107 5.1e4
model-based proposal
2K
− 1315
transmitted from the link layer to the optimizer. For each
schedule at least the K data rates that the users achieve are
transmitted. For N
slot
slots there are
K
N
slot
(15)
permutations (each representing one possible schedule).
However, since a PGPS scheduler does not utilize channel
knowledge, all slots may be considered equally. The sched-
uler’s task is to assign K users to N
slots
slots (which means to
find all combinations of K elements, N
slots
at a time) whereas
one user may be scheduled in multiple slots (repetitions are
allowed). Hence, the actual number of schedules is smaller
than (15) and is given by [27]
⎛
⎝
K + N
slot
− 1
N
slot
⎞
⎠
=
K + N
slot
− 1
!
N
slot
!(K − 1)!
. (16)
This means that for the conventional system [21]
K
K + N
slot
− 1
!
N
slot
!(K − 1)!
(17)
data rate values have to be transmitted to the optimizer and
one value is fed back as the chosen schedule.
Ta ble 1 shows some numerical examples for the num-
ber of exchanged parameters. Although conventional CLO
attains a significant reduction of exchanged parameters by
intralayer optimization, which allows to consider only a
subset of schedules (16), the control information overhead
may still be prohibitive for a high number of users and
slots. In contrast, the proposed parameter abstraction needs
to transmit only K data rates from the link layer to the
optimizer, while K
− 1 values are fed back. Of particular
advantage is the fact that the control information overhead
is independent of the number of slots N
slot
.
4. Opt i mum Resource Assignment
Based on the model-based CLO framework the optimum
resource allocation assuming an idealized utility is derived in
closed form in this section. The mathematical analysis is the
basis of an optimization algorithm presented in Section 5,
which maximizes a more realistic utility.
4.1. Problem Statement. The objective is to maximize the
sum MOS of all users. With the specific link model (1)and
application model (4) the optimization problem (14)canbe
formulated as follows:
α
opt
= arg max
α
k∈K
MOS
k
R
k
=
arg max
α
k∈K
MOS
k
α
k
R
max,k
(18a)
subject to
0
≤ α
k
∀k ∈ K,
k∈K
α
k
= 1. (18b)
As the above optimization problem is neither convex nor
concave, we first define an idealized utility that produces a
concave optimization problem.
4.2. Unbounded Application Characteristic. Removing the
bounds in the application model (4) results in an unbounded
logarithmic relation between utility metric and data rate. The
unbounded optimization problem is formulated as:
α
opt
= arg max
α
k∈K
MOS
0,k
log
α
k
R
max,k
R
0,k
(19a)
subject to
0
≤ α
k
∀ k ∈ K , (19b)
k∈K
α
k
= 1. (19c)
The optimization (19a) can be simplified as:
α
opt
= arg max
α
k∈K
MOS
0,k
log α
k
= arg max
α
f
α, MOS
0
(20)
with the equivalent utility function
f
α, MOS
0
k∈K
MOS
0,k
log α
k
. (21)
The vector MOS
0
(MOS
0,1
, ,MOS
0,K
)
T
contains coeffi-
cients that characterize the K applications as defined in (4b).
Note that f (α, MOS
0
) and, hence, the solution of the
unbounded optimization problem is independent on the
physical radio channel, characterized by R
max,k
,andonly
depends on MOS
0
, which is determined by the ratio between
R
1.0,k
and R
4.5,k
.
For finding a closed form solution of the optimum
resource assignment α
opt
in (19), in the following we
prove the concavity of the optimization problem, derive the
optimum share of resources between two users, and find a
solution for the absolute resource share of a user.
Reformulating the constraint (19c)as:
α
= 1 −
k∈K
k
/
=
α
k
, ∈ K (22)
EURASIP Journal on Wireless Communications and Networking 7
and inserting the result into (21) yields
f
α, MOS
0
=
k∈K
k
/
=
MOS
0,k
log α
k
+MOS
0,
log
⎛
⎜
⎜
⎝
1 −
n∈K
n
/
=
α
n
⎞
⎟
⎟
⎠
.
(23)
Now, the first and second partial derivatives in directions of
α
k
and α
m
can be determined,
∂f
∂α
k
k
/
=
=
MOS
0,k
α
k
−
MOS
0,
1 −
n∈K,n
/
=
α
n
, (24)
∂
2
f
∂α
2
k
k
/
=
=−
MOS
0,k
α
2
k
−
MOS
0,
1 −
n∈K,n
/
=
α
n
2
, (25)
∂
2
f
∂α
k
∂α
m
k,m
/
= ,k
/
= m
=−
MOS
0,
1 −
n∈K,n
/
=
α
n
2
. (26)
Considering (4b)and(4d), it follows that MOS
0,k
> 0 ∀k ∈
K so that
∂
2
f
∂α
2
k
< 0 ∀k ∈ K
(27)
and
∂
2
f
∂α
k
∂α
m
< 0 ∀k ∈ K.
(28)
This means that the graph is strictly concave downwards
and any extremum not being located on the domain borders
maximizes the utility. Therefore, provided for all k
∈ K the
following condition is satisfied
∂f
∂α
k
k
/
=
= 0, (29)
the global maximum is found. Setting (24)tozeroyields
MOS
0,
MOS
0,k
+1
α
k
= 1 −
n∈K
n
/
= ,k
α
n
. (30)
Likewise, the optimum share for user , α
, when α
k
is fixed,
is determined by differentiating (24)withrespecttoα
and
setting the result to zero, which corresponds to swapping
users k and in (30). By combining the result with (30) the
dependency to other users n
/
= k, disappears. This means
that the relation between the optimum resource assignments
of any two users, k and , is independent of all other users’
utility functions. After some algebraic manipulations the
relation
α
k
=
MOS
0,k
MOS
0,
α
(31)
between the optimization coefficients of users k and is
obtained.
For finding an absolute value for the optimization
coefficients α the relation (31) is inserted into the constraint
(19c), which yields
α
=
MOS
0,
k∈K
MOS
0,k
(32)
as the final solution of the unbounded optimization problem
(19).
As a special case it can be easily seen from (32) that if all
users have the same parameter MOS
k
, then the resources are
distributed equally to the users,
MOS
0,1
=··· = MOS
0,K
=⇒ α
k
=
1
K
∀k ∈ K. (33)
Interestingly, given that all users use the same application, the
optimum resource allocation for the unbounded problem
results in an equal resource scheduler where all users are
assigned the same number of slots. This implies that users
experiencing a good channel receive higher data rates and
therefore enjoy better QoS, as adaptive transmission is more
bandwidth efficient in this case.
In summary, the optimum resource allocation for the
unbounded optimization problem (32) is independent of
the channel conditions; the number of assigned slots (the
allocated bandwidth) is exclusively determined by the appli-
cation characteristics; users with a good channel enjoy higher
data rates. On the other hand, all users are given a fair share
of the available resources. This is in a sharp contrast to a
maximum throughput scheduler, which exclusively serves
good users while users experiencing a poor channel starve
for resources. The significance of this finding is that the
maximized utility in (19) is an idealized measure of user-
perceived quality.
4.3. Subset of Users. For solving the bounded optimization
problem (18), it is useful to solve the unbounded problem
only for a subset of “variable” users K
var
∈ K.The
remaining users K
fix
= K \ K
var
have fixed optimization
coefficients α
k
and are not subject to optimization. Here, the
notation K
\ K
var
denotes the relative complement of set
K
var
in set K.
The constraint (19c)isrewrittenas
k∈K
var
α
k
= 1 −
m∈K
fix
α
m
. (34)
Following the derivation in Section 4.2, inserting (31)gives
k∈K
var
MOS
0,k
MOS
0,
α
= 1 −
m∈K
fix
α
m
, (35)
which finally yields
α
=
1 −
m∈K
fix
α
m
MOS
0,
k∈K
var
MOS
0,k
. (36)
8 EURASIP Journal on Wireless Communications and Networking
5. Optimization Algorithm Maximizing
the User-Perceived Quality
Based on the analytical solution for the unbounded problem
in Section 4, an optimization algorithm for the bounded
problem (18) is presented in this section. In an intermediate
step a solution for the upper bounded problem is derived,
where the application characteristic MOS
k
(R
k
)isupper
bounded at an MOS of 4.5. Then the solution of the bounded
problem is developed, and its computational complexity is
assessed. Finally, the proposed CLO algorithm is extended to
support different priority classes.
5.1. Upper Bounded Problem. We define the upper bounded
application characteristic by
MOS
u
k
R
k
=
⎧
⎪
⎪
⎨
⎪
⎪
⎩
MOS
0,k
log
R
k
R
0,k
: R
k
<R
4.5,k
,
4.5:R
k
≥ R
4.5,k
,
(37)
which gives the upper bounded optimization problem
arg max
α
k∈K
MOS
u
k
α
k
R
max,k
(38a)
subject to
0
≤ α
k
∀k ∈ K,
k∈K
α
k
= 1. (38b)
Let R
opt,k
= α
opt,k
R
max,k
denote the optimum rate
allocation of user k of the unbounded problem (32). In case
R
opt,k
>R
4.5,k
, the rate for user k may be reduced to R
4.5,k
without sacrificing service quality, and the retained resources
can be given to users with R
opt,
<R
4.5,
,
/
= k. A solution of
this concave problem is found by the iterative algorithm:
Step 1. Initially, K
fix
= ∅ and K
var
= K .
Step 2. Solve unbounded problem (36).
Step 3. Users with R
opt,k
≥ R
4.5,k
are moved from K
var
to K
fix
and set α
k
= R
4.5,k
/R
max,k
.
Step 4. If any user has been moved in Step 3,continuewith
Step 2, otherwise stop.
If any of the application characteristics deviates from
(4), Step 2 can be replaced by a conventional algorithm that
solves the unbounded problem. Alternatively, appropriate
values for R
1.0,k
and R
4.5,k
can be chosen to approximate
the real application characteristic, giving rise to a certain
deviation to the exact solution. Optionally, this approxi-
mation could be used as a starting point for an applicable
conventional algorithm.
5.2. Bounded Problem. We approach the bounded optimiza-
tion problem (18) by dividing it into two subproblems:
first, a subset of users is determined who cannot be served
and therefore get no resources, α
k
= 0; second, for the
remaining users the upper bounded optimization problem
from Section 5.1 is solved. In case dropped users are selected
appropriately in the first step, the remaining served users will
always achieve data rates R
k
>R
1.0,k
so that the solution for
the bounded problem is optimum.
The following iterative algorithm for the solution of the
bounded problem is formulated as follows.
Step 1. Initially, all users are served.
Step 2. DropusersasdetailedinSteps2.1–2.4.
Step 2.1. If stop
criterion is fulfilled, continue with
Step 3.
Step 2.2. Solve upper bounded problem for the served users
as described in Section 5.1.
Step 2.3. User k
drop
= arg max
k
k
,k
/
= k
MOS
u
k
is dropped by
setting α
k
drop
= 0.
Step 2.4. Continue with Step 2.1.
Step 3. Solve upper bounded problem for the served users as
described in Section 5.1 and stop.
In this algorithm the stop
criterion determines how
many users are served. When the objective is to maximize the
sum of all users’ MOS, referred to as “increase sum MOS”, an
appropriate strategy is to continue dropping users until this
does not further improve the sum MOS.
An alternative stop
criterion is to check
α
k
− α
stop,k
> 0 ∀k, (39a)
where
α
stop,k
α
k
| MOS
k
α
k
=
MOS
stop,k
. (39b)
This condition checks whether the MOS that would be
achieved with the allocated resources α
k
exceeds a certain
minimum MOS
stop,k
∈ [1, 4.5]. Setting MOS
stop,k
= 1 ∀k ∈
K ensures that only a minimum of users are dropped,
while no resources are wasted to users that would anyhow
experience unacceptable service quality of MOS
k
(α
k
) =
1. On the other hand, higher values of MOS
stop,k
enforce
a certain minimum perceived quality. This variant of the
algorithm is therefore termed “reduce outage”.
As the above discussion touches upon the issue of
admission control, other criteria that determine which
users are admitted to the system might be introduced. For
example, in a cellular system it might be desirable to give
priority to users that hand over from a neighboring cell
rather than to serve a user who wishes to enter the network.
5.3. Computational Complexity. An appealing feature is
that the proposed optimization algorithm deterministically
terminates after a certain time. To prove this the worst case
run time is calculated in the following. Since in each iteration
at least one user is dropped, there are at most K iterations
EURASIP Journal on Wireless Communications and Networking 9
in the outer loop. The inner loop computes the solution of
the upper bounded problem. In the worst case, one user is
moved from K
var
to K
fix
so that the number of iterations at
most equals the number of served users. The total number of
iterations is therefore upper bounded by K(1 + K)/2.
An observation from the simulation results in Section 6
is that typically most users can transmit. Hence, the number
of iterations for the outer loop is likely to be significantly
smaller than K. Likewise, trials suggest that for the inner
loop it is rather unlikely that more than two iterations are
required. Since the essential calculation within the inner
loop is given by the closed form expression (36), the total
complexity of the optimization algorithm is low.
5.4. Priority Classes. Inordertosupportdifferent priority
classes, the utility function is adjusted in the following.
Let λ
k
∈ R be a real number that reflects the priority of
user k where, without loss of generality, λ
k
>λ
indicates
that user k has a higher priority than user .Priority
classes are incorporated to the utility function by substituting
the application dependent constant MOS
0,k
in (19) by the
function g
k
(MOS
0,k
, λ
k
), that is,
k∈K
g
k
MOS
0,k
, λ
k
log
α
k
R
max,k
R
0,k
. (40)
In the calculation of the first and second partial deriva-
tives in direction of α
k
and α
m
in (24), (25), and (26), MOS
0,k
is treated as a constant. Therefore, the derivation of the
unbounded optimization problem in Section 4.2 also applies
to the priority function g
k
(MOS
0,k
, λ
k
), if the following
condition holds
∂g
k
MOS
0,k
, λ
k
∂α
= 0 ∀{k, }∈K
2
. (41)
Likewise, (4b)and(4d) strictly require a positive constant
MOS
0,k
, which translates to
g
k
MOS
0,k
, λ
k
> 0 ∀k ∈ K. (42)
Under these conditions, the conclusions from Section 4.2
apply: the utility function that supports priority classes
(40) is strictly concave downwards, and the underlying
optimization problem is solved by substituting MOS
0,k
with
g
k
(MOS
0,k
, λ
k
)in(31), (32), and (36).
An intuitive realization of a priority function that satisfies
the constraints (41)and(42)isgivenby
g
k
MOS
0,k
, λ
k
=
λ
k
MOS
0,k
, λ
k
> 0 ∀k ∈ K , (43)
which is similar to the approach described in [19]. This
function is applied for obtaining the numerical results
presented in Section 6.5.
There are several possibilities how to further incorporate
priority classes, for example, by adjusting the upper bound of
the upper bounded optimization problem, the stop criterion
or by using an alternative criterion for dropping users.
Table 2: Link layer parameters.
Transmission scheme OFDMA
Number of subcarriers N
= 416
Cyclic prefix duration 3.2 μs
Symbol mapping BPSK, 4-, 16-, 64-QAM
Channel coding Convol., R
c
∈
1
4
,
1
3
,
1
2
,
9
16
,
2
3
,
3
4
Channel bandwidth B = 16.25 MHz
Channel model WINNER urban macro-cell [28]
Duplex ratio DL/UL 1/1
Cell radius 50
···500 m
Shadowing log-normal, σ
s
= 8dB
Path loss 38.4dB+35.0dBlog
10
(d/m)
Center frequency f
0
= 5.25 GHz
Tr ansmit po wer 1 0 W
Antenna gain 8 dBi
Noise figure 7 dB
Noise spectrum density
−174 dBm/Hz
Delay spread τ
ds
= 313 ns
Maximum Doppler speed v
= 50 km/h
Slot size (freq.
× time) 8 × 12
Number of users K
= 1, ,64
Number of available slots N
slot
= 52
Scheduler PGPS
6. Performance Evaluation
The performance of the proposed CLO framework is evalu-
ated by means of system simulations. The link layer param-
eters listed in Tab le 2 mostly follow the WINNER (World
Wireless Initiative New Radio, URL: www.ist-winner.org)
system concept [2].
6.1. Simulation Setup. We consider an OFDMA downlink
that occupies a bandwidth of B
= 16.25 MHz. Due to
the inherent orthogonality of orthogonal frequency division
multiplexing (OFDM), each subcarrier in each OFDM
symbol may be assigned to a different user without causing
interference, so that users can be scheduled independently
in time and frequency. Adjacent subcarriers and OFDM
symbols are correlated and, therefore, experience a similar
channel gain. In order to limit the signaling overhead 8
× 12
symbols are grouped to form one slot.
The WINNER typical urban macrocell channel (model
C2 [28]) is used, which models channel attenuation due
to frequency selective fading, distance dependent path loss
and log-normal shadowing [29]. Instantaneous channel
variations due to velocities of mobile users are generated
using Jakes’ model [30]. The channel model is implemented
such that the average SNR always allows transmission with
the lowest supported modulation and coding scheme. This
is motivated by the fact that users with lower SNR would
not be able to establish a connection to the base station and,
hence, cannot request to be served. While the average SNR
10 EURASIP Journal on Wireless Communications and Networking
Data rate R
max,k
(Mbit/s)
0
10
20
30
40
50
60
70
Signal-to-noise ratio (dB)
−5 0 5 1015202530
BPSK, R
c
=
1
4
BPSK, R
c
=
1
3
QPSK, R
c
=
1
4
QPSK, R
c
=
1
3
QPSK, R
c
=
1
2
QPSK, R
c
=
9
16
QPSK, R
c
=
2
3
QPSK, R
c
=
3
4
16QAM, R
c
=
1
2
16QAM, R
c
=
9
16
16QAM, R
c
=
2
3
16QAM, R
c
=
3
4
64QAM, R
c
=
9
16
64QAM, R
c
=
2
3
64QAM, R
c
=
3
4
Figure 6: Adaptive modulation: relation between instantaneous
data rate and signal-to-noise ratio (SNR).
always exceeds the given limit, the instantaneous SNR may
be significantly lower due to frequency selective fading.
Mobile velocities up to v
= 50km/h are assumed, which
implies that instantaneous CSIT may not be available. It
is assumed that the average SNR over all simultaneously
transmitted slots is available for link adaptation. Hence,
the same modulation and coding scheme is applied to all
subcarriers of one user during one slot duration. However,
slots assigned to different users will typically use a different
modulation and coding scheme.
The transmitter chooses the symbol mapping with
cardinality M and code rate R
c
of a convolutional code, based
on the average SNR of each user k (see Figure 6). Note that
due to half-duplex transmission the average data rate is only
half of the instantaneous data rates indicated in Figure 6.The
modulation and coding scheme is selected that achieves the
largest spectral efficiency η
k
= R
c
log
2
M at a frame error
rate (FER) of 10
−2
.TheSNRvaluesforwhichFER= 10
−2
are determined by reference simulations and are stored in a
look-up table. It is assumed that an ARQ protocol at the link
layer takes care of error events by retransmitting erroneously
received packets. Due to the low occurrence of errors at
FER
= 10
−2
retransmissions only have marginal impact on
the throughput and will therefore not affect the perceived
quality. Hence, simulations assume that packets are always
received error free.
For CLO the long-term average data rate R
max,k
= η
k
N
slot
for each user k indicates the link capacity and is the relevant
abstraction of the link layer. Figure 7 shows the cumulative
distribution function (CDF) of R
max,k
, which is averaged over
a large number of randomly chosen channel realizations and
user locations within a cell.
Simulations are executed as follows: every 100 millisec-
onds independent shapshots of path loss and shadowing
Cumulative distribution
10
−2
10
−1
10
0
Data rate R
max,k
(bit/s)
10
6
10
7
10
8
Figure 7: CDF of maximum data rate R
max,k
, which characterizes
the communications channel on the link layer.
realizations are generated for each user according to a
uniform user distribution within the cell area. Then R
max
is estimated and passed to the optimizer. CLO is performed
to determine the optimum share of resources α
opt
,whichis
subsequently fed back to the PGPS scheduler at the MAC
layer.
After the 100-millisecond snapshot, the actually achieved
average data rates are determined. The actually achieved data
rates may deviate from the optimizer’s estimate R
max
.Each
user’s MOS is determined based on the user’s application and
the achieved data rate. Then, the CDF of the MOS averaged
over all users is calculated.
6.2. Performance of Different Optimization Algorithms. In
Figure 8, the CDF of the MOS is shown for the different
resource allocation strategies and optimizer variants dis-
cussed in Section 5. The applications of all K
= 16 users
are described by the same parameters R
1.0
= 100 kbit/s
and R
4.5
= 1 Mbit/s (compare Figure 5). As a reference
equal resource allocation with α
k
= 1/16 for all 16 users is
also plotted, which is the optimum resource assignment of
the unbounded optimization problem (19) (see Section 4.2).
Greedy resource allocation [19], as a conventional technique
for solving optimization problems, is also included for
comparison. From our experience the Greedy algorithm
is significantly more computationally expensive than the
proposed CLO algorithm. The other two curves show the
performance of the proposed algorithm, the “increase sum
MOS,” and the “reduce outage” variants, where the stop
criterion is set to MOS
stop,k
= 1 ∀k ∈ K .
As seen in Figure 8, both variants outperform equal
resource allocation and achieve a comparable average MOS
as greedy resource allocation. Compared to equal resource
allocation, any performance improvement of the considered
optimization algorithms is due to the bounds in the MOS
trajectory, since users with R
k
= R
max,k
/16 >R
4.5
perceive
the same QoS as if they were served with the reduced rate
R
k
= R
4.5
. Likewise, users with R
k
<R
1.0
perceive the same
QoS as a user who is not served at all. The “reduce outage”
EURASIP Journal on Wireless Communications and Networking 11
Cumulative distribution
0
0.1
0.2
0.3
0.4
0.5
0.6
Mean opinion score
11.522.533.544.5
Equal resources,
MOS = 3.818
Reduce outage,
MOS = 4.02
Greedy allocation,
MOS = 4.024
Increase sum MOS,
MOS = 4.033
Figure 8: CDF of perceived quality for different optimization
algorithms.
variant serves practically all users, although some perceive a
poor service quality. In contrast, the “increase sum MOS”
variant tends to drop users with poor quality and assigns
the freed resources to served users. This is due the objective,
which aims to maximize the sum MOS of all users: a user
will be dropped, if the increase in MOS of the served users
outweighs the decrease in MOS of dropping a certain user.
6.3. Deviation due to Application Model Abstraction. In
Section 6.2, the application is characterized by the idealized
bounded logarithmic relationship (4), so that the APP layer
model at the optimizer perfectly matches the application
characteristics. In order to assess the benefits of CLO in a
real system with real applications running, a video streaming
example is chosen where the user-perceived quality is
approximated as described in Section 2.2.1. Eight different
H.264/MPEG-4 AVC videos in common intermediate format
(CIF) resolution at 30 Hz frame rate are cut into snippets
containing one group of pictures (GOP) each. With a GOP
size of 32 frames the snippets contain approximately 1 second
of video. Further parameters of the videos are summarized
in Tables 3 and 4. The snippets are subsequently analyzed to
extract the parameters a, b,andc for each snippet.
In order to assess the effect of rate variations of the video
stream over time, for each 100-millisecond PHY channel
snapshot a new (random) snippet of the respective video
stream is used. For the proposed optimization algorithm
from Section 5 the parameters R
1.0,k
and R
4.5,k
are estimated
by the application server for each video snippet and provided
to the CLO. Because the optimization algorithm is based
on the bounded logarithmic relationship (4), which deviates
from the actually used video model (3), the decided resource
distribution will be suboptimum. For comparison CLO with
greedy optimization using the exact video model (3) is also
simulated.
Table 3: Video parameters.
Video coding H.264/MPEG-4 AVC [7]
Implementation JSVM 9.12.2, 25 April 2008 [31]
Resolution CIF (352
× 288)
Frame rate 30 Hz
Chroma subsampling 4:2:0
GOP size 32
GOP coding structure I-P-
···-P
PSNR range PSNR
1.0
= 30 dB, PSNR
4.5
= 42 dB
Table 4: Transmitted video streams.
Video name
Duration
(GOP)
Average desired
data rate
R
4.5
Ratio R
4.5
/R
1.0
Foreman
9 2, 156 kbit/s 18
Mother
9 447 kbit/s 26
News
9 638 kbit/s 11
Container
9 1, 159 kbit/s 22
Salesman
9 2, 265 kbit/s 40
Bus
4 4, 141 kbit/s 7
City
9 2, 202 kbit/s 13
Crew
9 2, 677 kbit/s 15
As seen in Figure 9, for the considered real video streams
similar conclusions as for the generic applications from
Section 6.2 can be drawn. The considered optimizers exhibit
similar performance, achieving a significantly superior MOS
with respect to equal resource allocation.
6.4. Guaranteed Service Quality. It may be desirable to
support the demand for minimum QoS. This may be accom-
plished by tuning the parameter MOS
stop
of the stop criterion
in the “reduce outage” variant of the proposed optimization
algorithm. As the stop criterion controls which users are
dropped from the list of active users (see Section 5.2), setting
MOS
stop
to a value in the range [1, 4.5] ensures that all
served users achieve at least a minimum perceived quality of
MOS
stop
.
Figure 10 shows the CDF of the achieved sum MOS for
MOS
stop
= 2.0andMOS
stop
= 3.0. The higher MOS
stop
the less users achieve the required data rates due to poor
channel conditions and are therefore not served. On the
other hand, the served users with better channels benefit
from freed resources of the dropped users, which improves
their perceived quality.
Figure 11 shows the MOS, averaged over all users and
channel realizations, against MOS
stop
. The choice of MOS
stop
affects the overall perceived quality and the maximum is
approached for MOS
stop
≈ 2. In case MOS
stop
< 2, users
with poor channels are served, which have only a marginal
contribution to the overall sum MOS. On the other hand,
if MOS
stop
> 2, an increasing number of users are denied
service, which cannot be compensated by the enhanced QoS
12 EURASIP Journal on Wireless Communications and Networking
Cumulative distribution
0
0.1
0.2
0.3
0.4
0.5
0.6
Mean opinion score
11.522.533.544.5
Equal resources,
MOS = 3.827
Reduce outage,
MOS = 4.072
Greedy allocation,
MOS = 4.079
Increase sum MOS,
MOS = 4.089
Figure 9: CDF of the perceived quality for video streaming with
nonconcave application characteristic.
Cumulative distribution
0
0.05
0.1
0.15
0.2
0.25
0.3
Mean opinion score
11.522.533.544.5
MOS > 3
Increase sum MOS
MOS > 2
Figure 10: CDF of the perceived quality for different minimum
MOS constraints MOS
stop
. For comparison the “increase sum MOS”
variant is also included.
of the remaining active users. The perceived quality achieved
by the “increase sum MOS” variant, which approximates the
maximum sum MOS, is also indicated in Figure 10.
6.5. Traffic Priority Classes. The performance of CLO
supporting different traffic priority classes developed in
Section 5.4 is examined in Figure 12.TheK
= 16 users, all
running the same applications, are split up into two priority
groups of 8 users each; premium and ordinary users are given
apriorityofλ
k
= 2andλ
k
= 1, respectively.
Figure 12 shows the CDF of the sum MOS. Premium
users exhibit a significantly better MOS than ordinary users
and are more likely to be served.
Average mean opinion score
3.8
3.85
3.9
3.95
4
4.05
4.1
Guaranteed mean opinion score MOS
stop
11.522.533.544.5
Increase sum MOS bound
Reduce outage
Figure 11: Average MOS as a function of the minimum MOS
constraints MOS
stop
.
Cumulative distribution
0
0.1
0.2
0.3
0.4
0.5
0.6
Mean opinion score
11.522.533.544.5
Equal resources,
MOS = 3.818
Ordinary users,
MOS = 3.77
No priorities,
MOS = 4.033
Premium users,
MOS = 4.21
Figure 12: CDF of the perceived quality for ordinary and premium
traffic.
6.6. Application Characteristic. In order to identify for which
application characteristics CLO is most effective, different
generic application classes are examined, characterized by
their relationship between data rate and perceived quality
as described by the parameters R
1.0
and R
4.5
(see Figure 5),
for the “increase sum MOS” variant of the proposed
optimization algorithm. The application characteristics are
the same for all users and R
4.5
= 10R
1.0
is chosen. Figure 13
shows the average MOS against the required data rate for a
maximum perceived quality of R
4.5
,forasystemwithK = 16
users.
As seen from Figure 13, the attainable gains of CLO
maximizing the sum MOS (solid lines) over equal resource
EURASIP Journal on Wireless Communications and Networking 13
Mean opinion score
3
3.5
4
4.5
Demanded data rate R
4.5
(bit/s)
10
5
10
6
R
4.5
/R
1.0
= 10
R
4.5
/R
1.0
= 100
Figure 13: Impact of rate-distortion characteristic on the average
MOS. Solid and dashed lines show results for the proposed CLO
and equal resource allocation, respectively.
Mean opinion score
1
2
3
4
Data rate
R
low
R
high
Low-rate users
High-rate users
Figure 14: Example characteristic for two user groups running
different application classes.
allocation (dashed lines) are dependent on both R
4.5
and
the ratio R
4.5
/R
1.0
. For low data rate requirements the CLO
gain diminishes, as there is an excess of available resources
to serve all users with excellent quality MOS
= 4.5. For
increasing data rate requirements the CLO gain depends on
the ratio R
4.5
/R
1.0
, in the way that the CLO gain increases
with decreasing R
4.5
/R
1.0
. This is explained by the fact that
for an increasing ratio R
4.5
/R
1.0
the MOS characteristic as
a function of the data rate, MOS
k
(R
k
)in(4), approaches
the unbounded problem addressed in Section 4.2,forwhich
according to (33) equal resource allocation is optimum. In
other words, the attainable CLO gains over equal resource
allocation with α
k
= 1/K are due to users whose rates R
k
=
R
max,k
/K are outside the logarithmic range of MOS
k
(R
k
).
As the logarithmic range is specified by the ratio R
4.5
/R
1.0
,
the lower R
4.5
/R
1.0
the higher the gains to be achieved by
optimization.
6.7. Mixed Service Classes. In Figures 14–16 a scenario with
two user groups is investigated. Each of the two user groups
run applications of a different service class, characterized by
different data rate requirements, as illustrated in Figure 14.
Low- and high-rate users request a minimum data rate R
1.0
=
R
low
and R
1.0
= R
high
,respectively.
Mean opinion score gain
0
0.05
0.1
0.15
0.2
0.25
0.3
0.35
Number of high-rate users
0481216
R
low
= 2 × 10
4
bit/s, R
high
= 2 × 10
5
bit/s
R
low
= 6 × 10
4
bit/s, R
high
= 1.8 × 10
5
bit/s
R
low
= 2 × 10
4
bit/s, R
high
= 6 × 10
4
bit/s
Figure 15:GaininaverageMOSfordifferentratiosoflow-rateand
high-rate users.
Cumulative distribution
0
0.2
0.4
0.6
0.8
1
Mean opinion score
11.522.533.544.5
Equal resources
Optimization
High-rate users
Low-rate users
Figure 16: CDF of the perceived quality for two application classes.
Both high- and low-rate users benefit from CLO.
Figure 15 shows the CLO gain in sum MOS relative to
equal resource allocation against the number of users in each
group. Results are plotted for different values of R
high
and
R
low
,foratotalnumberofK = 16 users and R
4.5
/R
1.0
=
10. Interestingly, in some cases the overall MOS gain for
scenarios with mixed service classes exceeds the case when
all users are within either of the service classes. This is due
to the freed resources by replacing a high-rate user by a less
demanding low-rate user, which allows the remaining users
to fetch some of the freed resources.
The relationship between low- and high-rate users is
further investigated in Figure 16, which shows the CDF of
the sum MOS for both user groups. Corresponding to the
14 EURASIP Journal on Wireless Communications and Networking
Mean opinion score
3
3.5
4
4.5
Number of users
10 20 30 40 50 60 70 80
Scenario 2
Scenario 1
Figure 17: Overall gain achieved by CLO in terms of number
of served users K. Solid and dashed lines correspond to the
CLO variant “increase sum MOS” and equal resource allocation,
respectively.
maximum in Figure 15, there are 4 users with R
low
= 6 ×
10
4
bit/s and 12 users with R
high
= 1.8 × 10
5
bit/s. An
appealing observation is that both user groups gain from
CLO. While the average gain is ΔMOS
= 0.22, low- and high-
rate users gain ΔMOS
= 0.10 and ΔMOS = 0.26 in overall
perceived quality, respectively.
6.8. System Performance. In order to assess the attainable
MOS gains from a system level perspective, the average
sum MOS is plotted against the number of users K in
Figure 17. Two scenarios are investigated. In scenario 1,
there are two groups with equal number of users, where
low- and high-rate users request the rate R
low
= 2 ×
10
4
bit/s and R
high
= 2 × 10
5
bit/s, respectively. It can
be deduced from Figure 17 that CLO maximizing the sum
MOS (solid lines) increases the number of users being
served with the same average perceived quality by more than
60%, compared to equal resource allocation (dashed lines).
In scenario 2, all users run the same application with a
desired data rate of R
4.5
= 6 × 10
5
bit/s and R
4.5
/R
1.0
=
100, which achieves a comparably small MOS gain of at
most ΔMOS
= 0.11, as reported in Section 6.6 for K =
16 users. In scenario 2, CLO also enables to serve more
users with the same perceived quality, although in this
case the gains diminish for increasing number of users.
In line with the discussion in Section 6.6, for scenario 2
gains of CLO over equal resource allocation are mainly
in the region where the sum MOS is high, since then
users, whose rate R
k
= R
max,k
/K is outside the logarithmic
range of MOS
k
(R
k
)in(4), are more likely. Otherwise,
equal resource allocation tends to approach the optimum
resource allocation strategy, leading to diminishing CLO
gains.
7. Conclusion
Resource allocation with QoS constraints where multiple
users share a wireless downlink is one key challenge in the
design of future wireless systems. The MOS is chosen as
a universal utility metric for the user-perceived quality for
CLO between link and APP layer.
Adaptive transmission based on long-term CSIT over a
time and frequency selective fading channel is considered,
including distance dependent path loss and log-normal
shadowing. Applications are described by a rate-distortion
characteristic, expressed by the MOS. With these settings
a model-based CLO framework is devised, which emulates
the functionalities of the system layers within the optimizer.
Compared to known CLO approaches significantly less
parameters need to be exchanged. Simulations of a video
streaming scenario confirm that model mismatch, where the
APP layer model at the optimizer is not perfectly matched
to the actual application, only results in modest performance
degradation.
As a metric for the user satisfaction we chose to
maximize the sum MOS, which resulted in a nonconcave
optimization problem. Given an idealized utility metric
with an unbounded logarithmic relation between perceived
quality and data rate, a concave problem is retained, so that
the optimum resource allocation is derived in closed form.
One noteworthy result of the analysis is that the optimum
solution is independent of the physical channels and is solely
described by the application characteristics.
The theoretical findings are the basis for a low complexity
and easy to implement CLO algorithm for the more realistic
nonconcave optimization problem. The proposed iterative
optimization algorithm is significantly less complex than
known optimization algorithms and has the appealing
feature to deterministically terminate.
The proposed algorithm offers an additional degree
of freedom to the network operator to configure its own
policies, such as enhancing user satisfaction, ensuring a
minimum perceived quality to all users, or to operate the
wireless system with higher load so as to maximize revenue.
Furthermore, different priority classes can be supported.
The attainable gains of CLO strongly depend on the
application characteristics. The higher the sensitivity of the
perceived quality to changes of the data rate, the more
considerable the gains that can be achieved. Dependent
on the application more than 60%, additional users can
be served without sacrificing user satisfaction. If multiple
service classes with different application characteristic are
running simultaneously, all users can be expected to benefit
from CLO. In some cases additional CLO gains that exploit a
certain mix of service classes are observed.
Acknowledgment
This paper was presented in part at the IEEE Int. Conf. on
Communications (ICC’2007), Glasgow, UK, at the IEEE Int.
Symp. on Wireless Communication Systems (ISWCS’2007),
Trondheim, Norway, and at the IEEE Vehicular Technology
Conference (VTC’2008 Spring), Singapore.
EURASIP Journal on Wireless Communications and Networking 15
References
[1] 3GPP TS 36.211 V8.5.0 Release 8, “3rd Generation Partnership
Project (3GPP); Evolved Universal Terrestrial Radio Access (E-
UTRA); Physical Channels and Modulation,” December 2008.
[2] IST-4-027756 WINNER II, “D6.13.14 WINNER II system
concept description,” December 2007.
[3] M. Andrews, K. Kumaran, K. Ramanan, A. Stolyar, P. Whiting,
and R. Vijayakumar, “Providing quality of service over a
shared wireless link,” IEEE Communications Magazine, vol. 39,
no. 2, pp. 150–153, 2001.
[4] C. Y. Wong, R. S. Cheng, K. B. Letaief, and R. D. Murch,
“Multiuser OFDM with adaptive subcarrier, bit, and power
allocation,” IEEE Journal on Selected Areas in Communications,
vol. 17, no. 10, pp. 1747–1758, 1999.
[5]M.Ergen,S.Coleri,andP.Varaiya,“QoSawareadaptive
resource allocation techniques for fair scheduling in OFDMA
based broadband wireless access systems,” IEEE Transactions
on Broadcasting, vol. 49, no. 4, pp. 362–370, 2003.
[6] M. Sternad, T. Svensson, T. Ottosson, A. Ahlen, A. Svensson,
and A. Brunstrom, “Towards systems beyond 3G based on
adaptive OFDMA transmission,” Proceedings of the IEEE, vol.
95, no. 12, pp. 2432–2455, 2007.
[7] ITU-T Recommendation H.264, “Advanced video coding for
generic audiovisual services,” November 2007.
[8] H. Schwarz, D. Marpe, and T. Wiegand, “Overview of the
scalable video coding extension of the H.264/AVC standard,”
IEEE Transactions on Circuits and Systems for Video Technology,
vol. 17, no. 9, pp. 1103–1120, 2007.
[9] I. Ahmad, X. Wei, Y. Sun, and Y Q. Zhang, “Video transcod-
ing: an overview of various techniques and research issues,”
IEEE Transactions on Multimedia, vol. 7, no. 5, pp. 793–804,
2005.
[10] S. Shakkottai, T. S. Rappaport, and P. C. Karlsson, “Cross-
layer design for wireless networks,” IEEE Communications
Magazine, vol. 41, no. 10, pp. 74–80, 2003.
[11] S. Khan, Y. Peng, E. Steinbach, M. Sgroi, and W. Kellerer,
“Application-driven cross-layer optimization for video
streaming over wireless networks,” IEEE Communications
Magazine, vol. 44, no. 1, pp. 122–130, 2006.
[12] E.Setton,T.Yoo,X.Zhu,A.Goldsmith,andB.Girod,“Cross-
layer design of ad hoc networks for real-time video streaming,”
IEEE Wireless Communications, vol. 12, no. 4, pp. 59–64, 2005.
[13] L U. Choi, W. Kellerer, and E. Steinbach, “On cross-layer
design for streaming video delivery in multiuser wireless
environments,” EURASIP Journal on Wireless Communications
and Networking, vol. 2006, Article ID 60349, 10 pages, 2006.
[14] M. van der Schaar and N. Sai Shankar, “Cross-layer wireless
multimedia transmission: challenges, principles, and new
paradigms,” IEEE Wireless Communications,vol.12,no.4,pp.
50–58, 2005.
[15] S. Khan, S. Duhovnikov, E. Steinbach, M. Sgroi, and W.
Kellerer, “Application-driven cross-layer optimization for
mobile multimedia communication using a common applica-
tion layer quality metric,” in Proceedings of the International
Wireless Communications and Mobile Computing Conference
(IWCMC ’06), pp. 213–218, Vancouver, Canada, July 2006.
[16] A. Sang, X. Wang, M. Madihian, and R. D. Gitlin, “A flexible
downlink scheduling scheme in cellular packet data systems,”
IEEE Transactions on Wireless Communications,vol.5,no.2,
pp. 568–576, 2006.
[17] X. Zhang, M. Tao, and C. S. Ng, “Time sharing policy in wire-
less networks for variable rate transmission,” in Proceedings
of the IEEE International Conference on Communications (ICC
’07), pp. 4560–4565, Glasgow, Scotland, June 2007.
[18] ITU-T Recommendation P.800, “Methods for subjective deter-
mination of transmission quality,” International Telecommu-
nications Union, Geneva, Switzerland, August 1996.
[19] S. Khan, S. Duhovnikov, E. Steinbach, and W. Kellerer, “MOS-
based multiuser multiapplication cross-layer optimization for
mobile multimedia communication,” Advances in Multimedia,
vol. 2007, Article ID 94918, 11 pages, 2007.
[20] S. P. Boyd and L. Vandenberghe, Convex Optimization,Cam-
bridge University Press, Cambridge, UK, 1st edition, 2004.
[21] L U. Choi, M. T. Ivrla
ˇ
c, E. Steinbach, and J. A. Nossek,
“Bottom-up approach to cross-layer design for video trans-
mission over wireless channels,” in Proceedings of the 61st IEEE
Vehicular Technology Conference (VTC ’05), vol. 5, pp. 3019–
3023, Stockholm, Sweden, May-June 2005.
[22] J. Brehmer, C. Guthy, and W. Utschick, “An efficient approx-
imation of the OFDMA outage probability region,” in Pro-
ceedings of the 7th Workshop on Signal Processing Advances
in Wireless Communications (SPAWC ’06), pp. 1–5, Cannes,
France, July 2006.
[23] A. K. Parekh and R. G. Gallager, “A generalized processor
sharing approach to flow control in integrated services
networks—the single node case,” in Proceedings of the 11th
Annual Conference of the IEEE Computer and Communications
Societies (INFOCOM ’92), vol. 2, pp. 915–924, Florence, Italy,
May 1992.
[24] G. J. Sullivan and T. Wiegand, “Rate-distortion optimization
for: video compression,” IEEE Signal Processing Magazine, vol.
15, no. 6, pp. 74–90, 1998.
[25]L.U.Choi,M.T.Ivrla
ˇ
c, E. Steinbach, and J. A. Nossek,
“Sequence-level models for distortion-rate behaviour of com-
pressed video,” in Proceedings of the International Conference
on Image Processing (ICIP ’05), vol. 2, pp. 486–489, Genova,
Italy, September 2005.
[26] O. Nemethova, M. Ries, M. Zavodsky, and M. Rupp, “PSNR-
based estimation of subjective time-variant video quality
for mobiles,” in Proceedings of the International Conference
on Measurement of Audio and Video Quality in Networks
(MESAQIN ’06), Prague, Czech Republic, June 2006.
[27] E. Kreyszig, Advanced Engineering Mathematics, John Wiley &
Sons, New York, NY, USA, 7th edition, 1993.
[28] IST-2003-507581 WINNER, “D5.4 final report on link level
and system level channel models, ver. 1.4,” November 2005.
[29] T. S. Rappaport, Wireless Communications: Principles and Prac-
tice, Prentice-Hall, Englewood Cliffs, NJ, USA, 2nd edition,
2002.
[30] W. C. Jakes, Microwave Mobile Communications, John Wiley &
Sons, New York, NY, USA, 1974.
[31] Joint video team (JVT), “JSVM software manual, version
9.12.2, April 25th, 2008,” Heinrich-Hertz-Institut, June
2008, />G1/savce/downloads/SVC-
Reference-Software.htm.