Waste Management 2009 Part 5 pdf
Bạn đang xem bản rút gọn của tài liệu. Xem và tải ngay bản đầy đủ của tài liệu tại đây (750.23 KB, 18 trang )
Institutional Development in the Urban Waste Market in Portugal.
Market Structure, Regulation and Performance Analysis
65
Regional public companies include 15 concessions arrangements which had been set
between the central government and the respective companies, except one, Braval, whose
majority shareholder is the municipal company of the city of Braga (AGERE). The other ones
are owned (at least 51%) and controlled by EGF. As to the AM’s, there are currently 12 in
charge of urban waste treatment, whereas only 5 of them operate on their own behalf. The
remainders operate through regional municipal companies. The last management model is
the municipal concession, which is a simple long-term contract celebrated by a group of
municipalities (AM in this case) with a private company. There are only two cases of these
in Portugal. Table 2 shows the Portuguese waste management in the wholesale segment.
Regarding the tertiary market (recycling and reselling), the major and oldest entity is SPV,
which supports the selective collection and sorting and is also responsible for the take-back
of waste likely to be recycled. Nowadays, there are also other operators responsible for other
streams (Pássaro, 2003), such as Amb3E for electronic equipment, Valorpneu for used tires
and Ecopilhas for used batteries.
4.2.2 Retail segment
The part of the system which deals directly with the user is called retail segment. Its main
activity is the refuse collection but it can also encompass the selective collection. Other
services of its scope are relative to particular activities of collection of large volumes or even
with urban cleaning.
The retail service coincides usually with what is called the primary market, where the
service directly provided by the municipality remains the most representative. These
account for about 76% of the total served population. However, most of them contract-out
their services awarding short-term contracts (1 to 5 years). Other part of the population is
served by semi-autonomous utilities, which are endowed with financial and administrative
autonomy and control 5% of the market. Municipal companies (covering 12% of the
population) can be split into two types: the ones fully owned by the municipality (66%) and
the ones with mixed capital (34%). In both types the municipality is the major shareholder
and they are always corporate companies. There are also some particular cases where the
wholesale utility is responsible for the waste collection. The market structure of Portuguese
waste collection is presented in table 3.
Urban waste collection
Arrangement
Number Population
Directly by municipalities 218 7 510 528 (76,2%)
Semi-autonomous utilities 5 490 674 (5,0%)
Municipal companies 15 1 199 321 (12.7%)
Regional utilities 6 (40 municipalities) 596 371 (6,1%)
TOTAL 244 (278 municipalities) 9 851 424
Table 3. Urban waste market structure in Continental Portugal for the retail segment
4.3 Integration of the sector and other services
In Continental Portugal, the waste services, with few exceptions, generally are not vertically
integrated, i.e. the wholesale and retail systems are provided by different operators. In
horizontal terms, the operators have a limited degree of integration and (even after
excluding the parishes) there are 267 operators for almost 10 million inhabitants.
Waste Management
66
In the wholesale service the rule is to provide solely the waste service, but there are
exceptions. Regarding the retail waste services, it is more common to see operators
providing also other services, such as water and wastewater services and transportation.
4.4 Numbers of the sector
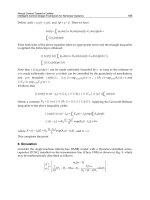
Whereas in the PERSU I, for 2005, the aim for landfill would be 25% of the urban waste
produced, the result in 2007 was 63% (APA, 2008). At the same time, this value represents
one of highest percentage of landfilling in EU-15 (Defra, 2007), as it is presented in figure 2.
This was mainly related to the lack of equipment available and how it is distributed across
the country. There are only two incinerators in Portugal, one in Lisbon and the other in
Oporto. The same happens for organic recovery equipments which are also in reduced
number at this stage.
Fig. 2. Performance management of municipal waste in EU-15 (2005)
In 2006, in Portugal 4 641 103 tons of urban waste were collected. Of this, 89,5% corresponds
to the refuse collection and only 10,5% fell within the collection of selective multi-material
and biodegradable waste. In the following year there was an increase of about 4 698 774 tons
of urban waste collected, which corresponds to 1,27 kg per inhabitant and day, a value
below the EU average. Despite this, there was a decrease in selective multi-material
collection of about 2%. Figures 3 and 4 present the evolution of waste production and
selective collection in Portugal, respectively (APA, 2008).
Between 1995 and 2006, and compared both with the EU-15 and the current EU-27 Member
States, the annual urban waste production per capita in Portugal has always remained
below the European average production per capita.
Concerning the physical characterization of the urban waste, presented in figure 5, the
biodegradable fraction corresponds to more than a quarter of the traditional waste
composition, 36%. This figure highlights the need to give priority to organic recovery,
Institutional Development in the Urban Waste Market in Portugal.
Market Structure, Regulation and Performance Analysis
67
Fig. 3. Total and per capita waste production between 1995 and 2007
Fig. 4. Refuse and selective collection between 1995 and 2007
Fig. 5. Typical characterisation of the urban waste (in terms of percentage)
Urban waste
production
Waste production
per capita
Urban waste production
(10
6
t)
Waste production per capita
(kg/inhab.day)
Urban waste (%)
Selective collection
Refuse collection
Waste Management
68
recycling, and incineration with energy recovery, against the current trend of landfill
(INETI, 2009).
In terms of waste infrastructures, the Portuguese reality (until December 2007) is indicated
in Table 4 (APA, 2008).
At this time, the national average of people per drop-off container was 322. In the region of
Lisbon and Tagus Valley, this average was 364 inhabitants per drop-off container.
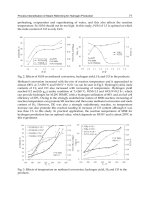
Figure 6 displays the main destinations of the urban waste in Portugal. The landfill is still
the most frequent. With the implementation of PERSU I, the waste dumps were completed
in 2001.
Infrastructures Predicted In construction Working Total
Landfill 2 2 34 38
Organic valorisation 11 2 8 21
Incineration 0 0 2 2
Transfer stations 0 2 76 78
Sorting facilities 1 2 26 29
Drop-off centre 7 0 185 192
Selective
collection
Drop-off
container
40 - 28 723 28 763
Table 4. Portuguese infrastructures for waste sector
Fig. 6. Types of urban waste treatment in Portugal
APA (2008) identified a positive relation between GDP and waste production in Portugal.
This relation provides evidence of producing waste with the wealth generated by
translating a form of eco-efficiency at the national level. It reveals that the intensity of urban
waste produced per unit of wealth in Portugal grows slightly in the period under review. In
Portugal 35,88 kilograms of waste were produced per 1000 € of GDP in 2006 (APA, 2008).
Urban waste treatment
(
%
)
Selective collectio
n
Incineratio
n
Compostin
g
Landfill
Waste dump
Institutional Development in the Urban Waste Market in Portugal.
Market Structure, Regulation and Performance Analysis
69
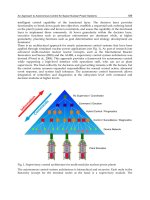
Figure 7 also allow us to observe the relative amplitude (APA, 2008) between waste
production and household expenses and compare their patterns over time. Nationally,
between 1995 and 2007, both the urban waste production and the GDP increased (about 29%
during 1995-2006), highlighting some connection between them.
5. Rules of the game
5.1 Tariff setting
In Portugal, the establishment of prices and tariffs is related to the model of waste
management in question. IRAR does not have any kind of functions regarding municipal
services (directly provided by municipality), semi-autonomous services and the different
models of municipal companies. Thus, it is the responsibility of the local administration, in
this case the Municipal Assembly, to approve the tariff systems proposed by the Municipal
Executive or by the board of directors of the semi-autonomous services. Regarding the
regional services, the assembly is responsible for approving tariffs. In the case of municipal
(or regional) companies, it is possible to find different situations, according to the nature of
the company in question. If it is an institutionalized PPP, then the General Assembly
approves the tariffs, proposed by the Board of Directors. Concerning other municipal
companies, the Town Hall or the Board of Directors approves tariffs.
Fig. 7. Evolution of household expenses and the urban waste production
Household expenses
(10
6
Euros)
Urban waste production
(t)
Waste Management
70
In municipal systems involving concession arrangements, tariffs are defined in the
concession contract signed between the concession granting authority (Town Hall) and the
concessionaire. The setting of tariffs is established in the winner bid (public tender), under
the terms of the Decree-Law No. 147/95. IRAR cannot directly interfere in tariff setting,
unless the economic and financial equilibrium of the concession is jeopardised by
unpredictable reasons when the contract is signed. In such situation, IRAR can be invited to
issue its opinion on the matter.
In regional systems, IRAR has other kind of powers, based on an investment programme
that has been defined previously as well as on the annual account report of the companies
and the respective budget. The formula for defining the tariff system proposed in the
concession contracts of regional systems consists of a hybrid methodology, based on the rate
of return regulation method established contractually and introducing a mechanism to share
gains in productivity. Although it varies from contract to contract, the rate of return is fixed
by the concession granting authority and consists of a base rate (Treasury Bonds or Euribor)
plus a risk premium of 3%, applied to the capital stock achieved and the legal reserve.
Regarding the retail segment, it must be noted that each waste service has their own
classification of users and their own tariff blocks (associated with the water service), which
sometimes vary a great deal between operators (in some cases a free service). A study
carried out by CESUR (2004), based on a survey to the municipalities, the waste charges
vary with a) the supply (or not) of tap water, b) type of consumer (domestic, industrial, etc.),
c) water consumption, d) percentage of water bill, e) type of collection system, f) frequency
of collection, and g) municipality characteristics. In addition, it diverges in their
implementation, that is, through a fixed part, a variable part, or both in the same tariff
system. Beyond this disparity of tariff systems, the lack of sustainability of them is another
concern of IRAR. Figure 8 presents this reform.
In this regard, IRAR, in 2009, issued a recommendation (since it is not entirely compulsory)
intending to harmonise not only the structure of the tariff system but also its values, and to
introduce some principles concerning the social tariffs. It is common to find social tariffs and
special tariff systems for large families.
Fig. 8. Distribution of annual average tariff paid for refuse collection
Institutional Development in the Urban Waste Market in Portugal.
Market Structure, Regulation and Performance Analysis
71
5.2 Quality of service
The quality of service regulation became one of most important attributions of IRAR. In this
scope, the quality of waste (and also water) service is regularly monitored. Actually a very
high level of service has been observed since then. This positive evolution is a consequence
of the role of the sector-specific regulator, which encourages the quality of service amongst
the waste utilities regulated. This atypical situation, even in the worldwide context, has
recognised the waste sector in Portugal as an example to follow by other countries (e. g. Italy
and Brazil).
IRAR carries out an annual benchmarking exercise, in which it establishes, compares and
publicises the performance of the regulated operators. For this purpose, the regulator has
PERFORMANCE INDICATORS 2004 2005 2006 2007
Protection of the user interests
User service accessibility
a) Service coverage (%) 100 100 100 100
b) Selective collection coverage (%) 67 77 79 80
c) Average waste charges (€/ton) 26.6 24.6 26.6 26.7
Quality of service supplied to users
d) Answers to written complaints (%) 41 89 92 97
Sustainability of the operator
Operator’s economical and financial sustainability
e) Operating cost coverage ratio (-) 1.5 1.58 1.65 1.6
f) Unit running costs (€/ton) 21.6 22.6 25.36 25.64
g) Solvency ratio (-) 0.19 0.51 0.55 0.59
Operator’s infrastructure sustainability
Recycling (%) 4.1 6.0 6.4 7.3
i) Organic recovery (%) 2.8 2.9 1.5 2.5
j)
Incineration (%) 66.1 82 79 68
k) Waste landfill (%) 74.5 89.6 88 78
l) Landfill utilisation (%) 128 116 121 122
Operator’s operational sustainability
m) Failure in heavy duty equipment (nr./10
3
ton/year) 0.17 0.16 0.14 0.15
n) Waste characterisation (-) 1.5 2.8 2.3 1.7
Operator’s human resource sustainability
o) Employees (nr./10
3
ton/year) 0.35 0.46 0.49 0.52
Environmental sustainability
p) Leachate tests performed (%) 90 80 96 96
q) Leachate quality upon treatment (%) 86 79 87 89
r)
Utilisation efficiency of energy resources (kWh/ton) -66.5 -90.4 -87.9 -73.9
s) Monitoring of groundwater quality (%) 84 97 90 84
t) Monitoring of air quality (%) 99.8 99.5 100 100
Table 5. Performance indicators for solid waste services used by IRAR and their results
Waste Management
72
defined a set of 20 performance indicators, focused on the wholesale segment of this service.
These groups have also been divided into three categories, namely indicators aimed at
protecting user interests, the sustainability of the operator and the environmental
sustainability. Table 5 summarises the performance indicators defined by IRAR and shows the
average results for the period 2004-2007 (four years). The results are generally very positive,
although there are some indicators that have worsened. Nevertheless, this had to do with
changes in the definitions of these indicators and a greater rigour in implementing them.
In addition, IRAR issues comments concerning the results of each indicator for every
regulated operator. The performance obtained is compared with reference values
(optimum values, or close to them, which IRAR deems to be reasonable and attainable by
the waste utilities), considering the factors of the operational context in which each utility
acts. From this assessment, IRAR classifies the performance of each operator in qualitative
terms, taking into account the quality of service provided, whether it is poor, average or
good, through a red, yellow or green ball per indicator, respectively, as it is presented in
figure 9.
The annual regulatory process carried out by the IRAR results in the publication of an
annual report (Portuguese Water and Waste Sector Report - RASARP) where the
benchmarking results are presented and discussed. This document is a key element of the
regulatory model adopted. Indeed, RASARP plays an important role in promoting a greater
effectiveness and efficiency of the operators and provides reliable and easy to interpret
information to users and other stakeholders about the waste services.
Together with the reformulation of its statutes and regulatory power (replaced by ERSAR),
IRAR is developing a new and updated set of performance indicators in order to foster
incentives to provide a service with better quality and attain other goals. For instance, in the
Portuguese waste sector, the indicator coverage started not making much sense, since 100%
was achieved by the waste utilities.
5.3 Public service obligations
Public service obligations are a fundamental tool for the protection of user interests. In
Portugal they are considered in the “Waste Law” (Decree-Law No. 178/2006, which altered
the Decree-Law No. 239/97) and the Essential Public Services Act (Decree-Law No.
12/2008), in which basic principles, such as, the universality or the continuity of the waste
services are, respectively, guaranteed.
The MOR introduced some important principles, such as the equal access to market, costs,
transparency and accuracy of the information provided and security for transactions, as well
as the standards for the protection of the environment and public health. The creation of a
MOR should encourage the participation of investors and of the waste producers
themselves.
The Essential Public Services Act outlines various aspects to uphold the user interests: the
right to participation (organisations representing users have the right to be consulted while
defining regulations for the legal framework governing public services), the obligation to
provide information when public services supply is suspended (except for unexpected
situations or force majeure reasons, the service cannot be suspended without suitable
warning) and the right to partial quittance (the payment of a public service cannot be
Institutional Development in the Urban Waste Market in Portugal.
Market Structure, Regulation and Performance Analysis
73
Benchmarking
Sunshine regulation
Fig. 9. Benchmarking and sunshine regulation of IRAR
Waste Management
74
refused). Furthermore, it comprises the assurance of quality standards (any service provided
must conform to high quality standards), minimum consumption (imposing and charging
for minimum consumption is forbidden), billing (users are entitled to receive a bill
specifying the sums presented), prescription by lapse of time (the right to require payment
lapses after a period of six months after the service has been provided), the injunctive nature
of rights (any agreements or dispositions that exclude or limit the rights of users by this law
are considered to be null and void) and safeguards entitlements (all legal dispositions that
specifically prove to be more favourable to users are safeguarded).
With the aim of improving transparency and raising awareness about costs in the waste
sector, the Local Finance Act (Decree-Law No. 2/2007) established that both the tariff
systems and a complete breakdown of the costs of the service should be made available on
the website of the municipality.
In addition, operators are compelled to have a complaint book and send all complaints to
IRAR within a period of ten working days in order to guarantee a greater efficiency while
handling user complaints.
6. Conclusions
In Portugal, in the past two decades the waste sector has evolved considerably. Taking into
account the situation of this sector in the early 1990s and the current panorama, it is easy to
understand the great contribution of the legal framework and of the large investments that
were allocated to the waste sector. Moreover, the establishment of dedicated regulation
represented an important (additional) role to this development. The significant increase of
refuse collection coverage, beyond the percentage of suitable treatment, is one of the
relevant signs of this progress.
In addition, the large participation of stakeholders by promoting recommendations and the
technical credibility and reputation of the operators along with their freedom from political
pressure, especially considering their institutional vulnerability, are also factors that have
contributed towards the national and international recognition of the vast operational and
regulatory development that has characterised the waste sector in Portugal, particularly due
to the presence of a sector-specific regulator, which is an atypical situation in the worldwide
waste sector.
Notice, however, that Portugal still faces important challenges in this area, namely, the great
discrepancy between what it is charged and the real cost of the service, the need for
operators to improve their productive efficiency, the clarification of the role of the State in
the waste sector and the separation of regulatory functions from operational functions and,
finally, an improvement of the existing legislation governing this sector which, in some
cases, is outdated and, in other instances, is still limited in the context of the new
requirements.
It is unquestionable that IRAR’s sunshine regulation has brought great improvements to the
waste sector, despite its little coercive power. Nevertheless, the recent reform both of its
statutes and regulatory model, turning it into a stronger regulator, is seen as an optimal
window to develop even more the waste sector, inducing more incentives to waste utilities,
focusing on a service with better quality, simultaneously sustainable and affordable for the
users.
Institutional Development in the Urban Waste Market in Portugal.
Market Structure, Regulation and Performance Analysis
75
7. References
Abduli, M. & Nasrabadi, T. (2007). Municipal solid waste management in Kurdistan
Province, Iran. Journal of Environmental Health, Vol. 69, No. 7, pp. 51-55
APA (2008). Relatório de Estado do Ambiente 2007. Portuguese Association for the
Environment (APA), Lisbon, Portugal
Baptista, J.; Pássaro, D. & Santos, R. (2003). As Linhas Estratégicas do Modelo de Regulação a
Implementar pelo IRAR. Institute for the Regulation of Water and Waste, Lisbon,
Portugal
CESUR (2004). Os sistemas Tarifários de Resíduos Sólidos Urbanos em Portugal. Center of Urban
and Regional Systems (CESUR), Instituto Superior Técnico, Technical University of
Lisbon, Portugal
Defra (2007). Waste Strategy for England. Presented in LGA Waste Strategy Debate Event,
London, United Kingdom
Faria, A.; Chinita, A.; Ferreira, F.; Presumido, M.; Inácio, M. & Gama, P. (1996). Plano
Estratégico para os Resíduos Sólidos Urbanos (PERSU). Ministry for the Environment,
Lisbon, Portugal
INETI (2009). Prevenção de Residuos Urbanos – Proposta de Programa. National Institute for
Engineering, Technology and Innovation (INETI), Lisbon, Portugal
IRAR (2008). Relatório Anual do Sector de Águas e Resíduos em Portugal. Institute for the
Regulation of Water and Waste (IRAR), Portugal
Marinho, A.; Didelet, F. & Semiao, V. (2006). Municipal solid waste disposal in Portugal.
Waste Management, Vol. 26, No. 12, pp. 1477-1489
Marques, R. & Simões, P. (2008). Does the sunshine regulation approach work? Governance
and regulation model of the urban waste services in Portugal. Resources
Conservation and Recycling, Vol. 52, No. 8-9, pp. 1040-1049
Marques, R. (2005). Regulação de Serviços Públicos. Sílabo Press, Portugal
Marques, R. (2006). A yardstick competition model for Portuguese water and sewerage
services regulation. Utilities Policy, Vol. 14, No. 3, pp. 175-184
Massarutto, A. (2006). Waste management as a service of general economic interest: is the
self-sufficiency principle still justified? Working Paper Series in Economics, Universitá
di Udine and Iefe, Udine, Italy
O’Neil, R. & Locke, E. (2004). Institutional and financial consideration in regional
solid waste management. Water, Air, & Soil Pollution, Vol. 4, No. 2, pp.
227-236
OECD (2002). Towards Sustainable Household Consumption? Trends and Policies in OECD
Countries. Organisation for Economic Co-operation and Development (OECD),
Paris, France
Pássaro, D. (2003). Report: waste management in Portugal 1996 and 2002. Waste Management,
Vol. 23, No. 1, pp. 97-99
Pinela, A.; Madeira, L.; Levy, J. & Teles, M. (2003). Mercado dos Resíduos em Portugal.
Associação das Empresas Portuguesas para o Sector do Ambiente (AEPSA), Lisbon,
Portugal
Waste Management
76
US.EPA (1999). National Source Reduction Characterization Report for Municipal Solid Waste in
United States. United States Environment Protection Agency, Washington D. C.,
United States of America
5
Composting Barrel for Sustainable Organic
Waste Management in Bangladesh
Md. Azizul Moqsud
Institute of Lowland Technology, Saga University
Japan
1. Introduction
Inadequate collection and uncontrolled disposal of solid waste cause a serious health hazard
to inhabitants and environment (Goyal et al., 2005). So, solid waste management has become
a major environmental problem confronting urban areas in developing countries (Pfammtter
& Schertenleib, 1996). Sujauddin et al. 2008 shows that household solid waste can be
converted from burden to resource in developing countries. Like other developing
countries, the major portion (about 84%) of the total solid waste is organic in Bangladesh
(Moqsud et al., 2005a). In composting process, the organic portion of wastes is converted
into stable end product of compost by bio-degradation (Hong, 2005; Rahman, 1993). As a
result, the volume, weight and moisture content are reduced; the potential odor and the
pathogens minimized, and nutrients are available for agricultural production (Witter, 1998;
Shinha, 2001). The spread of diseases is minimized due to the destruction of some pathogens
and parasites at elevated temperatures (Golueke, 1972, Vesiland & Rimer, 1981, Bhide &
Sundarsan, 1983).
Like any tropical and subtropical regions, Bangladesh has got a large amount of rainfalls
and considerable sunlight throughout the year. But it is important to maintain limited
amount of moisture content in the compost process for effective composting operations.
At moisture content > 65 %, anaerobic condition and generation of bad odors as well as the
depletion of the aerobic bacteria will be induced (Goyal et al., 2005). At moisture content <
40%, bacterial activity for decomposition is reduced (Rahman, 2004). Hence, it is necessary
to design a special type of composting reactor to cope with the heavy rainfall in these
regions for composting. The in-vessel composting reactor requires small area for installation
and operation which is essential in the densely populated urban areas (Iyengar & Bhave,
2005). The problems of fly breeding, odor generation, and rodents are eliminated because of
the enclosed aerobic design of the reactor (Chang, et al., 2006). The conventional steel barrel,
(Figure 1 a), has not become popular as a composting reactor in Bangladesh as it can not
skip over the bad odor generation and also takes a longer time to complete the composting
process (Moqsud, 2004). So a modification is needed to overcome these drawbacks of the
conventional composting barrel. This chapter presents an assessment of a modified steel
barrel used as a composting reactor in Bangladesh, which is suitable, eco-friendly and
effective in the typical sub-tropical monsoon climate. Field tests were performed in order to
examine the effectiveness of the proposed in-vessel composting reactor. Benefit-cost ratio of
this modified barrel composting plant is analyzed to ensure the financial viability.
Waste Management
78
Rectangular Door
0.53 m
Rectangular
Door
0.53 m
86 cm
Circular opening
Perforated pipe
0.86 m
Conical
cover
0.25 m
Base
Rectangular Door
0.53 m
Rectangular
Door
0.53 m
86 cm
Circular opening
Perforated pipe
0.86 m
Conical
cover
0.25 m
Base
(a) (b)
Fig. 1. Schematic of a composting barrel: (a) conventional type (b) modified type
2. Materials and methods
Figure 1 (b) shows the conventional as well as the proposed modified barrel used in this
study. The modified barrel made of steel has a circular shape with a diameter of 0.53 m and
height of 0.86 m. This barrel, generally available in the market to store oil and chemicals,
was collected from the recycle shops and modified. The modification include:
• 0.0125 m diameter openings throughout the surroundings to ensure aerobic digestion
inside the barrel
The conventional composting barrel has no opening in the surroundings and it has no
perforated PVC pipe in the middle portion of the barrel which caused almost anaerobic
condition inside the barrel, and consequently a bad odor generation during the composting
operation (Moqsud, 2004). A conical-shaped cover made of steel is set at the top to avoid
infiltration of rain water and to protect from excess heat and sunlight into the organic waste
both in the conventional and the newly modified composting barrel. A 0.25 x 0.30 m
rectangular opening with a hinge system was made at the bottom side for collecting the
composting mass from the barrel both in the conventional and the proposed modified barrel
(Figure 1). The both barrels were placed on a raised base to manage leachate resulting from
the composting process (Moqsud, 2003). The outside of the barrel was painted green for
aesthetic and corrosion protection. The average cost of each conventional and modified
barrel was around US$25 and US$29, respectively. As the modification was done by using
the recyclable PVC pipe and created the openings by using the hand drill machine the cost
for modification is not so prominent. The organic waste was separated and collected from
the source of generation in the study area. This biodegradable waste comprised of mainly
kitchen garbage of raw vegetables and some cooked food waste. There were some
biodegradable paper waste as well as fruits leftovers which were homogenized by cutting to
approximately 0.05-0.08 m in length (Iyenger, Bhave, 2005; Moqsud, 2003). The large size
organic wastes are pulverized into small pieces for quick composting process (Chang et al.,
2006; Hong, 2005). Then these homogenized organic solid wastes were deposited in the
composting barrel by removing the conical cover shown in Figure 1.
Composting Barrel for Sustainable Organic Waste Management in Bangladesh
79
The basic physico-chemical properties of the organic wastes of the study area are
summarized in Table 1.
Bulk density of the collected waste (kg/m
3
) 300
Mean daily waste generation rate (kg/person/day) 0.27-0.38
Moisture content (%) 56 %
pH 7.2
C/N ratio 21
Table 1. The basic properties of the collected organic wastes in the study area
The change in waste volume, temperature, pH and moisture content were monitored during
composting. After 45 days, the decomposing organic wastes were collected from the bottom
rectangular opening of the barrel and layered in the sunlight for maturing for one week.
One of the main objectives of composting is to reduce the volume of the organic waste.
Waste reduces volume from its initial value during the composting process. The total
volume of the waste was calculated everyday by measuring the height of the waste and was
compared with the previous day’s volume.
Temperature is an important controlling parameter for proper composting operation
(Sundberg, 2004). Variation in temperature was measured daily during composting by
inserting thermometer (range 0
0
to 100
0
C) 0.1 m above from the bottom through the circular
side-openings in the barrel. The reading was equilibrated for 5 minutes.
Measurements of pH in the compost were done by adding 0.010 kg of compost sample
(taken from 0.10 m above the bottom of the barrel) in 0.0001 m
3
distilled water and mix
thoroughly for several minutes (Sundberg, 2004; Jackson, 1973). The pH was measured by a
digital pH meter (JENWAY -3051) by inserting the probe into the water-compost mix
solution.
The variation of moisture content was determined by gravimetric procedure of weighing
samples before and after the water is removed. The sample was weighted first to get its wet
weight. Then it was dried for 24 hours in a 110ºC oven. After weighting the sample and
subtracted the weight of the container the dry weight was achieved. The difference between
the wet and dry weights was the weight of the water that the sample originally contained.
By dividing this water weight by the wet weight gave the moisture content as a fraction. The
following equation (1) was used for determining the moisture content of the compost.
Moisture content (%) = {(wet weight-dry weight)/ wet weight} x 100 (1)
The nutrient content of the finished compost sample was determined by standard methods
of chemical analysis (Goyal, 2005; Sundberg, 2004; Jackson, 1973). Nitrogen content was
determined as total Nitrogen by Kjeldhal’s method. Phosphorus content was measured as
total Phosphate (acid digest) using vanadomolybdophosphoric acid method, and Potassium
(acid digest) from various compost samples were determined using flame photometry
(Systronics) fitted with element specific filters.
3. Results and discussion
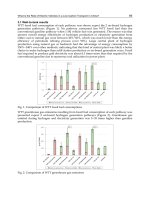
The variation of volume change of organic solid waste is shown in Figure 2. It is seen that
after composting was completed in about 35-40 days, the volume of the organic waste
Waste Management
80
0 5 10 15 20 25 30 35 40 45
6
8
10
12
14
16
18
20
Volume (10
-2
m
3
)
Duration (Days)
(before modification)
(after modification)
Fig. 2. Variation of waste volume during composting before and after the modification of the
barrel
became 50-70 % of the original volume. The volume reduction was quicker, when the
modified composting barrel was used.
After 4 weeks, the volume became 70% and 50% less of its original volume for the case of
after and before modification, respectively. This is so as the aerobic condition was
maintained in the middle as well as the surroundings of the new modified barrel.
Microorganisms reproduced very rapidly at early stage of composting due to the abundance
of easily-degradable organic matter. For this, the rate of volume reduction is usually fast
(Zheng, 2004).
Figure 2 shows that during the initial days (3-7 days), the rate of volume reduction was
quick, while after 14 days it became slow and almost constant after 21 days and 35 days in
the modified and conventional barrel, respectively. This observation is mainly due to the
quantity of nutrients for the bacteria were depleted, and thereby the rate of decomposition
became slower in the later stage. In the case of conventional barrel, the volume of the
organic waste reduces slowly. This is due to the lack of aerobic condition inside the barrel
and the presence of excess amount of moisture content (Figure 4).
The temperature variation during composting is illustrated in Figure 3. It shows that
temperature rises from the initial day to the maximum at 21 days and then it begins to fall
and became constant after 37 days.
The broad range of optimum temperatures for composting process is from 45 to 65
0
C
(Sundberg, 2004).This allows a large variety of micro-organisms to participate in the process.
However, if the peak temperature is more than 72ºC, some useful bacteria, which are
responsible for the aerobic decomposition, will die (Ahmad, 2000).
The temperatures generated by the mesophilic and thermophilic bacterial activity lead to the
destruction of diseases causing microorganisms. During the initial days, the increased
temperature in the composting barrel was mainly caused by the more exothermic reactions
associated with the respiratory metabolism of the microorganisms involved in the
composting operation (Sundberg, 2004; Tchobanglous, 1977). But at that time, the moisture
Composting Barrel for Sustainable Organic Waste Management in Bangladesh
81
content is high, which prevents to reach at the peak temperature. Again, it is found that after
the modified composting barrel generated a peak temperature of 69ºC in contrast to 60ºC
before modification.
In case of the conventional barrel, moisture content is generally high as there were not much
available openings to remove or evaporate the moisture of the leachate and thereby
lowering the temperature inside the reactor. The durations of the optimum temperature for
composting are about 22 days and 28 days for the case of before modification and after
modification of the barrel, respectively. The longer length for the modified one would be
favorite to the composting process, even though it has a drawbacks in terms of temperature
>65ºC.
0 5 10 15 20 25 30 35 40 45
10
15
20
25
30
35
40
45
50
55
60
65
70
75
80
Temperature (Degree Celcius)
Duration (Days)
(before modification)
(after modification)
Fig. 3. Variation of temperature during composting before and after modification of the
barrel
0 5 10 15 20 25 30 35 40 45
5.2
5.6
6.0
6.4
6.8
7.2
7.6
8.0
pH
Duration (Days)
before modification
after modification
Fig. 4. Variation of pH during the composting before and after the modification of the barrel
Waste Management
82
0 5 10 15 20 25 30 35 40 45
40
45
50
55
60
65
70
Moisture content %
Duration
(
Da
y
s
)
(before modification)
(after modification)
Fig. 5. Variation of moisture content during composting before and after modification of the
barrel
The variation of pH with time during the composting process is plotted in Figure 4. This
variation directly indicates the extent of decomposition within the compost mass. The
optimum pH range for most bacteria is between 6.0 and 7.5 (Parks et al., 1988). During the
initial period (first 2 to 7 days), pH decreased to 6.0 or less during the initial phase of
temperature rise.
The duration of pH > 6.0 for the case of modified barrel is longer than the conventional
barrel. Therefore, it may imply that modified barrel has higher performance. From day 12,
pH value of the compost began to rise to about 7.4. Initially, the microorganisms reproduced
very rapidly because there was large portion of easily-degradable organic matter in the
wastes. With the activity of the microorganisms, considerable amount of organic acids
(acetic acid, butyric acid etc.) were produced, and consequently, the pH value of the
compost decreased (Li & Zhang, 2000). With volatization of the organic acids, the pH value
of the compost increased as more decomposition of organic matter had occurred (Fang &
Wong, 1999).
Moisture content was determined by weight loss of compost samples, which were oven
dried at 110 ºC for 24 h (Dresboll & Kristensen, 2005). At moisture levels above 68 %, water
begins to fill the interstices between the particles of the wastes, reducing the interstitial
oxygen and causing anaerobic conditions with a resultant offensive odor (Rahman, 1993;
Tachobanglous, 1977). When the moisture contents drop much below 40%, the composting
process becomes slow (Goyal et al, 2005). Figure 5 shows the variation of moisture content
with duration of composting.The maximum moisture content reached nearly 67% before
modification and about 60% after the modification of the barrel. So, by ensuring the aerobic
condition in the middle and the surroundings of the barrel, the peak moisture content can be
maintained at the optimum level for proper composting. As in the initial stage (5-12 days),
the bacterial activities and the decomposition of organic waste were more significant. The
values of moisture content were also high in that period and it decreased after some days
(15-25 days) as the bacterial activities decreased at that time. However, the moisture content