Wireless Sensor Networks Application Centric Design 2011 Part 4 potx
Bạn đang xem bản rút gọn của tài liệu. Xem và tải ngay bản đầy đủ của tài liệu tại đây (4.46 MB, 30 trang )
Urban Microclimate and Trafc Monitoring with Mobile Wireless Sensor Networks 79
while downloading encoded packets from APs, until it collects enough for sensor data recov-
ery using the iterative BP algorithm. The number of excessive encoded packets compared to
k sensor packets is measured by the reception overhead
6
; i.e., for successful recovery MC
needs in total k
= (1 +
) · k encoded packets, where
usually is a small positive num-
ber. Since each encoded packet is an innovative representation of the original data, any subset
of k
= (1 +
) · k taken from the set of all the encoded packets in the network allows for
restoration of the whole original data. This property of rateless codes makes them a perfect
candidate to be used at the application level for content delivery in vehicular networks, since
packet losses caused by the varying link characteristics are compensated simply by reception
of the new packets and there is no need for standard acknowledgment-retransmission mecha-
nisms which can not be supported by a semi-duplex architecture as the one adopted. In other
words, the usage of connection-oriented transport protocols like TCP can be avoided, as UDP-
like transport provides a satisfactory functionality. Moreover, the loosing of packets caused by
channel error or by the receiver deafness during the selection of a different AP does not impact
on BC scheme, as MC continues downloading data without any need for (de/re)association,
session management or content reconciliation.
4. Simulation Results
The simulation setup assumes that the urban area is covered by a regular hexagonal lattice,
where each non-overlapping hexagon represents the coverage area of a single AP and the
hexagon side length is equal to the AP transmission range. MCs move throughout the lattice
using the rectangular grid that models urban road-infrastructure, associating with the nearest
AP. The overlay hexagonal AP lattice is independent and arbitrarily aligned with the under-
lying rectangular road-grid. The MCs move according to the Manhattan mobility model (Bai
et al., 2003), a model commonly used for metropolitan traffic. In brief, Manhattan mobility
model assumes a regular grid consisting of horizontal and vertical (bidirectional) streets; at
each intersection, MC continues in the same direction with probability 0.5 or turns left/right
with probability 0.25 in each case. The MC speed is uniformly chosen from a predefined inter-
val and changes on a time-slot basis (time-slot duration is a model parameter), with the speed
in the current time-slot being dependent on the value in the previous time-slot. Besides tem-
poral dependencies, Manhattan mobility model also includes spatial dependencies, since the
velocity of a MC depends on the velocity of other MCs moving in the same road segment and
in the same direction; as we are interested only in I2V communications from the perspective
of a single user (i.e., a single MC), spatial dependencies are omitted in our implementation.
The purpose of the simulations is to estimate the duration of the download phase, as the most
important and the lengthiest phase of the data refreshment period. In each simulation run,
while moving on the road grid, the MC starts receiving the encoded data from the AP in
whose coverage zone it is currently located. The reception of the encoded packets continues
until the MC collects enough to successfully decode all the original data. If during this pro-
cess, MC happens to move to another AP zone, it simply associates to a new local AP (i.e.,
handover takes place) and starts to receive its encoded packets. Also, if the AP has transmit-
ted all of its encoded packets to the MC, but it failed to decode the data (e.g., due to link-layer
packet losses), the MC suspends data reception until it enters the new AP coverage zone. The
6
This takes into account both the decoding overhead as well as the redundancy needed in the presence
of erasure channel.
simulation run ends when the decoding is finished and all the original data packets are re-
trieved. All the presented results are obtained by performing 1000 simulation runs for each
set of parameters.
System Parameter Value
AP transmission range 400 m
N
AP
(no. of APs in the system) 40
N
s
(no. of sensor nodes per AP) 50
k (no. of data packets) 2000
L (data packet length) 250 byte
k · L (total amount of original data) 4 Mbit ≈ 0.48 Mbyte
c, δ (rateless code parameters) 0.03, 0.5
k
AP
(no. of encoded packets per AP) 3600
R (bit-rate) 6, 11, 12, 24 Mbit/s
T
SF
(superframe duration) 100 ms
τ
HO
(handover time) 0.5 s
P
PL
(packet-loss probability) 0.3
road-segment length 150 m
velocity 4 - 17 m/s
acceleration ± 0.6 m/s
2
mobility model time-slot duration 2 s
Table 1. Simulation Parameters
Table 1 summarizes the values for the communication and mobility model parameters used
in simulations. The number of APs is chosen such that it provides a coverage area which is
approximately equal to a medium-sized city area. The data packet length is estimated in such
way that is sufficient to accommodate single sensor readings and additional headers (i.e., IEEE
802.11 MAC and LLC, network and transport layer). The values for bit-rate and superframe
duration are selected as suggested in (Bohm & Jonsson, 2008) and (Eriksson et al., 2008),
pessimistic assumption on packet-loss rate and estimate of the mean MC handover time were
taken from (Bychkovsky et al., 2006), the average road segment length (i.e., average distance
between two intersections) from (Peponis et al., 2007). The number of encoded packets per
AP, k
AP
is chosen such that a MC could decode all original data with probability of 0.99,
when downloading from a single AP and considering employed rateless code properties and
assumed link-layer packet-loss rate. In other words, k
AP
>
1
+
(max)
·k · L/(1 −P
PL
).
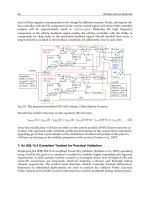
Fig. 3 presents the probability P
SD
that the MC successfully decodes the sensor data as a
function of time, for the BC service and T
(BC)
SF
= 0.1 · T
SF
. The value for T
SF
is selected such
that it leaves enough room for the GC service and other usual best-effort services. As it can
be observed from the figure, for higher bit-rates (i.e., R
> 6 Mbit/s), the MCN is able to
Wireless Sensor Networks: Application-Centric Design80
successfully decode w.h.p. all the data in the time span of several seconds. The positive effect
of rateless coding is inherent in the fact that, even in the worst case, the data refreshment
period is below 15s, a value that still allows for real-time information updates and which could
be decreased further by assigning a larger superframe fraction to the BC service. As opposed
to rateless encoded data delivery, the uncoded data delivery would result in retransmission
feedback implosion for BC service, overwhelming the sender (i.e., AP) with unwanted traffic.
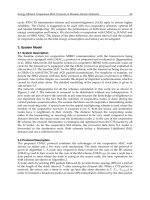
The probability of successful decoding for GC service is presented in Fig. 4, where the fraction
of the superframe assigned to a single user is assumed to be T
(GC)
SF
/N
MN
= 0.01 ·T
SF
; the val-
ues for T
(UC)
SF
and N
MN
are taken from the realistic analysis given in (Bohm & Jonsson, 2008).
Fig. 4 demonstrates that for the standard GC service, the data refreshment period is of the
order of minutes rather than seconds, which limits its usage for the applications that tolerate
larger update periods. However, this period would be significantly longer if rateless coding
was not used, since the link layer retransmissions would make the data delivery process con-
siderably less efficient. Finally, it can be observed that, for the GC service, the differences in
transmission bit-rate have a significant impact on the download delay, which makes higher
bit-rates desirable.
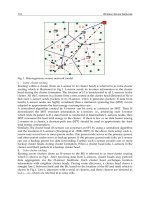
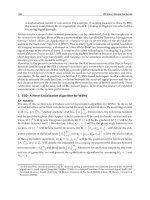
Fig. 5 presents the duration of the time interval T
0.99
for which a MN, using the GC service,
decodes all the original data with probability P
SD
= 0.99, as a function of the number of
users N
MN
and for the fixed T
(GC)
SF
= 0.8 · T
SF
. The figure shows a linear increase in T
0.99
as
the rate decreases or N
MN
increases, verifying that the content reconciliation phase is indeed
unnecessary, since the change of the AP does not introduce additional delays apart from the
handover time. In other words, after a handover, MC seamlessly advances both with the
receiving and decoding processes.
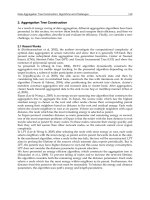
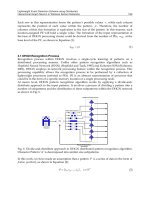
Finally, Fig. 6 shows the cumulative distribution function F
T
of the number of transmitted
packets using the GC service from an AP to any MC within a single AP domain. The
T
(GC)
SF
/N
MN
ratio of the UC service is set to 0.005 · T
SF
or 0.01 · T
SF
. As it can be observed,
the number of transmitted packets to a MC reaches the threshold value k
AP
equal to
3600 for the selected parameter values (Table I), in all cases but for R
= 6 Mbit/s and
T
(GC)
SF
/N
MN
= 0.005 · T
SF
. This means that number of encoded packets per AP (i.e., k
AP
) is
properly dimensioned to allow a single user to collect enough of encoded packets to decode
all the data w.h.p. while moving through a single AP coverage zone.
To summarize the benefits provided by the proposed I2V data dissemination based on the
rateless codes over traditional methods, it is worth noticing first of all that, by their design,
rateless codes are tuned to the changing wireless link conditions and have a close-to-the-
minimal reception overhead. Furthermore, each rateless coded packet is an equally important
representation of the original data, which makes lengthy TCP-like reliability mechanisms un-
necessary. These factors influence the time allocations within the superframe, allowing larger
number of mobile nodes to be serviced during designated service-time portion of the super-
frame, or alternatively, service-time portion shortening, providing larger time allocations for
best-effort traffic. Finally, while roaming through the network, mobile users can simply con-
tinue with data download from the new local AP after a handover, avoiding the redundant
content reconciliation phase.
0 2 4 6 8 10 12 14 16 18 20
0
0.1
0.2
0.3
0.4
0.5
0.6
0.7
0.8
0.9
1
time [s]
P
SD
6 Mbit/s
11 Mbit/s
12 Mbit/s
24 Mbit/s
Fig. 3. Probability of successful decoding P
SD
for BC service, T
(BC)
SF
= 0.1 · T
SF
.
20 40 60 80 100 120 140
0
0.1
0.2
0.3
0.4
0.5
0.6
0.7
0.8
0.9
1
time [s]
P
SD
6 Mbit/s
11 Mbit/s
12 Mbit/s
24 Mbit/s
Fig. 4. Probability of successful decoding P
SD
for GC service, T
(GC)
SF
/N
MN
= 0.01 · T
SF
.
Urban Microclimate and Trafc Monitoring with Mobile Wireless Sensor Networks 81
successfully decode w.h.p. all the data in the time span of several seconds. The positive effect
of rateless coding is inherent in the fact that, even in the worst case, the data refreshment
period is below 15s, a value that still allows for real-time information updates and which could
be decreased further by assigning a larger superframe fraction to the BC service. As opposed
to rateless encoded data delivery, the uncoded data delivery would result in retransmission
feedback implosion for BC service, overwhelming the sender (i.e., AP) with unwanted traffic.
The probability of successful decoding for GC service is presented in Fig. 4, where the fraction
of the superframe assigned to a single user is assumed to be T
(GC)
SF
/N
MN
= 0.01 ·T
SF
; the val-
ues for T
(UC)
SF
and N
MN
are taken from the realistic analysis given in (Bohm & Jonsson, 2008).
Fig. 4 demonstrates that for the standard GC service, the data refreshment period is of the
order of minutes rather than seconds, which limits its usage for the applications that tolerate
larger update periods. However, this period would be significantly longer if rateless coding
was not used, since the link layer retransmissions would make the data delivery process con-
siderably less efficient. Finally, it can be observed that, for the GC service, the differences in
transmission bit-rate have a significant impact on the download delay, which makes higher
bit-rates desirable.
Fig. 5 presents the duration of the time interval T
0.99
for which a MN, using the GC service,
decodes all the original data with probability P
SD
= 0.99, as a function of the number of
users N
MN
and for the fixed T
(GC)
SF
= 0.8 · T
SF
. The figure shows a linear increase in T
0.99
as
the rate decreases or N
MN
increases, verifying that the content reconciliation phase is indeed
unnecessary, since the change of the AP does not introduce additional delays apart from the
handover time. In other words, after a handover, MC seamlessly advances both with the
receiving and decoding processes.
Finally, Fig. 6 shows the cumulative distribution function F
T
of the number of transmitted
packets using the GC service from an AP to any MC within a single AP domain. The
T
(GC)
SF
/N
MN
ratio of the UC service is set to 0.005 · T
SF
or 0.01 · T
SF
. As it can be observed,
the number of transmitted packets to a MC reaches the threshold value k
AP
equal to
3600 for the selected parameter values (Table I), in all cases but for R
= 6 Mbit/s and
T
(GC)
SF
/N
MN
= 0.005 · T
SF
. This means that number of encoded packets per AP (i.e., k
AP
) is
properly dimensioned to allow a single user to collect enough of encoded packets to decode
all the data w.h.p. while moving through a single AP coverage zone.
To summarize the benefits provided by the proposed I2V data dissemination based on the
rateless codes over traditional methods, it is worth noticing first of all that, by their design,
rateless codes are tuned to the changing wireless link conditions and have a close-to-the-
minimal reception overhead. Furthermore, each rateless coded packet is an equally important
representation of the original data, which makes lengthy TCP-like reliability mechanisms un-
necessary. These factors influence the time allocations within the superframe, allowing larger
number of mobile nodes to be serviced during designated service-time portion of the super-
frame, or alternatively, service-time portion shortening, providing larger time allocations for
best-effort traffic. Finally, while roaming through the network, mobile users can simply con-
tinue with data download from the new local AP after a handover, avoiding the redundant
content reconciliation phase.
0 2 4 6 8 10 12 14 16 18 20
0
0.1
0.2
0.3
0.4
0.5
0.6
0.7
0.8
0.9
1
time [s]
P
SD
6 Mbit/s
11 Mbit/s
12 Mbit/s
24 Mbit/s
Fig. 3. Probability of successful decoding P
SD
for BC service, T
(BC)
SF
= 0.1 · T
SF
.
20 40 60 80 100 120 140
0
0.1
0.2
0.3
0.4
0.5
0.6
0.7
0.8
0.9
1
time [s]
P
SD
6 Mbit/s
11 Mbit/s
12 Mbit/s
24 Mbit/s
Fig. 4. Probability of successful decoding P
SD
for GC service, T
(GC)
SF
/N
MN
= 0.01 · T
SF
.
Wireless Sensor Networks: Application-Centric Design82
20 40 60 80 100 120 140 160
0
50
100
150
200
250
N
MN
T
0.99
[s]
6 Mbit/s
11 Mbit/s
12 Mbit/s
24 Mbit/s
Fig. 5. Duration of time-interval T
0.99
for which MC decodes all data with P
SD
= 0.99 for GC
service.
0 500 1000 1500 2000 2500 3000 3600
0
0.1
0.2
0.3
0.4
0.5
0.6
0.7
0.8
0.9
1
no. of transmitted packets
F
T
6 Mbit/s, T
SF
(UC)
/N
MN
=0.005 T
SF
11 Mbit/s, T
SF
(UC)
/N
MN
=0.005 T
SF
6 Mbit/s, T
SF
(UC)
/N
MN
=0.01 T
SF
11 Mbit/s, T
SF
(UC)
/N
MN
=0.01 T
SF
Fig. 6. Cumulative distribution function F
T
of number of transmitted packets to MN in single
AP cell for GC service.
Acknowledgment
This work was supported in part by by the Italian National Project “Wireless multiplatfOrm
mimo active access netwoRks for QoS-demanding muLtimedia Delivery” (WORLD), under
grant number 2007R989S, as well as by the Tuscany Region projects “Metropolitan Mobility
Agency Supporting Tools” (SSAMM) and “Microparticulate Monitoring via Wireless Sensor
Networks” (MAPPS) The authors would like also to thank the partners of EU FP7-REGPOT-
2007-3 - “AgroSense” project for their fruitful discussion and comments.
5. References
Bai, F., Sadagopan, N. & Helmy, A. (2003). IMPORTANT: A framework to systematically an-
alyze the Impact of Mobility on Performance of RouTing protocols for Adhoc NeT-
works, Proc. of IEEE INFOCOM 2003, San Francisco, CA, USA.
Bohm, A. & Jonsson, M. (2008). Supporting real-time data traffic in safety-critical vehicle-to-
infrastructure communication, Proc. of IEEE LCN 2008, Montreal, QC, Canada.
Bychkovsky, V., Hull, B., Miu, A., Balakrishnan, H. & Madden, S. (2006). A Measurement
Study of Vehicular Internet Access Using in Situ Wi-Fi Networks, Proc. of ACM Mobi-
Com 2006, Los Angeles, CA, USA.
Byers, J., Considine, J., Mitzenmacher, M. & Rost, S. (2002). Informed Content Delivery Across
Adaptive Overlay Networks, Proc. of ACM SIGCOMM 2002, Pittsburg, PA, USA.
Byers, J., Luby, M. & Mitzenmacher, M. (2002). A Digital Fountain Approach to Asynchronous
Reliable Multicast, IEEE Journal on Selected Areas in Communications 20(8): 1528–1540.
Cordova-Lopez, L. E., Mason, A., Cullen, J. D., Shaw, A. & Al-ShammaŠa, A. (2007). Online
Vehicle and Atmospheric Pollution Monitoring using GIS and Wireless Sensor Net-
works, Proc. of ACM IntŠl Conference on Embedded Networked Sensor Systems (SenSys),
pp. 87
˝
U–101.
Eriksson, J., Balakrishnan, H. & Madden, S. (2008). Cabernet: Vehicular Content Delivery
Using WiFi, Proc. of ACM MobiCom 2008, San Francisco, CA, USA.
Gerla, M., Zhou, B., Lee, Y. Z., Soldo, F., Lee, U. & Marfia, G. (2006). Vehicular Grid Commu-
nications: The Role of the Internet Infrastructure, Proc. of WICON Š06, Boston, MA,
USA.
IEEE (2007). Ieee 802.11-2007 wireless lan medium access control and physical layers specifi-
cations.
Jiang, D. & Delgrossi, L. (2008). IEEE 802.11p: Towards an International Standard for Wireless
Access in Vehicular Environments, Proc. of IEEE VTC2008-Spring, Singapore.
Laisheng, X., Xiaohong, P., Zhengxia, W., Bing, X. & Pengzhi, H. (2009). Research on traffic
monitoring network and its traffic flow forecast and congestion control model based
on wireless sensor networks, Measuring Technology and Mechatronics Automation, 2009.
ICMTMA ’09. International Conference on, Vol. 1, pp. 142 –147.
Luby, M. (2002). LT Codes, Proc. of IEEE FOCS 2002, Vancouver, BC, Canada.
Martinez, K., Hart, J. & Ong, R. (2004). Environmental Sensor Networks, IEEE Computer Jour-
nal 37: 50–56.
Ott, J. & Kutscher, D. (2004). Drive-thru Internet: IEEE 802.11b for Automobile Users, Proc. of
IEEE Infocom 2004, Hong Kong.
Peponis, J., Allen, D., Haynie, D., Scoppa, M. & Zhang, Z. (2007). MEASURING THE CON-
FIGURATION OF STREET NETWORKS: the Spatial profiles of 118 urban areas in
Urban Microclimate and Trafc Monitoring with Mobile Wireless Sensor Networks 83
20 40 60 80 100 120 140 160
0
50
100
150
200
250
N
MN
T
0.99
[s]
6 Mbit/s
11 Mbit/s
12 Mbit/s
24 Mbit/s
Fig. 5. Duration of time-interval T
0.99
for which MC decodes all data with P
SD
= 0.99 for GC
service.
0 500 1000 1500 2000 2500 3000 3600
0
0.1
0.2
0.3
0.4
0.5
0.6
0.7
0.8
0.9
1
no. of transmitted packets
F
T
6 Mbit/s, T
SF
(UC)
/N
MN
=0.005 T
SF
11 Mbit/s, T
SF
(UC)
/N
MN
=0.005 T
SF
6 Mbit/s, T
SF
(UC)
/N
MN
=0.01 T
SF
11 Mbit/s, T
SF
(UC)
/N
MN
=0.01 T
SF
Fig. 6. Cumulative distribution function F
T
of number of transmitted packets to MN in single
AP cell for GC service.
Acknowledgment
This work was supported in part by by the Italian National Project “Wireless multiplatfOrm
mimo active access netwoRks for QoS-demanding muLtimedia Delivery” (WORLD), under
grant number 2007R989S, as well as by the Tuscany Region projects “Metropolitan Mobility
Agency Supporting Tools” (SSAMM) and “Microparticulate Monitoring via Wireless Sensor
Networks” (MAPPS) The authors would like also to thank the partners of EU FP7-REGPOT-
2007-3 - “AgroSense” project for their fruitful discussion and comments.
5. References
Bai, F., Sadagopan, N. & Helmy, A. (2003). IMPORTANT: A framework to systematically an-
alyze the Impact of Mobility on Performance of RouTing protocols for Adhoc NeT-
works, Proc. of IEEE INFOCOM 2003, San Francisco, CA, USA.
Bohm, A. & Jonsson, M. (2008). Supporting real-time data traffic in safety-critical vehicle-to-
infrastructure communication, Proc. of IEEE LCN 2008, Montreal, QC, Canada.
Bychkovsky, V., Hull, B., Miu, A., Balakrishnan, H. & Madden, S. (2006). A Measurement
Study of Vehicular Internet Access Using in Situ Wi-Fi Networks, Proc. of ACM Mobi-
Com 2006, Los Angeles, CA, USA.
Byers, J., Considine, J., Mitzenmacher, M. & Rost, S. (2002). Informed Content Delivery Across
Adaptive Overlay Networks, Proc. of ACM SIGCOMM 2002, Pittsburg, PA, USA.
Byers, J., Luby, M. & Mitzenmacher, M. (2002). A Digital Fountain Approach to Asynchronous
Reliable Multicast, IEEE Journal on Selected Areas in Communications 20(8): 1528–1540.
Cordova-Lopez, L. E., Mason, A., Cullen, J. D., Shaw, A. & Al-ShammaŠa, A. (2007). Online
Vehicle and Atmospheric Pollution Monitoring using GIS and Wireless Sensor Net-
works, Proc. of ACM IntŠl Conference on Embedded Networked Sensor Systems (SenSys),
pp. 87
˝
U–101.
Eriksson, J., Balakrishnan, H. & Madden, S. (2008). Cabernet: Vehicular Content Delivery
Using WiFi, Proc. of ACM MobiCom 2008, San Francisco, CA, USA.
Gerla, M., Zhou, B., Lee, Y. Z., Soldo, F., Lee, U. & Marfia, G. (2006). Vehicular Grid Commu-
nications: The Role of the Internet Infrastructure, Proc. of WICON Š06, Boston, MA,
USA.
IEEE (2007). Ieee 802.11-2007 wireless lan medium access control and physical layers specifi-
cations.
Jiang, D. & Delgrossi, L. (2008). IEEE 802.11p: Towards an International Standard for Wireless
Access in Vehicular Environments, Proc. of IEEE VTC2008-Spring, Singapore.
Laisheng, X., Xiaohong, P., Zhengxia, W., Bing, X. & Pengzhi, H. (2009). Research on traffic
monitoring network and its traffic flow forecast and congestion control model based
on wireless sensor networks, Measuring Technology and Mechatronics Automation, 2009.
ICMTMA ’09. International Conference on, Vol. 1, pp. 142 –147.
Luby, M. (2002). LT Codes, Proc. of IEEE FOCS 2002, Vancouver, BC, Canada.
Martinez, K., Hart, J. & Ong, R. (2004). Environmental Sensor Networks, IEEE Computer Jour-
nal 37: 50–56.
Ott, J. & Kutscher, D. (2004). Drive-thru Internet: IEEE 802.11b for Automobile Users, Proc. of
IEEE Infocom 2004, Hong Kong.
Peponis, J., Allen, D., Haynie, D., Scoppa, M. & Zhang, Z. (2007). MEASURING THE CON-
FIGURATION OF STREET NETWORKS: the Spatial profiles of 118 urban areas in
Wireless Sensor Networks: Application-Centric Design84
the 12 most populated metropilitan regions in the US, Proc. of 6th International Space
Syntax Symposium, Istanbul, Turkey.
Pinart, C., Calvo, J. C., Nicholson, L. & Villaverde, J. A. (2009). ECall-compliant early crash
notification service for portable and nomadic devices, Proc. of IEEE VTC2009-Spring,
Barcelona, Spain.
Santini, S., Ostermaier, B. & Vitaletti, A. (2008). First Experiences using Wireless Sensor Net-
work for Noise Pollution Monitoring, Proc. of 3rd ACM Workshop on Real-World Wire-
less Sensor Networks (REALWSN’08), Glasgow, United Kingdom.
Shu-Chiung, H., You-Chiun, W., Chiuan-Yu, H. & Yu-Chee, T. (2009). A Vehicular Wireless
Sensor Network for CO2 Monitoring, Proc. of IEEE Sensors, pp. 1498 – 1501.
Stefanovic, C., Crnojevic, V., Vukobratovic, D., Niccolai, L., Chiti, F. & Fantacci, R. (2011).
Urban Infrastructure-to-Vehicle Traffic Data Dissemination Using Rateless Codes, to
appear in IEEE Journal on Selected Areas on Communications special issue on Vehicular
Communications and Networks .
Tanner, J. C. (1957). The Sampling of Road Traffic, Journal of the Royal Statistical Society. Series
C (Applied Statistics) 6(3): 161–170.
Tubaishat, M., Zhuang, P., Qi, Q. & Shang, Y. (2009). Wireless sensor networks in intelligent
transportation systems, Wireless Communications and Mobile Computing 2009 9(3): 287–
302.
Vukobratovic, D., Stefanovic, C., Crnojevic, V., Chiti, F. & Fantacci, R. (2010). Rateless Packet
Approach for Data Gathering in Wireless Sensor Networks, to appear in IEEE Journal
on Selected Areas in Communications special issue on Simple Wireless Sensor Networking
Solutions) 28(7).
Wu, C. & Li, B. (2007). Outburst: Efficient Overlay Content Distribution with Rateless Codes,
Proc. of IFIP Networking 2007, Atlanta, GA, USA.
Yousefi, S., Mousavi, M. S. & Fathy, M. (2006). Vehicular Ad Hoc Networks (VANETs): Chal-
lenges and Perspectives, Proc. of ITST 2006, Chengdu, China.
Improving Greenhouse’s Automation and Data Acquisition
with Mobile Robot Controlled system via Wireless Sensor Network 85
Improving Greenhouse’s Automation and Data Acquisition with Mobile
Robot Controlled system via Wireless Sensor Network
István Matijevics and Simon János
X
Improving Greenhouse’s Automation and
Data Acquisition with Mobile Robot Controlled
system via Wireless Sensor Network
István Matijevics* and Simon János**
*University of Szeged, Institute of Informatics
Hungary
**Subotica Tech, Department of Informatics
Serbia
1. Introduction
The function of a greenhouse is to create the optimal growing conditions for the full lifecycle
of the plants. Using autonomous measuring stations helps to monitor all the necessary
parameters for creating the optimal environment in the greenhouse. The robot equipped
with sensors is capable of driving to the end and back along crop rows inside the
greenhouse. This chaper deals with the implementation of mobile measuring station in
greenhouse environment. It introduces a wireless sensor network that was used for the
purpose of measuring and controlling the greenhouse application. Continuous
advancements in wireless technology and miniaturization have made the deployment of
sensor networks to monitor various aspects of the environment increasingly flexible.
Climate monitoring is vitally important to the operation in greenhouses and the quality of
the collected information has a great influence on the precision and accuracy of control
results. Currently, the agro-alimentary market field incorporates diverse data acquisition
techniques. Normally, the type of acquisition system is chosen to be optimal for the control
algorithm to be used. For traditional climate monitoring and control systems, all sensors are
distributed through the greenhouse and connected to the device performing the control
tasks. These equipments use time-based data sampling techniques as a consequence of using
time-based controllers. Typical applications of WSNs include monitoring, tracking, and
controlling. Some of the specific applications are habitat monitoring, object tracking, etc. In a
typical application, a WSN is scattered in a region where it is meant to collect data through
its sensor node. The WSN-based controller has allowed a considerable decrease in the
number of changes in the control action and made possible a study of the compromise
between quantity of transmission and control performance. In modern greenhouses, several
measurement points are required to trace down the local climate parameters in different
parts of the big greenhouse to make the greenhouse automation system work properly.
Cabling would make the measurement system expensive and vulnerable. Moreover, the
cabled measurement points are difficult to relocate once they are installed. Thus, a wireless
6
Wireless Sensor Networks: Application-Centric Design86
sensor network (WSN) consisting of small-size wireless sensor nodes equipped with radio
and one or several sensors, is an attractive and cost-efficient option to build the required
measurement system. In this work, we developed a wireless sensor node for greenhouse
monitoring by integrating a sensor platform provided SunSPOT by Sun Microsystems with
few sensors capable to measure four climate variables. Continuous advancements in
wireless technology and miniaturization have made the deployment of sensor networks to
monitor various aspects of the environment increasingly flexible.
2. Mobile platform
Mobile robotics is a young field of research. Its roots include many engineering and science
disciplines, from mechanical, electrical and electronics engineering to computer, cognitive
and social sciences. The Board Of Education is a complete, low-cost development platform
equipped with the needed sensors for humidity, temperature, light, etc. As shown in
Figure 1, the Boe-Bot is a great tool with which to get started with robotics.
Fig. 1. Assembled Boe-Bot
The SunSPOT WSN module makes it possible for the Boe-Bot robot’s BASIC Stamp 2
microcontroller brain to communicate wirelessly with a web based user interface running on
a nearby PC. The BASIC Stamp microcontroller runs a small PBASIC program that controls
the Boe-Bot robot’s servos and optionally monitors sensors while it communicates wirelessly
with the web server.
3. Control scheme for mobile robots
A mobile robot needs locomotion mechanisms that enable it to move throughout its known
or unknown environment. But there are a large variety of possible ways to move, and so the
selection of a robot’s approach to locomotion is an important aspect of mobile robot design.
Figure 2, presents the control scheme for mobile robot systems. In the laboratory, there are
research robots that can walk, jump, run, slide, skate, swim, fly, and, of course, roll. Any of
these activities has its own control algorithm (Gy. Mester, 2009).
Fig. 2. Reference control scheme for mobile robot systems
Locomotion is the complement of manipulation. In manipulation, the robot arm is fixed but
moves objects in the workspace by imparting force to them. In locomotion, the environment
is fixed and the robot moves by imparting force to the environment. In both cases, the
scientific basis is the study of actuators that generate interaction forces, and mechanisms
that implement desired kinematical and dynamic properties. The wheel has been by far the
most popular mechanism in mobile robotics and in man-made vehicles in general. It can
achieve very good efficiencies, and does so with a relatively simple mechanical
implementation. On Figure 3, the kinematics of the mobile robot is depicted. In addition,
balance is not usually a research problem in wheeled robot designs, because wheeled robots
are almost always designed so that all wheels are in ground contact at all times (Gy. Mester,
2009).
Improving Greenhouse’s Automation and Data Acquisition
with Mobile Robot Controlled system via Wireless Sensor Network 87
sensor network (WSN) consisting of small-size wireless sensor nodes equipped with radio
and one or several sensors, is an attractive and cost-efficient option to build the required
measurement system. In this work, we developed a wireless sensor node for greenhouse
monitoring by integrating a sensor platform provided SunSPOT by Sun Microsystems with
few sensors capable to measure four climate variables. Continuous advancements in
wireless technology and miniaturization have made the deployment of sensor networks to
monitor various aspects of the environment increasingly flexible.
2. Mobile platform
Mobile robotics is a young field of research. Its roots include many engineering and science
disciplines, from mechanical, electrical and electronics engineering to computer, cognitive
and social sciences. The Board Of Education is a complete, low-cost development platform
equipped with the needed sensors for humidity, temperature, light, etc. As shown in
Figure 1, the Boe-Bot is a great tool with which to get started with robotics.
Fig. 1. Assembled Boe-Bot
The SunSPOT WSN module makes it possible for the Boe-Bot robot’s BASIC Stamp 2
microcontroller brain to communicate wirelessly with a web based user interface running on
a nearby PC. The BASIC Stamp microcontroller runs a small PBASIC program that controls
the Boe-Bot robot’s servos and optionally monitors sensors while it communicates wirelessly
with the web server.
3. Control scheme for mobile robots
A mobile robot needs locomotion mechanisms that enable it to move throughout its known
or unknown environment. But there are a large variety of possible ways to move, and so the
selection of a robot’s approach to locomotion is an important aspect of mobile robot design.
Figure 2, presents the control scheme for mobile robot systems. In the laboratory, there are
research robots that can walk, jump, run, slide, skate, swim, fly, and, of course, roll. Any of
these activities has its own control algorithm (Gy. Mester, 2009).
Fig. 2. Reference control scheme for mobile robot systems
Locomotion is the complement of manipulation. In manipulation, the robot arm is fixed but
moves objects in the workspace by imparting force to them. In locomotion, the environment
is fixed and the robot moves by imparting force to the environment. In both cases, the
scientific basis is the study of actuators that generate interaction forces, and mechanisms
that implement desired kinematical and dynamic properties. The wheel has been by far the
most popular mechanism in mobile robotics and in man-made vehicles in general. It can
achieve very good efficiencies, and does so with a relatively simple mechanical
implementation. On Figure 3, the kinematics of the mobile robot is depicted. In addition,
balance is not usually a research problem in wheeled robot designs, because wheeled robots
are almost always designed so that all wheels are in ground contact at all times (Gy. Mester,
2009).
Wireless Sensor Networks: Application-Centric Design88
Fig. 3. Robot kinematics and its frames of interests
Thus, three wheels are sufficient to guarantee stable balance, although, as we shall see
below, two-wheeled robots can also be stable (R. Siegwart, 2004). When more than three
wheels are used, a suspension system is required to allow all wheels to maintain ground
contact when the robot encounters uneven terrain. Motion control might not be an easy task
for this kind of systems. However, it has been studied by various research groups, and some
adequate solutions for motion control of a mobile robot system are available (Gy. Mester,
2009).
4. Using Potential Fields method for navigation
A potential field consists of two imaginary fields (attractive potential and repulsive potential)
and used to avoid a collision with unexpected obstacle while moving in a predetermined
path. The Attractive Potential forces the robot to move through a predetermined path and
the Repulsive Field, assumed to be generated by obstacles, forces the robot to move a
different way to avoid the collision (O. Khatib, 1986). The Artificial Potential Field approach
is a local path planner method that was introduced by Khatib. This method defines obstacles
as repelling force sources, and goals as attracting force sources. The path is then influenced
by the composition of the two forces, which produces a robot motion that moves away from
obstacles while moving towards the target goal. The approach is mathematically simple and
is able to produce real-time acceptable results for collision avoidance even in dynamic
environments. The most known limitation of this approach is the local minima, which refers
to locations that trap the robot and prevent it from reaching the target goal location. This
main problem has been addressed by many different techniques that try to solve or at least
minimize its impact (O. Khatib, 1985).
4.1 Attractive Potential Field
The attractive potential field corresponds to the component responsible for the potentials
that attract the robot towards the target goal position. At all locations in the environment the
action vector will point to the target goal.
Fig. 4. Attractive potential field action vectors pointing to the goal and goal representation
(M. Goodrich, 2002)
Usually, the action vector is found by applying a scalar potential field function to the robot's
position and then calculating the gradient of that function.
],[],[
y
U
x
U
yx
(1)
After defining: (M. Goodrich, 2002)
],[
GG
yx as the position of the goal;
r
as the radius of the goal;
],[
RR
yx as the position of the robot;
s as the size of the goal's area of influence;
as the strength of the attractive field
0
We can compute x
and y
using the following steps:
1. Find the distance d between the goal and the robot:
22
)()(
GRRG
yyxxd (2)
2. Find the angle
between the robot and the goal:
RG
RG
xx
yy
1
tan
(3)
Improving Greenhouse’s Automation and Data Acquisition
with Mobile Robot Controlled system via Wireless Sensor Network 89
Fig. 3. Robot kinematics and its frames of interests
Thus, three wheels are sufficient to guarantee stable balance, although, as we shall see
below, two-wheeled robots can also be stable (R. Siegwart, 2004). When more than three
wheels are used, a suspension system is required to allow all wheels to maintain ground
contact when the robot encounters uneven terrain. Motion control might not be an easy task
for this kind of systems. However, it has been studied by various research groups, and some
adequate solutions for motion control of a mobile robot system are available (Gy. Mester,
2009).
4. Using Potential Fields method for navigation
A potential field consists of two imaginary fields (attractive potential and repulsive potential)
and used to avoid a collision with unexpected obstacle while moving in a predetermined
path. The Attractive Potential forces the robot to move through a predetermined path and
the Repulsive Field, assumed to be generated by obstacles, forces the robot to move a
different way to avoid the collision (O. Khatib, 1986). The Artificial Potential Field approach
is a local path planner method that was introduced by Khatib. This method defines obstacles
as repelling force sources, and goals as attracting force sources. The path is then influenced
by the composition of the two forces, which produces a robot motion that moves away from
obstacles while moving towards the target goal. The approach is mathematically simple and
is able to produce real-time acceptable results for collision avoidance even in dynamic
environments. The most known limitation of this approach is the local minima, which refers
to locations that trap the robot and prevent it from reaching the target goal location. This
main problem has been addressed by many different techniques that try to solve or at least
minimize its impact (O. Khatib, 1985).
4.1 Attractive Potential Field
The attractive potential field corresponds to the component responsible for the potentials
that attract the robot towards the target goal position. At all locations in the environment the
action vector will point to the target goal.
Fig. 4. Attractive potential field action vectors pointing to the goal and goal representation
(M. Goodrich, 2002)
Usually, the action vector is found by applying a scalar potential field function to the robot's
position and then calculating the gradient of that function.
],[],[
y
U
x
U
yx
(1)
After defining: (M. Goodrich, 2002)
],[
GG
yx as the position of the goal;
r
as the radius of the goal;
],[
RR
yx as the position of the robot;
s as the size of the goal's area of influence;
as the strength of the attractive field
0
We can compute x
and y
using the following steps:
1. Find the distance d between the goal and the robot:
22
)()(
GRRG
yyxxd (2)
2. Find the angle
between the robot and the goal:
RG
RG
xx
yy
1
tan
(3)
Wireless Sensor Networks: Application-Centric Design90
3. Set
x and y
according to the rules:
If rd then 0
yx
If
rsdr
then
)sin()(
)cos()(
rdy
rdx
(4)
If
rsd then
)sin(
)cos(
sy
sx
The last step presents three simple rules that characterize three different behaviors for the
robot according to its relative position towards the goal:
In the first rule of step 3,
rd
means that the robot is in the goal area. In this
case, no forces act and
x
and
y
are set to zero.
In the second rule,
rsdr
means that the robot is inside the area of
inuence of the goal. The action vector is set using
,
d
and
s
.
In the third and last rule,
rsd
means that the robot is outside the goal
area and also outside its area of influence. The action vector is set to with
s
and
thus reaching higher values.
4.2 Repulsive Potential Field
The repulsive potential field is the component that is responsible for forcing the robot to
stay away from the obstacles it encounters on its path. All repulsive action vectors point
away from the obstacle surface driving the robot away from the obstacle.
Fig. 5. Repulsive potential field action vectors pointing away from the obstacle and obstacle
representation (M. Goodrich, 2002)
Similarly to the Attractive Potential, we calculate the repulsive action vector.
After defining: (M. Goodrich, 2002)
],[
OO
yx as the position of the obstacle;
r
as the radius of the obstacle;
],[
RR
yx as the position of the robot;
s
as the size of the obstacle's area of influence;
as the strength of the repulsive field
0
We can compute
x
and y
using the following steps:
1. Find the distance
d between the obstacle and the robot:
22
)()(
ORRO
yyxxd (5)
2. Find the angle
between the robot and the obstacle:
RO
RO
xx
yy
1
tan
(6)
3. Set
x and y according to the rules:
If
rd then
))(sin(
))(cos(
signy
signx
If
rsdr then
)sin()(
)cos()(
drsy
drsx
(7)
If
rsd
then 0
yx
Similar to the attractive potential rules, these rules are also simple and characterize three
different behaviors for the robot according to its position relative to the obstacle. It is
important to notice that all action vectors need to point away from the obstacle, hence the
need to use negative values (M. Goodrich, 2002).
In the first rule of step 3, the robot is within the radius of the obstacle, so the
action vector needs to be infinite, expressing the need to escape from the robot.
Improving Greenhouse’s Automation and Data Acquisition
with Mobile Robot Controlled system via Wireless Sensor Network 91
3. Set
x and y
according to the rules:
If rd then 0
yx
If
rsdr
then
)sin()(
)cos()(
rdy
rdx
(4)
If
rsd then
)sin(
)cos(
sy
sx
The last step presents three simple rules that characterize three different behaviors for the
robot according to its relative position towards the goal:
In the first rule of step 3,
rd
means that the robot is in the goal area. In this
case, no forces act and
x
and
y
are set to zero.
In the second rule,
rsdr
means that the robot is inside the area of
inuence of the goal. The action vector is set using
,
d
and
s
.
In the third and last rule,
rsd
means that the robot is outside the goal
area and also outside its area of influence. The action vector is set to with
s
and
thus reaching higher values.
4.2 Repulsive Potential Field
The repulsive potential field is the component that is responsible for forcing the robot to
stay away from the obstacles it encounters on its path. All repulsive action vectors point
away from the obstacle surface driving the robot away from the obstacle.
Fig. 5. Repulsive potential field action vectors pointing away from the obstacle and obstacle
representation (M. Goodrich, 2002)
Similarly to the Attractive Potential, we calculate the repulsive action vector.
After defining: (M. Goodrich, 2002)
],[
OO
yx as the position of the obstacle;
r
as the radius of the obstacle;
],[
RR
yx as the position of the robot;
s
as the size of the obstacle's area of influence;
as the strength of the repulsive field
0
We can compute
x
and y
using the following steps:
1. Find the distance
d between the obstacle and the robot:
22
)()(
ORRO
yyxxd (5)
2. Find the angle
between the robot and the obstacle:
RO
RO
xx
yy
1
tan
(6)
3. Set
x and y according to the rules:
If
rd then
))(sin(
))(cos(
signy
signx
If
rsdr then
)sin()(
)cos()(
drsy
drsx
(7)
If
rsd
then 0
yx
Similar to the attractive potential rules, these rules are also simple and characterize three
different behaviors for the robot according to its position relative to the obstacle. It is
important to notice that all action vectors need to point away from the obstacle, hence the
need to use negative values (M. Goodrich, 2002).
In the first rule of step 3, the robot is within the radius of the obstacle, so the
action vector needs to be infinite, expressing the need to escape from the robot.
Wireless Sensor Networks: Application-Centric Design92
In the second rule, where the robot is outside the obstacle's radius but inside its
area of influence, the action vector is set to a high value in order to express the
need to escape the current location.
In the third rule, where the robot is outside the area of influence of the obstacle,
the action vector is set to zero, meaning that no repulsive forces are acting on the
robot (M. Goodrich, 2002).
Since the repulsive force only acts when the robot is inside the area of influence of the
obstacle, the value of
s must be carefully chosen. A small value for s can cause trajectory
problems by causing abrupt changes on the path and some constraints on the speed of the
robot. A large value for s may cause also problems on the robot's movement since it can
constrain movement in small places where the robot could pass.
Fig. 6. Potential Fields simulation
The repulsive force has the objective of repelling the robot only if it is close to an obstacle
and its velocity points towards that obstacle (M. Goodrich, 2002).
4. WSN and Event-Based System for Greenhouse Climate Control
A wireless sensor network (WSN) is a computer network consisting of spatially distributed
autonomous devices using sensors to cooperatively monitor physical or environmental
conditions, such as temperature, sound, vibration, pressure, motion or pollutants, at
different locations (Sun Microsystems, 2002). The development of wireless sensor networks
was originally motivated by military applications such as battlefield surveillance. Figure 7,
presents the sensor node architecture. However, wireless sensor networks are now used in
many civilian application areas, including environment and habitat monitoring, healthcare
applications, home automation, and traffic control.
Fig. 7. Sensor Node Architecture
In addition to one or more sensors, each node in a sensor network is typically equipped with
a radio transceiver or other wireless communications device, a small microcontroller, and an
energy source, usually a battery. Figure 8, shows the typical wireless sensor network.
Fig. 8. Typical wireless sensor network (WSN)
The size a single sensor node can vary from shoebox-sized nodes down to devices the size of
grain of dust. The cost of sensor nodes is similarly variable, ranging from hundreds of
dollars to a few cents, depending on the size of the sensor network and the complexity
required of individual sensor nodes (Sun Microsystems, 2005). Size and cost constraints on
sensor nodes result in corresponding constraints on resources such as energy, memory,
computational speed and bandwidth. In computer science, wireless sensor networks are an
active research area with numerous workshops and conferences arranged each year (S.
Scaglia, 2008). As commented above, this paper is devoted to analyzing diurnal and
nocturnal temperature control with natural ventilation and heating systems, and humidity
control as a secondary control objective. Under diurnal conditions, the controlled variable is
the inside temperature and the control signal is the vent opening. The use of natural
ventilation produces an exchange between the inside and outside air, usually provoking a
decrease in the inside temperature of the greenhouse. The controller must calculate the
Improving Greenhouse’s Automation and Data Acquisition
with Mobile Robot Controlled system via Wireless Sensor Network 93
In the second rule, where the robot is outside the obstacle's radius but inside its
area of influence, the action vector is set to a high value in order to express the
need to escape the current location.
In the third rule, where the robot is outside the area of influence of the obstacle,
the action vector is set to zero, meaning that no repulsive forces are acting on the
robot (M. Goodrich, 2002).
Since the repulsive force only acts when the robot is inside the area of influence of the
obstacle, the value of
s must be carefully chosen. A small value for s can cause trajectory
problems by causing abrupt changes on the path and some constraints on the speed of the
robot. A large value for s may cause also problems on the robot's movement since it can
constrain movement in small places where the robot could pass.
Fig. 6. Potential Fields simulation
The repulsive force has the objective of repelling the robot only if it is close to an obstacle
and its velocity points towards that obstacle (M. Goodrich, 2002).
4. WSN and Event-Based System for Greenhouse Climate Control
A wireless sensor network (WSN) is a computer network consisting of spatially distributed
autonomous devices using sensors to cooperatively monitor physical or environmental
conditions, such as temperature, sound, vibration, pressure, motion or pollutants, at
different locations (Sun Microsystems, 2002). The development of wireless sensor networks
was originally motivated by military applications such as battlefield surveillance. Figure 7,
presents the sensor node architecture. However, wireless sensor networks are now used in
many civilian application areas, including environment and habitat monitoring, healthcare
applications, home automation, and traffic control.
Fig. 7. Sensor Node Architecture
In addition to one or more sensors, each node in a sensor network is typically equipped with
a radio transceiver or other wireless communications device, a small microcontroller, and an
energy source, usually a battery. Figure 8, shows the typical wireless sensor network.
Fig. 8. Typical wireless sensor network (WSN)
The size a single sensor node can vary from shoebox-sized nodes down to devices the size of
grain of dust. The cost of sensor nodes is similarly variable, ranging from hundreds of
dollars to a few cents, depending on the size of the sensor network and the complexity
required of individual sensor nodes (Sun Microsystems, 2005). Size and cost constraints on
sensor nodes result in corresponding constraints on resources such as energy, memory,
computational speed and bandwidth. In computer science, wireless sensor networks are an
active research area with numerous workshops and conferences arranged each year (S.
Scaglia, 2008). As commented above, this paper is devoted to analyzing diurnal and
nocturnal temperature control with natural ventilation and heating systems, and humidity
control as a secondary control objective. Under diurnal conditions, the controlled variable is
the inside temperature and the control signal is the vent opening. The use of natural
ventilation produces an exchange between the inside and outside air, usually provoking a
decrease in the inside temperature of the greenhouse. The controller must calculate the
Wireless Sensor Networks: Application-Centric Design94
necessary vent opening to reach the desired setpoint. The commonest controller used is a
gain scheduling PI scheme where the controller parameters are changed based on some
disturbances: outside temperature and wind speed. In the case of nocturnal temperature
control, forced-air heaters are used to increase the inside temperature and an on/off control
with dead/zone was selected as heating controller.
Fig. 9. Humidity control
Climate monitoring is vitally important to the operation in greenhouses and the quality of
the collected information has a great influence on the precision and accuracy of control
results. Currently, the agro-alimentary market field incorporates diverse data acquisition
techniques (S. Scaglia, 2008). Normally, the type of acquisition system is chosen to be
optimal for the control algorithm to be used. For traditional climate monitoring and control
systems, all sensors are distributed through the greenhouse and connected to the device
performing the control tasks. These equipments use time-based data sampling techniques as
a consequence of using time-based controllers. Figure 10, presents the temperature
controller.
Fig. 10. Temperature controller
Nowadays, commercial systems present more flexibility in the implementation of control
algorithms and sampling techniques, especially WSN, where each node of the network can
be programmed with a different sampling algorithm or local control algorithm with the
main goal of optimizing the overall performance.
4.1 Description of the Sun SPOT WSN module
One of the most poplar technologies in the WSN area is Sun SPOT (Small Programmable
Object Technology). It contains 32-bit ARM9 CPU, 512K memory, 2 Mb flash storage and
wireless networking is based on ChipCon CC2420 following the 802.15.4 standard with
integrated antenna and operates in the 2.4GHz to 2.4835GHz ISM unlicensed bands. The IC
contains a 2.4GHz RF transmitter/receiver with digital direct sequence spread spectrum
(DSSS) baseband modem with MAC support.
Fig. 11. Sun SPOT processor board
The sensor board integrates multiple sensors, monitoring LED and interactive switches into
one board. All the facilities of this board are programmable in Java. The Sun SPOT SDK
comes with two important tools for managing the software on your SPOTs: SPOTManager
and SPOTWorld. The SPOTManager is a tool for managing the Sun SPOT SDK software.
You can use it to download from the Internet both new and old versions of the Sun SPOT
SDK. You can use it to make one or another SDK the active SDK on your host workstation,
and you can use it to download system software to your Sun SPOTs (Sun Microsystems,
2005).
Improving Greenhouse’s Automation and Data Acquisition
with Mobile Robot Controlled system via Wireless Sensor Network 95
necessary vent opening to reach the desired setpoint. The commonest controller used is a
gain scheduling PI scheme where the controller parameters are changed based on some
disturbances: outside temperature and wind speed. In the case of nocturnal temperature
control, forced-air heaters are used to increase the inside temperature and an on/off control
with dead/zone was selected as heating controller.
Fig. 9. Humidity control
Climate monitoring is vitally important to the operation in greenhouses and the quality of
the collected information has a great influence on the precision and accuracy of control
results. Currently, the agro-alimentary market field incorporates diverse data acquisition
techniques (S. Scaglia, 2008). Normally, the type of acquisition system is chosen to be
optimal for the control algorithm to be used. For traditional climate monitoring and control
systems, all sensors are distributed through the greenhouse and connected to the device
performing the control tasks. These equipments use time-based data sampling techniques as
a consequence of using time-based controllers. Figure 10, presents the temperature
controller.
Fig. 10. Temperature controller
Nowadays, commercial systems present more flexibility in the implementation of control
algorithms and sampling techniques, especially WSN, where each node of the network can
be programmed with a different sampling algorithm or local control algorithm with the
main goal of optimizing the overall performance.
4.1 Description of the Sun SPOT WSN module
One of the most poplar technologies in the WSN area is Sun SPOT (Small Programmable
Object Technology). It contains 32-bit ARM9 CPU, 512K memory, 2 Mb flash storage and
wireless networking is based on ChipCon CC2420 following the 802.15.4 standard with
integrated antenna and operates in the 2.4GHz to 2.4835GHz ISM unlicensed bands. The IC
contains a 2.4GHz RF transmitter/receiver with digital direct sequence spread spectrum
(DSSS) baseband modem with MAC support.
Fig. 11. Sun SPOT processor board
The sensor board integrates multiple sensors, monitoring LED and interactive switches into
one board. All the facilities of this board are programmable in Java. The Sun SPOT SDK
comes with two important tools for managing the software on your SPOTs: SPOTManager
and SPOTWorld. The SPOTManager is a tool for managing the Sun SPOT SDK software.
You can use it to download from the Internet both new and old versions of the Sun SPOT
SDK. You can use it to make one or another SDK the active SDK on your host workstation,
and you can use it to download system software to your Sun SPOTs (Sun Microsystems,
2005).
Wireless Sensor Networks: Application-Centric Design96
Fig. 12. Sun SPOT sensor board
The facilities of the sensor board are:
• One 2G/6G 3-axis accelerometer
• One temperature sensor
• One light sensor
• Two 8-bit tri-color LEDs
• 6 analog inputs
• Two momentary switches
• 5 general purpose I/O pins
The internal battery is a 3.7V rechargeable lithium-ion prismatic cell. The battery has
internal protection circuit to guard against over discharge, under voltage and overcharge
conditions. The battery can be charged from either the USB type mini-B device connector or
from an external source with a 5V power supply.
4.2 Wireless radio
The wireless network communications uses an integrated radio transceiver, the TI CC2420
(formerly ChipCon). The CC2420 is IEEE 802.15.4 compliant device and operates in the
2.4GHz to 2.4835GHz ISM unlicensed bands. Regulations for these bands are covered by
FCC CFR47 part 15 (USA), ETSI EN 300 328 and EN 300 440 class 2 device (Europe) and
ARIB STD-T66 (Japan).
The IC contains a 2.4GHz RF transmitter/receiver with digital direct sequence spread
spectrum (DSSS) baseband modem with MAC support. Other features include separate TX
and RX 128 byte FIFOs, AES encryption (currently not supported), received signal strength
indication (RSSI) with 100dB sensitivity and transmit output power setting from -24dBm to
0dBm. Effective bit rate is 250kbps and chip rate is 2000kChips/s. Receive sensitivity is -
90dBm. The digital control and data communications with the CC2420 use PIO port bits and
the SPI channel. The CC2420 is a slave SPI bidirectional device addressed when RF_CS
(PCS2) is asserted active low. PIO ports reset the CC2420 (RF_RST), power it down
(RF_PWDOWN), or check the status of the receive FIFO (FIFO and FIFOP), clear channel
assessment (CCA) and start of frame (SFD). There are 33 configuration and status registers,
15 command registers and two 8-bit registers for the separate transmit and receive FIFOs.
The first byte sent to the CC2420 is the address made up of 6-bit address, RAM/Register
select (Bit 7) and Read/Write select (Bit 6). Following bytes are data read from or written to
the CC2420.
Fig. 13. Typical application circuit for CC2420
The CC2420 is housed in a 48pin quad leadless package (QLP or QFN) that is 7mm square. It
is powered with +3.3V Vcc supply. The CC2420 has an internal 1.8V low drop out regulator
for powering the internal RF and analog circuitry. It consumes 20mA during receive
operation and 18mA for 0dBm transmit. The frequency generation uses an accurate 16MHz
crystal with ±10ppm accuracy, ±10ppm stability and ±1ppm aging. The entire RF section is
enclosed in an upper and lower RF shield and has modular FCC approval.
4.3 I/O pin Manipulation of the SunSPOT module
The SunSPOT’s sensor board has an Atmega88 and operates the 8 tricolor LED’s, the
accelerometer configuration, and the following pins on the I/O header: I/O pins D0 through
D3 can be set as either an output or input.
Improving Greenhouse’s Automation and Data Acquisition
with Mobile Robot Controlled system via Wireless Sensor Network 97
Fig. 12. Sun SPOT sensor board
The facilities of the sensor board are:
• One 2G/6G 3-axis accelerometer
• One temperature sensor
• One light sensor
• Two 8-bit tri-color LEDs
• 6 analog inputs
• Two momentary switches
• 5 general purpose I/O pins
The internal battery is a 3.7V rechargeable lithium-ion prismatic cell. The battery has
internal protection circuit to guard against over discharge, under voltage and overcharge
conditions. The battery can be charged from either the USB type mini-B device connector or
from an external source with a 5V power supply.
4.2 Wireless radio
The wireless network communications uses an integrated radio transceiver, the TI CC2420
(formerly ChipCon). The CC2420 is IEEE 802.15.4 compliant device and operates in the
2.4GHz to 2.4835GHz ISM unlicensed bands. Regulations for these bands are covered by
FCC CFR47 part 15 (USA), ETSI EN 300 328 and EN 300 440 class 2 device (Europe) and
ARIB STD-T66 (Japan).
The IC contains a 2.4GHz RF transmitter/receiver with digital direct sequence spread
spectrum (DSSS) baseband modem with MAC support. Other features include separate TX
and RX 128 byte FIFOs, AES encryption (currently not supported), received signal strength
indication (RSSI) with 100dB sensitivity and transmit output power setting from -24dBm to
0dBm. Effective bit rate is 250kbps and chip rate is 2000kChips/s. Receive sensitivity is -
90dBm. The digital control and data communications with the CC2420 use PIO port bits and
the SPI channel. The CC2420 is a slave SPI bidirectional device addressed when RF_CS
(PCS2) is asserted active low. PIO ports reset the CC2420 (RF_RST), power it down
(RF_PWDOWN), or check the status of the receive FIFO (FIFO and FIFOP), clear channel
assessment (CCA) and start of frame (SFD). There are 33 configuration and status registers,
15 command registers and two 8-bit registers for the separate transmit and receive FIFOs.
The first byte sent to the CC2420 is the address made up of 6-bit address, RAM/Register
select (Bit 7) and Read/Write select (Bit 6). Following bytes are data read from or written to
the CC2420.
Fig. 13. Typical application circuit for CC2420
The CC2420 is housed in a 48pin quad leadless package (QLP or QFN) that is 7mm square. It
is powered with +3.3V Vcc supply. The CC2420 has an internal 1.8V low drop out regulator
for powering the internal RF and analog circuitry. It consumes 20mA during receive
operation and 18mA for 0dBm transmit. The frequency generation uses an accurate 16MHz
crystal with ±10ppm accuracy, ±10ppm stability and ±1ppm aging. The entire RF section is
enclosed in an upper and lower RF shield and has modular FCC approval.
4.3 I/O pin Manipulation of the SunSPOT module
The SunSPOT’s sensor board has an Atmega88 and operates the 8 tricolor LED’s, the
accelerometer configuration, and the following pins on the I/O header: I/O pins D0 through
D3 can be set as either an output or input.
Wireless Sensor Networks: Application-Centric Design98
Fig. 14. The SunSPOT’s sensor board component location
The high current driver pins, H0 to H3, can only be used as an output. If configured as an
output, the pin may be set hi, low, or toggled to its opposite state.
Developing environment for Sun SPOTs
The Java programming language is a general-purpose concurrent class-based object-
oriented programming language, specifically designed to have as few implementation
dependencies as possible. It allows application developers to write a program once and then
be able to run it everywhere on the Internet. Java is a programming language originally
developed by James Gosling at Sun Microsystems and released in 1995 as a core component
of Sun Microsystems' Java platform. The language derives much of its syntax from C and
C++ but has a simpler object model and fewer low-level facilities. Java applications are
typically compiled to bytecode that can run on any Java virtual machine (JVM) regardless of
computer architecture. The original and reference implementation Java compilers, virtual
machines, and class libraries were developed by Sun from 1995. As of May 2007, in
compliance with the specifications of the Java Community Process, Sun made available most
of their Java technologies as free software under the GNU General Public License. One
characteristic of Java is portability, which means that computer programs written in the Java
language must run similarly on any supported hardware/operating-system platform. One
should be able to write a program once, compile it once, and run it anywhere. This is
achieved by compiling the Java language code, not to machine code but to Java bytecode –
instructions analogous to machine code but intended to be interpreted by a virtual machine
(VM) written specifically for the host hardware. End-users commonly use a Java Runtime
Environment (JRE) installed on their own machine for standalone Java applications, or in a
Web browser for Java applets. Standardized libraries provide a generic way to access host
specific features such as graphics, threading and networking. In some JVM versions,
bytecode can be compiled to native code, either before or during program execution,
resulting in faster execution (J. Gosling, 2005). The most popular developing environment
for Java is Netbeans IDE.
Fig. 15. NetBeans IDE 6.5 – Sun SPOT SDK
A major benefit of using bytecode is porting. However, the overhead of interpretation
means that interpreted programs almost always run more slowly than programs compiled
to native executables would, and Java suffered a reputation for poor performance. This gap
has been narrowed by a number of optimization techniques introduced in the more recent
JVM implementations. One such technique, known as just-in-time (JIT) compilation,
translates Java bytecode into native code the first time that code is executed, then caches it.
This results in a program that starts and executes faster than pure interpreted code can, at
the cost of introducing occasional compilation overhead during execution. More
sophisticated VMs also use dynamic recompilation, in which the VM analyzes the behavior
of the running program and selectively recompiles and optimizes parts of the program.
Dynamic recompilation can achieve optimizations superior to static compilation because the
dynamic compiler can base optimizations on knowledge about the runtime environment
and the set of loaded classes, and can identify hot spots - parts of the program, often inner
loops, that take up the most execution time. JIT compilation and dynamic recompilation
allow Java programs to approach the speed of native code without losing portability.
4.4 The Sun SPOT emulator
Solarium includes an emulator capable of running a Sun SPOT application on your desktop
computer. This allows for testing a program before deploying it to a real SPOT, or if a real
SPOT is not available. Instead of a physical sensor board, Solarium displays a virtual SPOT
with a control panel where you can set any of the potential sensor inputs (e.g. light level,
temperature, digital pin inputs, analog input voltages, and accelerometer values). Your
application can control the LEDs' color that is displayed in the virtual SPOT image, just like
it would a real SPOT. You can click with the mouse on the push button switches in the
virtual SPOT image to press and release the switches. Receiving and sending via the radio is
also supported. Each virtual SPOT is assigned its own address and can broadcast or unicast
Improving Greenhouse’s Automation and Data Acquisition
with Mobile Robot Controlled system via Wireless Sensor Network 99
Fig. 14. The SunSPOT’s sensor board component location
The high current driver pins, H0 to H3, can only be used as an output. If configured as an
output, the pin may be set hi, low, or toggled to its opposite state.
Developing environment for Sun SPOTs
The Java programming language is a general-purpose concurrent class-based object-
oriented programming language, specifically designed to have as few implementation
dependencies as possible. It allows application developers to write a program once and then
be able to run it everywhere on the Internet. Java is a programming language originally
developed by James Gosling at Sun Microsystems and released in 1995 as a core component
of Sun Microsystems' Java platform. The language derives much of its syntax from C and
C++ but has a simpler object model and fewer low-level facilities. Java applications are
typically compiled to bytecode that can run on any Java virtual machine (JVM) regardless of
computer architecture. The original and reference implementation Java compilers, virtual
machines, and class libraries were developed by Sun from 1995. As of May 2007, in
compliance with the specifications of the Java Community Process, Sun made available most
of their Java technologies as free software under the GNU General Public License. One
characteristic of Java is portability, which means that computer programs written in the Java
language must run similarly on any supported hardware/operating-system platform. One
should be able to write a program once, compile it once, and run it anywhere. This is
achieved by compiling the Java language code, not to machine code but to Java bytecode –
instructions analogous to machine code but intended to be interpreted by a virtual machine
(VM) written specifically for the host hardware. End-users commonly use a Java Runtime
Environment (JRE) installed on their own machine for standalone Java applications, or in a
Web browser for Java applets. Standardized libraries provide a generic way to access host
specific features such as graphics, threading and networking. In some JVM versions,
bytecode can be compiled to native code, either before or during program execution,
resulting in faster execution (J. Gosling, 2005). The most popular developing environment
for Java is Netbeans IDE.
Fig. 15. NetBeans IDE 6.5 – Sun SPOT SDK
A major benefit of using bytecode is porting. However, the overhead of interpretation
means that interpreted programs almost always run more slowly than programs compiled
to native executables would, and Java suffered a reputation for poor performance. This gap
has been narrowed by a number of optimization techniques introduced in the more recent
JVM implementations. One such technique, known as just-in-time (JIT) compilation,
translates Java bytecode into native code the first time that code is executed, then caches it.
This results in a program that starts and executes faster than pure interpreted code can, at
the cost of introducing occasional compilation overhead during execution. More
sophisticated VMs also use dynamic recompilation, in which the VM analyzes the behavior
of the running program and selectively recompiles and optimizes parts of the program.
Dynamic recompilation can achieve optimizations superior to static compilation because the
dynamic compiler can base optimizations on knowledge about the runtime environment
and the set of loaded classes, and can identify hot spots - parts of the program, often inner
loops, that take up the most execution time. JIT compilation and dynamic recompilation
allow Java programs to approach the speed of native code without losing portability.
4.4 The Sun SPOT emulator
Solarium includes an emulator capable of running a Sun SPOT application on your desktop
computer. This allows for testing a program before deploying it to a real SPOT, or if a real
SPOT is not available. Instead of a physical sensor board, Solarium displays a virtual SPOT
with a control panel where you can set any of the potential sensor inputs (e.g. light level,
temperature, digital pin inputs, analog input voltages, and accelerometer values). Your
application can control the LEDs' color that is displayed in the virtual SPOT image, just like
it would a real SPOT. You can click with the mouse on the push button switches in the
virtual SPOT image to press and release the switches. Receiving and sending via the radio is
also supported. Each virtual SPOT is assigned its own address and can broadcast or unicast
Wireless Sensor Networks: Application-Centric Design100
to the other virtual SPOTs. If a shared base station is available a virtual SPOT can also
interact over the radio with real SPOTs.
Fig. 16. The Sun SPOT Emulator
Virtual SPOTs can communicate with each other by opening radio connections, both
broadcast and point-to-point. Instead of using an actual radio these connections take place
over regular and multicast sockets. When a base station SPOT is connected to the host
computer and a shared base station is running, virtual SPOTs can also use it to communicate
with real SPOTs using the base station’s radio. The advantage of using a shared base station
is that multiple host applications can then all access the radio. One disadvantage is that
communication from a host application to a target SPOT takes two radio hops, in contrast to
the one hop needed with a dedicated base station. Another disadvantage is that run-time
manipulation of the base station SPOT’s radio channel, pan id or output power is not
currently possible. Each virtual SPOT has its own Squawk VM running in a separate process
on the host computer. Each Squawk VM contains a complete host-side radio stack as part of
the SPOT library, which allows the SPOT application to communicate with other SPOT
applications running on the host computer, such as other virtual SPOTs, using sockets or
real SPOTs via radio if a shared base station is running. The current Solarium
implementation is primarily an emulator since it actually runs a SPOT application in a
Squawk VM, just like the VM on a real SPOT. Likewise radio interaction between virtual
SPOTs is emulated with data sent via packets and streams from one (virtual) SPOT to
another. Only the SPOT's interaction with the environment is simulated using a simple
model where the user needs to explicitly set the current sensor values. Future versions may
incorporate more simulation of SPOT properties like battery level or radio range.
5. Solution
Building and programming a robot is a combination of mechanics, electronics, and problem
solving. What you're about to learn while doing the activities and projects in this text will be
relevant to "real world" applications that use robotic control, the only difference being the size
and sophistication. Robotics has come a long way, especially for mobile robots. In the past,
mobile robots were controlled by heavy, large, and expensive computer systems that could not
be carried and had to be linked via cable or wireless devices. As shown in Figure 8, the mobile
measuring station is navigating inside the greenhouse. Today, however, we can build small
mobile robots with numerous actuators and sensors that are controlled by inexpensive, small,
and light embedded computer systems that are carried on-board the robot.
Fig. 17. Greenhouse top view with the mobile measuring station
The mechanical principles, example program listings, and circuits you will use are very similar
to, and sometimes the same as, industrial applications developed by engineers. In this project
we have used SunSPOT-s to achieve remote control over a Boe-Bot. For this project we have
used 2 SunSPOT-s from the kit (free range and base station module) as depicted on Figure 18.
SunSPOT's wireless protocol is Zigbee based protocol (I. Matijevics, 2008).
Fig. 18. Connection of the system
The Hardware basically centers around Sun SPOT and DC Motors controlled by Basic
Stamp. The Sun SPOT base station will send data to Sun SPOT on the mobile measuring
station which will drive the Basic Stamp controller to DC IO pins (J. Simon, 2009). The
microcontroller will drive the Motors which will run the measuring station. Figure 19,
shows the testing phase of the mobile measuring station.
Improving Greenhouse’s Automation and Data Acquisition
with Mobile Robot Controlled system via Wireless Sensor Network 101
to the other virtual SPOTs. If a shared base station is available a virtual SPOT can also
interact over the radio with real SPOTs.
Fig. 16. The Sun SPOT Emulator
Virtual SPOTs can communicate with each other by opening radio connections, both
broadcast and point-to-point. Instead of using an actual radio these connections take place
over regular and multicast sockets. When a base station SPOT is connected to the host
computer and a shared base station is running, virtual SPOTs can also use it to communicate
with real SPOTs using the base station’s radio. The advantage of using a shared base station
is that multiple host applications can then all access the radio. One disadvantage is that
communication from a host application to a target SPOT takes two radio hops, in contrast to
the one hop needed with a dedicated base station. Another disadvantage is that run-time
manipulation of the base station SPOT’s radio channel, pan id or output power is not
currently possible. Each virtual SPOT has its own Squawk VM running in a separate process
on the host computer. Each Squawk VM contains a complete host-side radio stack as part of
the SPOT library, which allows the SPOT application to communicate with other SPOT
applications running on the host computer, such as other virtual SPOTs, using sockets or
real SPOTs via radio if a shared base station is running. The current Solarium
implementation is primarily an emulator since it actually runs a SPOT application in a
Squawk VM, just like the VM on a real SPOT. Likewise radio interaction between virtual
SPOTs is emulated with data sent via packets and streams from one (virtual) SPOT to
another. Only the SPOT's interaction with the environment is simulated using a simple
model where the user needs to explicitly set the current sensor values. Future versions may
incorporate more simulation of SPOT properties like battery level or radio range.
5. Solution
Building and programming a robot is a combination of mechanics, electronics, and problem
solving. What you're about to learn while doing the activities and projects in this text will be
relevant to "real world" applications that use robotic control, the only difference being the size
and sophistication. Robotics has come a long way, especially for mobile robots. In the past,
mobile robots were controlled by heavy, large, and expensive computer systems that could not
be carried and had to be linked via cable or wireless devices. As shown in Figure 8, the mobile
measuring station is navigating inside the greenhouse. Today, however, we can build small
mobile robots with numerous actuators and sensors that are controlled by inexpensive, small,
and light embedded computer systems that are carried on-board the robot.
Fig. 17. Greenhouse top view with the mobile measuring station
The mechanical principles, example program listings, and circuits you will use are very similar
to, and sometimes the same as, industrial applications developed by engineers. In this project
we have used SunSPOT-s to achieve remote control over a Boe-Bot. For this project we have
used 2 SunSPOT-s from the kit (free range and base station module) as depicted on Figure 18.
SunSPOT's wireless protocol is Zigbee based protocol (I. Matijevics, 2008).
Fig. 18. Connection of the system
The Hardware basically centers around Sun SPOT and DC Motors controlled by Basic
Stamp. The Sun SPOT base station will send data to Sun SPOT on the mobile measuring
station which will drive the Basic Stamp controller to DC IO pins (J. Simon, 2009). The
microcontroller will drive the Motors which will run the measuring station. Figure 19,
shows the testing phase of the mobile measuring station.
Wireless Sensor Networks: Application-Centric Design102
Fig. 19. Boe-bot with SunSPOT mounted
6. Experimental results
The applications for WSNs are many and varied. They are used in commercial and
industrial applications to monitor data that would be difficult or expensive to monitor using
wired sensors. They could be deployed in wilderness areas, where they would remain for
many years (monitoring some environmental variable) without the need to
recharge/replace their power supplies. They could form a perimeter about a property and
monitor the progression of intruders (passing information from one node to the next). There
are a many uses for WSNs (I. Matijevics, 2009).
Fig. 20. Crops in greenhouse
Typical applications of WSNs include monitoring, tracking, and controlling. Some of the
specific applications are habitat monitoring, object tracking, nuclear reactor controlling, fire
detection, traffic monitoring, etc. In a typical application, a WSN is scattered in a region
where it is meant to collect data through its sensor node. Figure 23, shows the complete
control system of the greenhouse. The WSN-based controller has allowed a considerable
decrease in the number of changes in the control action and made possible a study of the
compromise between quantity of transmission and control performance.
Fig. 21. Capsicum
Motion control of mobile robots is a very important research field today, because mobile
robots are a very interesting subject both in scientific research and practical applications. In
this paper the object of the remote control is the Boe-Bot. The vehicle has two driving wheels
and the angular velocities of the two wheels are independently controlled (A. Pawlowski,
2009). When the vehicle is moving towards the target and the sensors detect an obstacle, an
avoiding strategy is necessary. The host system connects to the mobile robot with the
SunSPOT module. A remote control program has been implemented as shown on Figure 22.
Improving Greenhouse’s Automation and Data Acquisition
with Mobile Robot Controlled system via Wireless Sensor Network 103
Fig. 19. Boe-bot with SunSPOT mounted
6. Experimental results
The applications for WSNs are many and varied. They are used in commercial and
industrial applications to monitor data that would be difficult or expensive to monitor using
wired sensors. They could be deployed in wilderness areas, where they would remain for
many years (monitoring some environmental variable) without the need to
recharge/replace their power supplies. They could form a perimeter about a property and
monitor the progression of intruders (passing information from one node to the next). There
are a many uses for WSNs (I. Matijevics, 2009).
Fig. 20. Crops in greenhouse
Typical applications of WSNs include monitoring, tracking, and controlling. Some of the
specific applications are habitat monitoring, object tracking, nuclear reactor controlling, fire
detection, traffic monitoring, etc. In a typical application, a WSN is scattered in a region
where it is meant to collect data through its sensor node. Figure 23, shows the complete
control system of the greenhouse. The WSN-based controller has allowed a considerable
decrease in the number of changes in the control action and made possible a study of the
compromise between quantity of transmission and control performance.
Fig. 21. Capsicum
Motion control of mobile robots is a very important research field today, because mobile
robots are a very interesting subject both in scientific research and practical applications. In
this paper the object of the remote control is the Boe-Bot. The vehicle has two driving wheels
and the angular velocities of the two wheels are independently controlled (A. Pawlowski,
2009). When the vehicle is moving towards the target and the sensors detect an obstacle, an
avoiding strategy is necessary. The host system connects to the mobile robot with the
SunSPOT module. A remote control program has been implemented as shown on Figure 22.