Bioluminescence Recent Advances in Oceanic Measurements and Laboratory Applications Part 1 docx
Bạn đang xem bản rút gọn của tài liệu. Xem và tải ngay bản đầy đủ của tài liệu tại đây (1.63 MB, 15 trang )
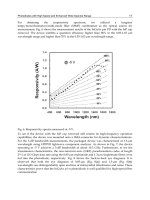
BIOLUMINESCENCE –
RECENT ADVANCES IN
OCEANIC MEASUREMENTS
AND LABORATORY
APPLICATIONS
Edited by David Lapota
Bioluminescence
– Recent Advances in Oceanic Measurements and Laboratory Applications
Edited by David Lapota
Published by InTech
Janeza Trdine 9, 51000 Rijeka, Croatia
Copyright © 2011 InTech
All chapters are Open Access distributed under the Creative Commons Attribution 3.0
license, which allows users to download, copy and build upon published articles even for
commercial purposes, as long as the author and publisher are properly credited, which
ensures maximum dissemination and a wider impact of our publications. After this work
has been published by InTech, authors have the right to republish it, in whole or part, in
any publication of which they are the author, and to make other personal use of the
work. Any republication, referencing or personal use of the work must explicitly identify
the original source.
As for readers, this license allows users to download, copy and build upon published
chapters even for commercial purposes, as long as the author and publisher are properly
credited, which ensures maximum dissemination and a wider impact of our publications.
Notice
Statements and opinions expressed in the chapters are these of the individual contributors
and not necessarily those of the editors or publisher. No responsibility is accepted for the
accuracy of information contained in the published chapters. The publisher assumes no
responsibility for any damage or injury to persons or property arising out of the use of any
materials, instructions, methods or ideas contained in the book.
Publishing Process Manager Martina Durovic
Technical Editor Teodora Smiljanic
Cover Designer InTech Design Team
First published January, 2012
Printed in Croatia
A free online edition of this book is available at www.intechopen.com
Additional hard copies can be obtained from
Bioluminescence – Recent Advances in Oceanic Measurements and Laboratory
Applications, Edited by David Lapota
p. cm.
ISBN 978-953-307-940-0
Contents
Preface IX
Part 1 Oceanic Measurements of Bioluminescence 1
Chapter 1 Long Term Dinoflagellate Bioluminescence,
Chlorophyll, and Their Environmental Correlates
in Southern California Coastal Waters 3
David Lapota
Chapter 2 Seasonal Changes of Bioluminescence in
Photosynthetic and Heterotrophic Dinoflagellates
at San Clemente Island 27
David Lapota
Part 2 Bioluminescence Imaging Methods 47
Chapter 3 Bioluminescent Proteins: High Sensitive Optical
Reporters for Imaging Protein-Protein Interactions
and Protein Foldings in Living Animals 49
Ramasamy Paulmurugan
Chapter 4 Quantitative Assessment of Seven Transmembrane
Receptors (7TMRs) Oligomerization by Bioluminescence
Resonance Energy Transfer (BRET) Technology 81
Valentina Kubale,
Luka Drinovec and Milka Vrecl
Chapter 5 Use of ATP Bioluminescence for Rapid Detection
and Enumeration of Contaminants: The Milliflex Rapid
Microbiology Detection and Enumeration System 99
Renaud Chollet and Sébastien Ribault
Chapter 6 Development of a pH-Tolerant
Thermostable Photinus pyralis
Luciferase for Brighter In Vivo Imaging 119
Amit Jathoul, Erica Law, Olga Gandelman,
Martin Pule, Laurence Tisi and Jim Murray
VI Contents
Chapter 7 Bioluminescence Applications in
Preclinical Oncology Research 137
Jessica Kalra and Marcel B. Bally
Part 3 Bacterial Bioluminescence 165
Chapter 8 Oscillation in Bacterial Bioluminescence 167
Satoshi Sasaki
Preface
As someone who has spent more than 33 years studying the bioluminescence
phenomenon in the world’s oceans, I am continuously amazed by the many
bioluminescence adaptations marine and terrestrial animals have developed to ensure
their existence. It can hardly be considered a random occurrence as it has developed
among various types of organisms, such as single celled dinoflagellates to the much
more complex forms such as shrimp, fish, squid beetles, and worms. Bioluminescence
has many functions, from predator-prey interactions and courtship, to camouflage and
alert status from potential predators.
We now find ourselves utilizing luciferase – luciferin proteins, ATP, genes and the
whole complexities of these interactions to observe and follow the progress or
inhibition of tumors in animal models by measuring bioluminescence intensity,
spatially and temporally using highly sophisticated camera systems. The following
chapters describe applications in preclinical oncology research by bioluminescence
imaging (BLI) with a variety of applications. Two other chapters describe current
methodologies for rapid detection of contaminants using the Milliflex system, and the
use of bioluminescence resonance energy transfer (BRET) technology for monitoring
physical interactions between proteins in living cells. Others are using bioluminescent
proteins for high sensitive optical reporters imaging in living animals, developing pH-
tolerant luciferase for brighter in vivo imaging, and oscillation characteristics in
bacterial bioluminescence. Lastly, using recent data, two chapters describe the long-
term seasonal characteristics of oceanic bioluminescence and the responsible
planktonic species producing bioluminescence. Such studies are few and rare.
I hope that after you read these chapters, many more questions will come to mind,
which will encourage further studies into this fascinating area.
Dr David Lapota
Space and Naval Warfare Systems Center, Pacific
San Diego, California
U.S.A.
Part 1
Oceanic Measurements of Bioluminescence
1
Long Term Dinoflagellate
Bioluminescence, Chlorophyll, and Their
Environmental Correlates in
Southern California Coastal Waters
David Lapota
Space and Naval Warfare Systems Center, Pacific
USA
1. Introduction
While many oceanographic studies have focused on the distribution of bioluminescence in
the marine environment (Stukalin 1934, Tarasov 1956, Seliger et al. 1961, Clarke and Kelly
1965, Bityukov 1967, Lapota and Losee 1984, Swift et al. 1985, Lapota et al. 1988, Batchelder
and Swift 1989, Lapota et al. 1989, Lapota and Rosenberger 1990, Neilson et al. 1995,
Ondercin et al. 1995, Swift et al. 1995), little understanding of the seasonality and sources of
planktonic bioluminescence in coastal waters and open ocean has emerged. Some previous
studies with respect to annual cycles of bioluminescence were severely limited in duration
as well as in the methods used to quantify bioluminescence (Bityukov 1967, Tett 1971). Only
a few studies have measured bioluminescence on an extended basis, and these were short in
duration, usually less than 2 years with long intervals between sets of measurements
(Bityukov 1967, Yentsch and Laird 1968, Tett 1971). Others report data collected at different
times of the year (Batchelder and Swift 1989, Batchelder et al. 1992, Buskey 1991) but do not
address the seasonality of bioluminescence. Thus the detailed temporal variability of
bioluminescence has never been characterized continuously over several years. Lack of such
long-term studies leaves unanswered important questions regarding the role of
bioluminescence in successional phenomena.
To adequately understand, model, and predict planktonic bioluminescence in any ocean,
measurements must be conducted on a continual basis for at least several years in order to
evaluate intra- and annual variability and long-term trends. In this study, bioluminescence
was measured at two fixed stations on a daily long term basis: one in San Diego Bay (SDB)
for 4 years (1992-1996) and the other for 2.5 years (1993-1996) at San Clemente Island (SCI),
located 100 km off the California coast. Additional surface and at-depth bioluminescence
data have been collected on a monthly and quarterly basis at both fixed stations and from a
research vessel to provide a link between coastal and offshore waters. Additional factors
such as seawater temperature, salinity, beam attenuation, and chlorophyll fluorescence were
measured. Plankton collections were made weekly in SDB and monthly at SCI. This study
provides unique correlated coastal and open ocean data collected on a long-term basis
(Figure 1).
Bioluminescence – Recent Advances in Oceanic Measurements and Laboratory Applications
4
2. Methods and materials
2.1 Bioluminescence measurements
Two defined excitation moored bathyphotometers (MOORDEX, University of California,
Santa Barbara) were used in San Diego Bay (SDB) and at San Clemente Island (SCI). Under
control of on-board computers, these measured stimulated bioluminescence, flow rate, and
seawater temperature hourly. Every hour, seawater was pumped for 120 sec at 7-8 L
sec
-1
for
a total volume of approximately 840 - 960 L of seawater through a darkened cylindrical 5 l
detection chamber approximately 406 mm long and 127 mm in diameter (Case et al. 1993,
Neilson et al. 1995). Bioluminescence, excited by the chamber spanning input impeller, was
measured by a PMT receiving light from 46 fiber optics tips lining the chamber wall and
expressed as photons sec
-1
ml
-1
of seawater.
On monthly transits between SDB and SCI an "on-board" sensor system sampled
seawater continuously from 3m below the sea surface from a 50m research vessel, the R/V
Acoustic Explorer, measuring bioluminescence, seawater temperature, and salinity
(Lapota and Losee 1984, Lapota et al. 1988, 1989). A vertically deployed bathyphotometer
capable of measuring bioluminescence, temperature, salinity, beam attenuation, and
chlorophyll fluorescence to a depth of 100m was used at 4 month intervals (summer, fall,
winter, spring) at various stations in the Bight to examine the seasonal changes in the
biological and physical structure of the water column (Lapota et at. 1989). Both systems
were calibrated with the luminescent bacteria Vibrio harveyii in a Quantalum 2000 silicon-
photodiode detector. The detector calibration is traceable to a luminol light standard
(Matheson et al. 1984).
2.2 Plankton and seawater analysis
Water and plankton samples were collected at 10 stations within the Bight (Figure 1).
Monthly transits were made from March 1994 through June 1996 from SCI to SDB to
measure surface (3m depth) bioluminescence and collect plankton and seawater samples to
determine Chl a content. At SDB, weekly plankton and water samples were taken for 4 years
while monthly plankton and water samples were collected at SCI for 2.5 years. Because
plankton abundance within SDB is usually high, 10 L water samples were concentrated
while 40 l samples were filtered for plankton at SCI. Fifteen-liter water samples were
collected and filtered from select bathyphotometer depths on the quarterly stations (10, 20,
30, 40, 50, 70, and 90 m). This was accomplished by discharging the bathyphotometer's
effluent from its submersible pump through a 130-m long, 2.54 cm (I.D.) hose into a 15 liter
Imhoff settling cone. The bottom of the cone was modified with a valve that allowed water
to be filtered into collection cups fitted with 20-µm porosity netting. One liter of seawater
(unfiltered) was also collected at the each of these depths and frozen in precleaned
polycarbonate bottles for later chlorophyll and nutrient analysis. Plankton samples were
preserved in a 5% formalin seawater solution. Bioluminescent dinoflagellates were
identified to the species level when possible. Chlorophyll a was extracted from the seawater
samples using standard methods (APHA 1981) and measured by fluorescence as an estimate
of biomass on a Turner Model 112 fluorometer (Sequoia-Turner Corp., Mountain View, CA,
U.S.A.) and reported as µg L
-1
.
Long Term Dinoflagellate Bioluminescence, Chlorophyll,
and Their Environmental Correlates in Southern California Coastal Waters
5
Fig. 1. Bioluminescent study area and cruise track of stations within the Southern California
Bight.
2.3 Upwelling, rainfall, and seawater nutrient data bases
Upwelling indices (North Pacific Ocean wind-driven transports) were collected from 1992
through 1996. The indices were computed for 33°N latitude (Schwing et al. 1996) and
represent monthly average surface pressure data in cubic meters per second along each 100
m of coastline (Bakun 1973, Eppley 1986). Monthly rainfall data were acquired from the
National Weather Service in San Diego. Nutrient and Chl a data were accessed from
archived CALCOFI data (1992-1996) in the Bight and were averaged along CALCOFI lines
90 and 93 which run west from San Diego to the north and south of San Clemente Island
(Hayward et al. 1996). Nitrates (µm L
-1
) and Chl a (µg L
-1
) along each of the CALCOFI transit
lines (stations 93-26 to 93.45 and 90-28 to 90.53) were averaged from the surface to a depth of
50m for 12 cruises conducted from September 1992 through April 1995. These data were
used to calculate correlations with bioluminescence, rainfall, and upwelling at SDB.
3. Results
3.1 Mean monthly bioluminescence
Hourly bioluminescence data were averaged for each month. Because minimal
bioluminescence was measured during daylight hours, mean monthly values were based on
data collected from 2100 h (9:00 P.M.) to 0300 h (3 A.M.) the following day.
Seasonal changes in bioluminescence were observed in SDB. Maximum bioluminescence (1
x 10
8
photons s
-1
ml
-1
or greater as a threshold) was measured from March through
September for 1993, May through June for 1994, December through May for 1995, and
March through April 1996. Minimum bioluminescence (less than 1 x 10
8
photons s
-1
ml
-1
)