Evapotranspiration Remote Sensing and Modeling Part 11 doc
Bạn đang xem bản rút gọn của tài liệu. Xem và tải ngay bản đầy đủ của tài liệu tại đây (6.25 MB, 30 trang )
Evapotranspiration of Partially Vegetated Surfaces
289
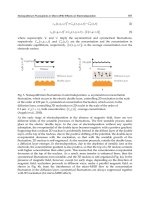
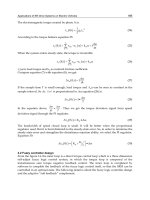
Fig. 6. Evapotranspiration and transpiration estimated by the Surface Energy Balance (SEB)
model and ET measured by an eddy covariance system for a 5-day period with partial
canopy cover.
Hourly measurements and SEB predictions for the three five-day periods were combined
to evaluate the overall performance of the model (Figure 9). Results show variation about
the 1:1 line; however, there is a strong correlation and the data are reasonably well
distributed about the line. Modeled ET is less than measured for latent heat fluxes above
450 W m
-2
. The model underestimates ET during hours with high values of vapor pressure
deficit (Figure 6 and 8), this suggests that the linear effect of vapor pressure deficit in
canopy resistance estimated with equation (30) produce a reduction on ET estimations.
Further work is required to evaluate and explore if different canopy resistance models
improve the performance of ET predictions under these conditions. Various statistical
techniques were used to evaluate the performance of the model. The coefficient of
determination, Nash-Sutcliffe coefficient, index of agreement, root mean square error and
the mean absolute error were used for model evaluation (Legates & McCabe 1999; Krause
et al., 2005; Moriasi et al., 2007; Coffey et al. 2004). The coefficient of determination was
0.92 with a slope of 0.90 over the range of hourly ET values. The root mean square error
was 41.4 W m
-2
, the mean absolute error was 29.9 W m
-2
, the Nash-Sutcliffe coefficient was
0.92 and the index of agreement was 0.97. The statistical parameters show that the model
represents field measurements reasonably well. Similar performance was obtained for
daily ET estimations (Table 1). Analysis is underway to evaluate the model for more
conditions and longer periods. Simulations reported here relied on literature-reported
parameter values. We are also exploring calibration methods to improve model
performance.
-100
0
100
200
300
400
500
6/24 6/25 6/26 6/27 6/28 6/29
Evaporative Flux, W m
-2
Date
Eddy Covariance ET
SEB ET
SEB Transpiration
LAI = 1.5
Evapotranspiration – Remote Sensing and Modeling
290
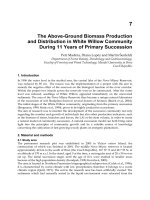
Fig. 7. Environmental conditions for 5-day period with full canopy cover for net radiation
(Rn), air temperature (Ta), soil temperature (Tm), precipitation (Prec), vapor pressure deficit
(VPD) and wind speed (u).
0
5
10
15
20
25
30
35
400
5
10
15
20
25
30
35
40
7/16 7/17 7/18 7/19 7/20 7/21
Precipitation, mm
VPD (mb) and Wind Speed (m s
-1
)
Date
Prec
u
VPD
LAI = 5.4
0
5
10
15
20
25
30
35
40
45
-100
0
100
200
300
400
500
600
700
800
7/16 7/17 7/18 7/19 7/20 7/21
Temperature (
o
C)
W m
-2
Date
Rn
T
m
T
a
Evapotranspiration of Partially Vegetated Surfaces
291
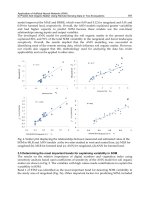
Fig. 8. Evapotranspiration and transpiration estimated by the Surface Energy Balance (SEB)
model and ET measured by an eddy covariance system during a period with full canopy
cover.
Fig. 9. Measured versus modeled hourly latent heat fluxes.
-100
0
100
200
300
400
500
600
700
7/16 7/17 7/18 7/19 7/20 7/21
Evaporative Flux, W m
-2
Date
Eddy Covariance E
T
S
EB ET
SEB Transpiration
LAI = 5.4
y = 0.90x - 0.80
r² = 0.92
-100
0
100
200
300
400
500
600
-100 0 100 200 300 400 500 600
Latent Heat SEB Model (W m
-2
)
Latent Heat Eddy Cov. (W m
-2
)
Evapotranspiration – Remote Sensing and Modeling
292
LAI Evapotranspiration (mm day
-1
)
Date m
2
m
-2
SEB EC
6-Jun 0 3.2 3.7
7-Jun 0 0.7 1.4
8-Jun 0 2.3 3.2
9-Jun 0 3.5 2.7
10-Jun 0 2.4 3.5
24-Jun 1.5 2.9 4.4
25-Jun 1.5 1.7 2.1
26-Jun 1.5 4.1 4.3
27-Jun 1.5 4.0 5.0
28-Jun 1.5 3.8 4.7
16-Jul 5.4 5.1 5.1
17-Jul 5.4 5.8 6.8
18-Jul 5.4 5.2 5.0
19-Jul 5.4 5.0 4.1
20-Jul 5.4 5.1 5.4
Table 1. Daily evapotranspiration estimated with the Surface Energy Balance (SEB) model
and measured from the Eddy Covariance (EC) system.
2.2 The modified SEB model for Partially Vegetated surfaces (SEB-PV)
Although good performance of multiple-layer models has been recognized, multiple-layer
models estimate more accurate ET values under high LAI conditions. Lagos (2008)
evaluated the SEB model for maize and soybean under rainfed and irrigated conditions;
results indicate that during the growing season, the model more accurately predicted ET
after canopy closure (after LAI=4) than for low LAI conditions. The SEB model, similar to S-
W and C-M models, is based on homogeneous land surfaces. Under low LAI conditions, the
land surface is partially covered by the canopy and soil evaporation takes place from soil
below the canopy and areas of bare soil directly exposed to net radiation. However, in
multiple-layer models, evaporation from the soil has been only considered below the
canopy and hourly variations in the partitioning of net radiation between the canopy and
the soil is often disregarded. Soil evaporation on partially vegetated surfaces & inorchards
and natural vegetation include not only soil evaporation beneath the canopy but also
evaporation from areas of bare soil that contribute directly to total ET.
Recognizing the need to separate vegetation from soil and considering the effect of residue
on evaporation, we extended the SEB model to represent those common conditions. The
modified model, hereafter the SEB-PV model, distributes net radiation (Rn), sensible heat
(H), latent heat (E), and soil heat fluxes (G) through the soil/residue/canopy system.
Similar to the SEB model, horizontal gradients of the potentials are assumed to be small
enough for lateral fluxes to be ignored, and physical and biochemical energy storage terms
in the canopy/residue/soil system are assumed to be negligible. The evaporation of water
on plant leaves due to rain, irrigation or dew is also ignored.
The SEB-PV model has the same four layers described previously for SEB (Figure 10):the
first extended from the reference height above the vegetation and the sink for momentum
within the canopy, a second layer between the canopy level and the soil surface, a third
Evapotranspiration of Partially Vegetated Surfaces
293
layer corresponding to the top soil layer and a lower soil layer where the soil atmosphere is
saturated with water vapor.
Total latent heat (E) is the sum of latent heat from the canopy (Ec), latent heat from the
soil (Es) beneath the canopy, latent heat from the residue-covered soil (Er) beneath the
canopy, latent heat from the soil (Ebs) directly exposed to net radiation and latent heat
from the residue-covered soil (Ebr) directly exposed to net radiation.
λE=
[
λE
+λE
(
1−f
)
+λE
f
]
F
+
[
λE
(1−f
)
]
(
1−F
)
(37)
Where fr is the fraction of the soil affected by residue and Fv is the fraction of the soil
covered by vegetation. Similarly, sensible heat is calculated as the sum of sensible heat from
the canopy (Hc), sensible heat from the soil (Hs) and sensible heat from the residue covered
soil (Hr), sensible heat from the soil (bs) directly exposed to net radiation and latent heat
from the residue-covered soil (Hbr) directly exposed to net radiation.
H=[Hc+Hs(1−fr)+Hrfr]Fv+[Hbs(1−fr)+Hbrfr](1−Fv) (38)
For the fraction of the soil covered by vegetation, the total net radiation is divided into that
absorbed by the canopy (Rnc) and the soil beneath the canopy (Rns) and is given by Rn =
Rnc + Rns. The net radiation absorbed by the canopy is divided into latent heat and sensible
heat fluxes as Rnc = Ec + Hc. Similarly, for the soil Rns = Gos + Hs, where Gos is a
conduction term downwards from the soil surface and is expressed as Gos = Es + Gs,
where Gs is the soil heat flux for bare soil. Similarly, for the residue covered soil Rns = Gor +
Hr where Gor is the conduction downwards from the soil covered by residue. The
conduction is given by Gor = Er + Gr where Gr is the soil heat flux for residue-covered soil.
For the area without vegetation, total net radiation is divided into latent and sensible heat
fluxes as Rn = Ebs +Ebr + Hbs + Hbr.
The differences in vapor pressure and temperature between levels can be expressed with an
Ohm’s law analogy using appropriate resistance and flux terms (Figure 10). Latent and
sensible flux terms with in the resistance network were combined and solved to estimate
total fluxes. The solution gives the latent and sensible heat fluxes from the canopy, the soil
beneath the canopy and the soil covered by residue beneath the canopy similar to equations
(9), (10), (11), (12) and (13).
The new expressions for latent heat flux of bare soil and soil covered by residue, both
directly exposed to net radiation are:
For bare soil:
λE
=
(
R
∙∆∙(r
)
∙r
+ρ∙C
∙
(
e
∗
−e
)
∙r
+r
+r
+
(
T
−T
)
∙∆∙(r
+r
))
γ∙
(
r
+r
)
∙
(
r
+r
+r
)
+∆∙r
∙(r
+r
)
(39)
For residue covered soil:
λ
E
br
=
R
n
∙∆∙
(
r
2b
+r
rh
)
∙r
L
+ρ ∙C
p
∙(
(
e
b
∗
−e
b
)
∙
(
r
u
+r
L
+r
2b
+r
rh
)
+
(
T
m
−T
b
)
∙∆∙
(
r
u
+r
2b
+r
r
)
)
γ ∙
(
r
2b
+r
s
+r
r
)
∙
(
r
u
+r
L
+r
2b
+r
rh
)
+∆∙r
L
∙(r
u
+r
2b
+r
rh
)
(40)
These relationships define the surface energy balance model, which is applicable to
conditions ranging from closed canopies to surfaces partially covered by vegetation. If Fv =
1 the model SEB-PV is similar to the original SEB model and with Fv=1 without residue, the
model is similar to that by Choudhury and Monteith (1988).
Evapotranspiration – Remote Sensing and Modeling
294
Fig. 10. Schematic resistance network of the modified Surface Energy Balance (SEB - PV)
model for partially vegetated surfaces a) Sensible heat flux and b) Latent heat flux.
Evapotranspiration of Partially Vegetated Surfaces
295
2.2.1 Model resistances
Model resistances are similar to those described by the SEB model; however, a new
aerodynamic resistance (r
2b
) for the transfer of heat and water flux is required for the surface
without vegetation.
The aerodynamic resistance between the soil surface and Zm (r
2b
) could be calculated by
assuming that the soil directly exposed to net radiation is totally unaffected by adjacent
vegetation as:
r
=
ln
z
z
´
k
u
(41)
According to Brenner and Incoll (1997), actual aerodynamic resistance (r
2b
) will vary
between r
as
for Fv=0 and r
2
when the fractional vegetative cover Fv=1. The form of the
functional relationship of this change is not known, r
2b
was varied linearly between r
as
and
r
2
as:
r
=FV
(
r
)
+
(
1−FV
)
(r
) (42)
2.2.2 Model inputs
The proposed SEB-PV model requires the same inputs of the SEB model plus the fraction of
the surface covered by vegetation (Fv).
2.3 Sensitivity analysis
A sensitivity analysis was performed to evaluate the response of the SEB model to
changes in resistances and model parameters. Meteorological conditions, crop
characteristics and soil/residue characteristics used in these calculations are given in
Table 2. Such conditions are typical for midday during the growing season of maize in
southeastern Nebraska. The sensitivity of total latent heat from the system was explored
when model resistances and model parameters were changed under different LAI
conditions. The effect of the changes in model parameters and resistances were expressed
as changes in total ET (λE) and changes in the crop transpiration ratio. The transpiration
ratio is the ratio between crop transpiration (Ec) over total ET (transpiration ratio= Ec /
E).
The response of the SEB model was evaluated for three values of the extinction coefficient
(Cext = 0.4, 0.6 and 0.8), three conditions of vapor pressure deficit (VPDa = 0.5 kPa, 0.1 kPa
and 0.25 kPa) three soil temperatures (T
m
=21
°
C, 0.8xT
m
=16.8
°
C and 1.2xT
m
=25.2
°
C) (Figure
11), changes in the parameterization of aerodynamic resistances (the attenuation coefficient,
= 1, 2.5 and 3.5), the mean boundary layer resistance, r
b
(±40% ) the crop height, h (±30%)),
selected conditions for the soil surface resistance, r
s
( 0, 227, and 1500 s m
-1
) (Figure 12), four
values for residue resistance, r
r
(0, 400, 1000, and 2500 s m
-1
), and changes of ±30% in surface
canopy resistance, r
c
(Figure 13).
In general, the sensitivity analysis of model resistances showed that simulated ET was most
sensitive to changes in surface canopy resistance for LAI > 0.5 values, and soil surface
resistance and residue surface resistance for small LAI values (LAI < ~3). The model was
less sensitive to changes in the other parameters evaluated.
Evapotranspiration – Remote Sensing and Modeling
296
Variable S
y
mbol Value Unit
Net Radiatio
n
R
n
500 W m
-2
Air temperature Ta 25
o
C
Relative humidit
y
RH 68 %
Wind speed U 2 m s
-1
Soil Temperature at 0.5 m Tm 21
o
C
Solar radiatio
n
Rad 700 W m
-2
Canop
y
resistance coeff. C1, C2, C3 5, 0.005, 300
Maximum leaf area index LAImax 6m
2
m
-2
Soil water content
0.25 m
3
m
-3
Saturation soil water content
s 0.5 m
3
m
-3
Soil porosit
y
0.5 m
3
m
-3
Soil tortuosit
y
s1.5
Residue fractio
n
Fr 0.5
Thickness of the residue la
y
er Lr 0.02 m
Residue tortuosity
r 1
Residue porosity
r
1
Upper la
y
er thickness Lt 0.05 m
Lower la
y
er depth Lm 0.5 m
Soil rou
g
hness len
g
th Zo’ 0.01 m
Dra
g
coefficient Cd 0.07
Reference hei
g
ht Z 3 m
Attenuation coefficient
2.5
Maximum solar radiatio
n
Radmax 1000 W m
-2
Extinction coefficient Cext 0.6
Mean leaf width W 0.08 m
Water vapor diffusion coefficient Dv 2.56x10
-5
m
2
s
-1
Fittin
g
parameter
6.5
Soil thermal conductivit
y
, upper
layer K 2.8 W m
-1o
C
-1
Soil thermal conductivit
y
, lower
layer K’ 3.8 W m
-1o
C
-1
Table 2. Predefined conditions for the sensitivity analysis.
Evapotranspiration of Partially Vegetated Surfaces
297
Fig. 11. Sensitivity analysis of the SEB-PV model for Fv=1 (left) and Fv=0,5 (right) under
different soil temperatures Tm, and soil resistance conditions.
Evapotranspiration – Remote Sensing and Modeling
298
Fig. 12. Sensitivity analysis of the SEB-PV model for Fv=1 (left) and Fv=0,5 (right) under
different residue and canopy conditions.
Evapotranspiration of Partially Vegetated Surfaces
299
3. Conclusions
A surface energy balance model (SEB) based on the Shuttleworth-Wallace and Choudhury-
Monteith models was developed to account for the effect of residue, soil evaporation and
canopy transpiration on ET. The model describes the energy balance of vegetated and
residue-covered surfaces in terms of driving potential and resistances to flux.
Improvements in the SEB model were the incorporation of residue into the energy balance
and modification of aerodynamic resistances for heat and water transfer, canopy resistance
for water flux, residue resistance for heat and water flux, and soil resistance for water
transfer. The model requires hourly data for net radiation, solar radiation, air temperature,
relative humidity, and wind speed. Leaf area index and crop height plus soil texture,
temperature and water content as well as the type and amount of crop residue are also
required. An important feature of the model is the ability to estimate latent, sensible and soil
heat fluxes. The model provides a method for partitioning ET into soil/residue evaporation
and plant transpiration, and a tool to estimate the effect of residue ET on water balance
studies. Comparison between estimated ET and measurements from an irrigated maize field
provide support for the validity of the surface energy balance model. Further evaluation of
the model is underway for agricultural and natural ecosystems during growing seasons and
dormant periods. We are developing calibration procedures to refine parameters and
improve model results.
The SEB model was modified for modeling evapotranspiration of partially vegetated
surfaces given place to the SEB-PV model. The SEB-PV model can be used for partitioning
total ET on canopy transpiration and soil evaporation beneath the canopy and soil directly
exposed to net radiation. The model can be used for partitioning net radiation into not only
latent heat fluxes but also sensible heat fluxes from each surface. A preliminary sensitivity
analysis shows that similar to the SEB model, the proposed modification was sensitive to
soil surface resistance, residue resistance, canopy resistance and vapor pressure deficit.
Further model evaluation is needed to test this approach. A model to estimate Rn and a
model to estimate soil temperature T
m
from air temperature and soil conditions are also
required to reduce the required inputs of the model.
4. List of variables
Rn Net Radiation (W m
-2
).
Rn
c
Net Radiation absorbed by the canopy (W m
-2
).
Rn
s
Net Radiation absorbed by the soil (W m
-2
).
λE Total latent heat flux (W m
-2
).
λE
c
Latent heat flux from the canopy (W m
-2
).
λE
s
Latent heat flux from the soil (W m
-2
).
λE
r
Latent heat flux from the residue-covered soil (W m
-2
).
λE
bs
Latent heat from the soil directly exposed to net radiation (W m
-2
).
λE
br
Latent heat from the residue-covered soil directly exposed to net radiation (W m
-2
).
H Total Sensible heat flux (W m
-2
).
H
c
Sensible heat flux from the canopy (W m
-2
).
H
s
Sensible heat flux from the soil (W m
-2
).
H
r
Sensible heat flux from the residue-covered soil (W m
-2
).
G
os
Conduction flux from the soil surface (W m
-2
).
G
or
Conduction flux from the residue-covered soil surface (W m
-2
).
G
s
Soil heat flux for bare soil (W m
-2
).
Evapotranspiration – Remote Sensing and Modeling
300
G
r
Soil heat flux for residue-covered soil (W m
-2
).
f
r
Fraction of the soil covered by residue (0-1).
ρ Density of moist air (Kg m
-3
).
C
p
Specific heat of air (J Kg
-1
o
C
-1
).
γ Psychrometric constant (Kpa °C
-1
).
T
a
Air temperature (
o
C).
T
b
Air temperature at canopy height (
o
C).
T
1
Canopy temperature (
o
C).
T
2
Soil surface temperature (
o
C).
T
2r
Soil surface temperature below the residue (
o
C).
T
L
Soil temperature at the interface between the upper and lower layers for bare soil (
o
C).
T
Lr
Soil temperature at the interface between the upper and lower layers for residue-
covered soil (
o
C).
T
m
Soil temperature at the bottom of the lower layer (
o
C).
e
a
Vapor pressure of the air (mb).
e
b
Vapor pressure of the air at the canopy level (mb).
e
1
* Saturated vapor pressure at the canopy (mb).
e
L
* Saturated vapor pressure at the top of the wet layer (mb).
e
b
* Saturated vapor pressure at the canopy level (mb).
e
a
* Saturated vapor pressure of the air (mb).
e
Lr
* Saturated vapor pressure at the top of the wet layer for the residue-covered soil (mb).
r
am
Aerodynamic resistance for momentum transfer (s m
-1
).
r
ah
Aerodynamic resistance for heat transfer (s m
-1
).
r
aw
Aerodynamic resistance for water vapor (s m
-1
).
r
bh
Excess resistance term for heat transfer (s m
-1
).
r
bw
Excess resistance term for water vapor (s m
-1
).
r
1
Aerodynamic resistance between the canopy and the air at the canopy level (s m
-1
).
r
b
Boundary layer resistance (s m
-1
).
r
2
Aerodynamic resistance between the soil and the air at the canopy level (s m
-1
).
r
2b
Actual aerodynamic resistance between the soil surface and Zm (s m
-1
).
r
as
Aerodynamic resistance between the soil surface and Zm totally unaffected by
adjacent vegetation (s m
-1
).
r
c
Surface canopy resistance (s m
-1
).
r
r
Residue resistance for water vapor flux (s m
-1
).
r
s
Soil surface resistance for water vapor flux (s m
-1
).
r
rh
Residue resistance to transfer of heat (s m
-1
).
r
r
Residue resistance for heat flux (s m
-1
).
r
u
Soil heat flux resistance for the upper layer (s m
-1
).
r
L
Soil heat flux resistance for the lower layer (s m
-1
).
∆ Slope of the saturation vapor pressure (mb
o
C
-1
).
h Vegetation height (m).
LAI Leaf area index (m
2
m
-2
).
LAI
max
Maximum value of leaf area index (m
2
m
-2
).
d Zero plane displacement (m).
z
r
Reference height above the canopy (m).
Z
m
Reference height (m).
z
o
Surface roughness length (m).
z
o
’ Roughness length of the soil surface (m).
Evapotranspiration of Partially Vegetated Surfaces
301
k Von-Karman Constant.
k
h
Diffusion coefficient at the top of the canopy (m
2
s
-1
).
u* Friction velocity (m s
-1
).
α Attenuation coefficient for eddy diffusion coefficient within the canopy.
B
-1
Dimensionless bulk parameter.
VPD
a
Vapor pressure deficit (mb).
Rad Solar radiation (W m
-2
).
Rad
max
Maximum value of solar radiation (W m
-2
).
w Mean leaf width (m).
u
h
Wind speed at the top of the canopy (m s
-1
).
L
t
Thickness of the surface soil layer (m).
L
m
Thickness of the surface and bottom soil layers (m)
r
so
Soil surface resistance to the vapor flux for a dry layer (m s
-1
).
τ
s
Soil tortuosity.
D
v
Water vapor diffusion coefficient (m
2
s
-1
).
k
1
Thermal diffusivity (m
2
s
-1
).
ϕ Soil porosity.
β Fitting parameter.
θ Volumetric soil water content (m
3
m
-3
).
θ
s
Saturation water content of the soil (m
3
m
-3
).
L
r
Residue thickness (m).
τ
r
Residue tortuosity.
ϕ
r
Residue porosity.
u
2
Wind speed at two meters above the surface (m s
-1
).
K Thermal conductivity of the soil, upper layer (W m
-1
o
C
-1
).
K’ Thermal conductivity of the soil, lower layer (W m
-1
o
C
-1
).
K
r
Thermal conductivity of the residue layer (W m
-1
o
C
-1
).
C
ext
Extinction coefficient.
Fv Fraction of the soil covered by vegetation.
H
bs
Sensible heat from the soil (W m
-2
).
H
br
Latent heat from the residue-covered soil (W m
-2
).
5. Acknowledgments
We thank the University of Nebraska Program of Excellence, the University of Nebraska-
Lincoln Institute of Agriculture and Natural Resources, Fondo Nacional de Desarrollo
Cientifico y Tecnologico (FONDECYT 11100083) and Fondo de Fomento al Desarrollo
Cientifico y Tecnologico (FONDEF D09I1146) Their support is gratefully recognized.
6. References
Allen, S.J., (1990). Measurement and estimation of evaporation from soil under sparse barley
crops in northern Syria. Agric. For. Meteorology, 49: 291-309.
Allen R G, Pereira LS, Raes D and Smith M (1998) Crop Evapotranspiration: Guidelines for
computing crop requirement. (Irrigation and Drainage Paper No 56) FAO, Rome,
Italy.
Evapotranspiration – Remote Sensing and Modeling
302
Allen, R.G., Tasumi M., and Trezza, R., (2007). Satellite-based energy balance for mapping
evapotranspiration with internalized calibration (METRIC)-model. Journal of
Irrigation and Drainage Engineering, 133 (4): 380-394.
Alves I., and Pereira, L. S., (2000). Modeling surface resistance from climatic variables?
Agricultural Water Management, 42, 371-385.
Anadranistakis M, Liakatas A, Kerkides P, Rizos S, Gavanosis J, and Poulovassilis A (2000)
Crop water requirements model tested for crops grown in Greece. Agric Water
Manage 45:297-316.
ASCE (2002) The ASCE Standardized equation for calculating reference evapotranspiration, Task
Committee Report.Environment and Water Resources Institute of ASCE, New York.
Brenner AJ and Incoll LD (1996) The effect of clumping and stomatal response on
evaporation from sparsely vegetated shrublands. Agric For Meteorol 84:187-205.
Bristow KL, Campbell GS, Papendick RI and Elliot LF (1986) Simulation of heat and moisture
transfer through a surface residue-soil system. Agric For Meteorol 36:193-214.
Bristow KL and Horton R (1996) Modeling the impact of partial surface mulch on soil heat
and water flow. Theor Appl Clim 56(1-2):85-98.
Caprio J, Grunwald G and Snyder R (1985) Effect of standing stubble on soil water loss by
evaporation. Agric For Meteorol 34:129-144.
Choudhury BJ and Monteith JL (1988) A four layer model for the heat budget of
homogeneous land surfaces. Quarterly J Royal Meteorol Soc 114:373-398.
Coffey ME, Workman SR, Taraba JL and Fogle AW (2004) Statistical procedures for
evaluating daily and monthly hydrologic model predictions. Trans ASAE 47:59-68.
Enz J, Brun L and Larsen J (1988) Evaporation and energy balance for bare soil and stubble
covered soil. Agric For Meteorol 43:59-70.
Farahani HJ and Ahuja L R (1996) Evapotranspiration modeling of partial canopy/residue
covered fields. Trans ASAE 39:2051-2064.
Farahani HJ and Bausch W (1995) Performance of evapotranspiration models for maize -
bare soil to closed canopy. Trans ASAE 38:1049-1059.
Flores H (2007) Penman-Monteith formulation for direct estimation of maize
evapotranspiration in well watered conditions with full canopy. PhD Dissertation,
University of Nebraska-Lincoln, Lincoln, Nebraska.
Gregory JM (1982) Soil cover prediction with various amounts and types of crop residue.
Trans ASAE 25:1333-1337.
Horton R, Bristow KL, Kluitenberg GJ and Sauer TJ (1996) Crop residue effects on surface
radiation and energy balance-review.Theor Appl Clim 54:27-37.
INE, 2007. Instituto Nacional de Estadisticas.Censo agropecuario.
www.censoagropecuario.cl.
Irmak, S., Mutiibwa D., Irmak A., Arkebauer T., Weiss A., Martin D., and Eisenhauer D.,
(2008). On the scaling up leaf stomatal resistance to canopy resistance using
photosynthetic photon flux density. Agricultural and Forest Meteorology, 148 1034-
1044.
Iritz Z, Tourula T, Lindroth A and Heikinheimo M (2001) Simulation of willow short-
rotation forest evaporation using a modified Shuttleworth-Wallace approach.
Hydrolog Processes 15:97-113.
Jalota SK and Prihar SS (1998) Reducing soil water evaporation with tillage and straw
mulching. Iowa State University, Ames, Iowa.
Evapotranspiration of Partially Vegetated Surfaces
303
Jensen ME, Burman RD and Allen RG (1990) Evapotranspiration and irrigation water
requirements. ASCE Manuals and Reports on Engineering Practice No. 70 332 pp.
Jensen, J.M., Wright, J.L., and Pratt , B.J., 1971. Estimating soil moisture depletion from
climate, crop and soil data. Transactions of the ASAE, 14 (6): 954-959.
Katerji, N. and Rana, G. (2006). Modeling evapotranspiration of six irrigated crops under
Mediterranean climate conditions. Agricultural and Forest Meteorology, 138 142-155.
Kjelgaard JF and CO Stockle (2001) Evaluating surface resistance for estimating corn and potato
evapotranspiration with the Penman-Monteith model. Trans ASAE 44:797-805.
Krause P, Boyle DP and Base F (2005) Comparison of different efficiency criteria for
hydrological model assessment. Adv Geosciences 5:89-97.
Lafleur P and Rouse W (1990) Application of an energy combination model for evaporation
from sparse canopies. Agric For Meteorol 49:135-153.
Lagos LO (2008) A modified surface energy balance to model evapotranspiration and
surface canopy resistance. PhD Dissertation University of Nebraska-Lincoln
Lincoln, Nebraska.
Lagos L.O. Martin D.L., Verma S. Suyker A. and Irmak S. (2009). Surface Energy Balance
Model of Transpiration from Variable Canopy Cover and Evaporation from
Residue Covered or Bare Soil Systems. Irrigation Science. (28)1:51-64.
Legates DR and McCabe GJ (1999) Evaluating the use of goodness of fit measures in
hydrologic and hydroclimatic model validation. Water Res Res 35(1): 233-241.
Lindburg M (2002) A soil surface resistance equation for estimating soil water evaporation
with a crop coefficient based model. M.Sc. Thesis University of Nebraska-Lincoln
Lincoln, Nebraska.
Lund M.R. and Soegaard H. (2003). Modelling of evaporation in a sparse millet crop using a
two-source model including sensible heat advection within the canopy. Journal of
Hydrology, 280: 124-144.
Massman, W.J.(1992). A Surface energy balance method for partitioning evapotranspiration
data into plant and soil components for a surface with partial canopy cover. Water
Resources Research. 28:1723-1732.
Meyers TP and Hollinger SE (2004) An assessment of storage terms in the surface energy
balance of maize and soybean. Agric For Meteorol 125:105-115.
Monteith JL (1965) Evaporation and the environment. Proc Symposium Soc Expl Biol 19:205-234.
Monteith J.L., and Unsworth M.H. (2008). Principles of environmental physics.Academic
Press, Burlington, MA USA.
Moriasi DN, Arnold J G, Van Liew MW, Bingner RL, Harmel RD and Veith TL (2007) Model
evaluation guidelines for systematic quantification of accuracy in watershed
simulations. Trans ASAE 50:885-900.
Ortega-Farias S, Carrasco M and Olioso A (2007) Latent heat flux over Cabernet Sauvignon
vineyard using the Shuttleworth and Wallace model. Irrig Sci 25:161-170.
Ortega-Farias S, Olioso A and Antonioletti R (2004) Evaluation of the Penman-Monteith
model for estimating soybean evapotranspiration. Irrig Sci 23:1-9.
Parkes M., Jiang W., and Knowles R. (2005). Peak crop coefficient values for shaanxi north-
west China. Agricultural Water Management, 73 149-168.
Penman H L (1948) Natural evaporation from open water, bare soil and grass. Proc Royal
Soc London , Series A, 193:120-146.
Evapotranspiration – Remote Sensing and Modeling
304
Rana G, Katerji N, Mastrorilli M, El Moujabber M and Brisson N (1997) Validation of a
model of actual evapotranspiration for water stressed soybeans. Agric For
Meteorol 86:215-224.
Rana, G., Katerji, N., and De Lorenzi F. (2005). Measurement and modeling of
evapotranspiration of irrigated citrus orchard under Mediterranean conditions.
Agricultural and Forest Meteorology, 128 199-209.
Shaw RH and Pereira AR (1982) Aerodynamic roughness of a plant canopy: A numerical
experiment. Agric Meteorol 26(1):51-65.
Shuttleworth WJ (2006) Towards one-step estimation of crop water requirements. Trans
ASAE 49: 925-935.
Shuttleworth WJ and Gurney R (1990) The theoretical relationship between foliage
temperature and canopy resistance in sparse crops. Quarterly J Royal Meteorol Soc
116:497-519.
Shuttleworth WJ and Wallace JS (1985) Evaporation from sparse crops-an energy
combination theory. Quarterly J Royal Meteorol Soc 111:839-855.
Stannard DI (1993) Comparison of Penman-Monteith, Shuttleworth-Wallace, and modified
Priestley-Taylor evapotranspiration models for wildland vegetation in semiarid
rangeland. Water Res Res 29(5):1379-1392.
Steiner J (1989) Tillage and surface residue effects on evaporation from soils. Soil Sci Soc Am
J 53:911-916.
Steiner J (1994) Crop residue effects on water conservation. Managing agricultural residues,
Unger P ed, Lewis Publisher, Boca Raton, Florida, 41-76.
Steiner J, Schomberg H, Unger P and Cresap J (2000) Biomass and residue cover
relationships of fresh and decomposing small grain residue. Soil Sci Soc Am J
64:2109-2114.
Suyker A and Verma S ( 2009) Evapotranspiration of irrigated and rainfed maize-soybean
cropping systems. Agric For Meteorol 149:443-452.
Tanner B and Shen Y (1990) Water vapor transport through a flail-chopped corn residue.
Soil Sci Soc Am J 54(4):945-951.
Thom AS (1972) Momentum, mass and heat exchange of vegetation. Quarterly J Royal
Meteorol Soc 98:124-134.
Todd RW, Klocke NL, Hergert GW and Parkhurst AM (1991) Evaporation from soil influenced
by crop shading, crop residue, and wetting regime. Trans ASAE 34:461-466.
Tourula T and Heikinheimo M (1998) Modeling evapotranspiration from a barley field over
the growing season.Agric For Meteorol 91:237-250.
Verma S (1989) Aerodynamic resistances to transfer of heat, mass and momentum. Proc
(Estimation of Areal Evapotranspiration) Vancouver BC Canada IAHS Publ
#177:13-20.
Verma SB, Dobermann A, Cassman KG, Walters DT, Knops JM, Arkebauer TJ, Suyker AE,
Burba GG, Amos B, Yang H, Ginting D, Hubbard KG, Gitelson AA, and Walter-
Shea EA (2005) Annual carbon dioxide exchange in irrigated and rainfed maize-
based agroecosystems. Agric For Meteorol 131:77-96.
Wallace J.S., Jackson N.A. and C.K. Ong. (1999). Modelling soil evaporation in an
agroforestry system in Kenya. Agricultural and Forest Meteorology 94: 189-202.
Weseley ML and Hicks BB (1977) Some factors that affect the deposition rates of sulfur dioxide
and similar gases on vegetation. J Air Pollution Control Assoc 27(11):1110-1116.
Yu Q, Zhnag Y, Liu Y and Shi P (2004) Simulation of the stomatal conductance of winter wheat in
response to light, temperature and CO2 changes. Annals of Bot 93:435-441.
14
Evapotranspiration – A Driving Force in
Landscape Sustainability
Martina Eiseltová
1,2
, Jan Pokorný
3
, Petra Hesslerová
3,4
and Wilhelm Ripl
5
1
Crop Research Institute
2
Environment and Wetland Centre
3
Enki, o.p.s.
4
Faculty of Environmental Sciences,
Czech University of Life Sciences, Prague
5
Aquaterra System Institute
1,2,3,4
Czech Republic
5
Germany
1. Introduction
It is clear from the ever-growing evidence that human interference with vegetation cover
and water flows have considerably impacted water circulation in the landscape and resulted
in major changes in temperature distribution. Human changes in land use – extensive river
channelization, forest clearance and land drainage – have greatly altered patterns of
evapotranspiration over the landscape. To comprehend how the changes in
evapotranspiration impact landscape sustainability it is necessary to take a holistic view of
landscape functioning and gain understanding of the underlying natural processes.
The Earth’s surface has been shaped by water - in interaction with geological processes - for
billions of years. Water and the water cycle - along with living organisms - have been
instrumental in the development of the Earth’s atmosphere; free oxygen in the atmosphere
is the result of the activity of autotrophic, photosynthetic organisms (stromatolites) that
evolved in seawater some 3.5 billions years ago. This was the beginning of aerobic
metabolism and enabled the evolution of higher organisms, including higher plants.
The emergence of terrestrial plants some 400 million years ago has played a major role in
the amelioration of the climate. The process of evapotranspiration – evaporation from
surfaces and transpiration by plants - is instrumental in temperature and water
distribution in time and space. Whilst evaporation is a passive process driven solely by
solar energy input, transpiration involves an active movement of water through the body
of plants - transferring water from the soil to the atmosphere. The process of transpiration
is also driven by solar energy but plants have the ability to control the rate of
transpiration through their stomata and have developed many adaptations to conserve
water when water is scarce.
Water vapour is the main greenhouse gas playing a protective role against heat loss from
the Earth’s surface; on average the earth is about 33°C warmer than it otherwise would be
without water vapour and the other greenhouse gases in the atmosphere (water vapour’s
Evapotranspiration – Remote Sensing and Modeling
306
contribution being about 60 % on average, Schlesinger 1997). Water, thanks to its high heat-
carrying capacity, is able to redistribute much of the solar heat energy received by the Earth
through the water cycle: by evapotranspiration and condensation. Water evapotranspiration
and condensation therefore plays an instrumental role in climate control with regard to
temperature distribution in time and space, i.e. reducing the peaks and modulating the
amplitudes of high and low temperatures on the land surface - making conditions on Earth
suitable for life.
The natural vegetation cover that has developed over the Earth throughout millennia is best
suited to utilize and dissipate the incoming solar energy, and to use the available water and
matter in the most energy-efficient way. There is ample evidence for this. Since the time that
human civilization begun greatly interfering with the landscape’s natural vegetation cover -
clearing forests, ploughing savannas and draining wetlands for agricultural use and urban
settlements - many environmental problems have started to appear. More recently
environmentally sustainable management systems have been sought - with various degrees
of effort and understanding of the underlying problems.
In this chapter we will provide evidence of the role of water and vegetation in shaping the
climate. Using data and observations from a virgin forest in Austria we will present and
discuss the play rules of nature and offer a definition of landscape sustainability. We will
present a living example of reduced precipitation over an area of 4000 square kilometres
following the partial clearance of the Mau Forest in western Kenya and describe the
situation in the de-watered landscape of the open-cast mining area of North-West Bohemia,
Czech Republic. The connection between the disturbed water cycle and matter losses in the
predominantly-agricultural Stör River catchment in Germany will be demonstrated and the
role of evapotranspiration in maintaining landscape sustainability discussed.
2. The play rules of nature in search of sustainability
2.1 The energy-dissipative properties of water
Life on Earth depends on energy, water and a few basic elements (mainly C, H, O, N, P, S
and about 20 others) that constitute living tissue. The biogeochemical cycles - the continuous
cycles of matter and water - are essential for life to be sustained. The cycles are primarily
powered by the energy received from the Sun. Driven by the sun’s radiation water is cycled
continuously: playing an instrumental role in energy dissipation and the cycling of matter.
The dissipation of solar energy at the Earth’s surface – i.e. the distribution of energy in time
and space - creates suitable thermal conditions for natural processes and life on Earth.
To understand how the natural processes involved in energy dissipation are inter-related
Ripl (1992, 1995) proposed a conceptual model based on the energy dissipative properties of
water. In his Energy-Transport-Reaction Model (ETR Model), Ripl considered three essential
processes (Fig. 1) that control the dissipation of energy:
the process of water evaporation and condensation;
the process of dissolution and precipitation of salts; and
the process of disintegration and recombination of the water molecule within the
biological cell
With water’s high capacity for carrying energy in the form of latent heat, most energy is
dissipated by the physical processor property of evaporation and condensation, making
water a very efficient cooler or heater. When water changes from a liquid to its gaseous
phase - as in evapotranspiration - energy is stored in the water vapour in the form of latent
Evapotranspiration – A Driving Force in Landscape Sustainability
307
Fig. 1. Three processor properties of water
heat and the local area is cooled down. At night or early morning when water condenses on
cooler surfaces, energy in the form of latent heat is released and the local area is warmed up.
Without water, the energy of the incoming radiation is transformed into sensible heat and
the local area becomes overheated during the day and likewise far cooler at night (as is well
known from desert areas, with differences between day and night temperatures typically
exceeding 50°C). Water-saturated landscapes provide much more stable environments than
do dry terrestrial systems. In landscapes with water - abundant aquatic ecosystems,
wetlands and soils with high water retention capacity - about 80 % of incoming solar energy
is stored as latent heat of water vapour via evapotranspiration, whilst in de-watered
landscapes (with a low-water retention capacity) the vast majority of solar energy is
transformed into sensible heat (Pokorný et al. 2010b). In exceptional cases when, for
example, hot air of low relative humidity moves across a wetland surrounded by dry areas,
even more than equivalent of 100% of solar radiation can be stored safely in latent heat
(Monteith 1975, Ryszkowski & Kedziora 1987, Kučerová et al. 2001). Below in Sections 3 and
4 we will show the high temperature differences measured between de-watered areas and
sites with a good supply of water and high evapotranspiration.
Water has another important natural property - the ability to separate the charges in a given
amount of molecules into protons and electrons. This chemical processor property of water
is responsible for the dissolution of salts - using up the water’s heat energy in the formation
of ionic solutions – and then if concentrated by subsequent evaporation of the water crystals
Evapotranspiration – Remote Sensing and Modeling
308
can be precipitated from the solute, releasing the same amount of energy as was required by
the dissolution process. However, through dissolution and precipitation a much smaller
fraction of energy is dissipated compared to evaporation and condensation.
In pure distilled water at 20°C, 10
-7
moles of water are dissociated into protons (H
+
) and
electron-charged hydroxyl ions (OH
-
). These electric charges represent chemical potentials,
i.e. energy with the potential to be converted into chemical reactions. The number of
charged parts (ions) per volume of water constitutes the concept of reactivity (pH, law of
mass action). Importantly, reactivity is to a large part dependent on the temperature-,
concentration- and pH gradients existing at various interfaces. Such interfaces between
solid, liquid and gaseous phases are of special interest in all energy processes and provide
sites for steady rates of change. Being essential tools for life processes, nature produces
membranes and surfaces where life’s important reactions can most readily take place. Even
without there being differences in temperature at a liquid- (water-) solid interface, chemical
reactions can still readily take place due to the singularity of charge distributions and the
modulations of thermal motion (the thermal ‘jiggling’ of molecules / ions).
Kinetic energy (mv
2
/2) consists of the frequency and amplitude of accelerated masses. At
the interfaces between two phases (e.g. liquid-solid) a modulation of the mass movement of
ions (molecules) can occur, especially in amplitude; reactivity is thus enhanced and reaction
probabilities increased (in conditions of decreased pH and elevated proton density). As an
example of this, take the distribution of highly-diluted, colloidal organic matter in a glass
beaker of water. The organic colloids are coagulated at the glass wall, attracted and thus
concentrated by the lowered pH conditions at the liquid-solid interface; this enables
potential bacterial activity such as, for example, quicker growth of bacteria and
decomposition of organic matter. Such phenomena are ubiquitous in nature: always
occurring, for example, between the root membranes of plants and the interstitial water of
the soil. Evapotranspiration by the leaves of plants lowers the water content in the capillary
network of the soil interstitium, giving access to the oxygen of the air and thus exerting a
positive feedback on root activity. If the ‘water pump’ of a productive growing plant should
for some reason stop, then electron density (i.e. low redox conditions) will rise and
decomposition processes will be severely retarded. Thus the activity of evapotranspiration –
the switching on or off of the plant’s water pump – controls soil bacterial activity and
mineralization processes. In this way highly-efficient processes – control mechanisms
closely connecting functioning plant systems and soil - are able to maintain loss-free
conditions in the soil. Minerals and nutrients become ‘available’ only when the plant is
actively growing and thus are readily ‘used up’. The losses induced by the percolation of
‘free’ nutrients and minerals released by mineralization through to rivers via sub-surface
groundwater flow are thus minimized. Such a mechanism is steadily optimizing the
sustainable development of vegetation cover over the landscape by minimizing the
irreversible losses from land sites to the sea (Ripl 2010).
Water is also the most important agent in the biological processes of production
(photosynthesis) and decomposition (respiration) of organic matter. During photosynthesis
water is split into reactive 2H and O. Oxygen is released to the atmosphere and hydrogen is
used for the reduction of carbon dioxide to carbohydrates - organic compounds including
sugars, starch and cellulose. The solar energy bound in organic matter is released again
during mineralization (decomposition) when oxygen is used up to split sugars back into
Evapotranspiration – A Driving Force in Landscape Sustainability
309
CO
2
and H
2
O. As the production and breakdown of organic matter generally occur within
the same site, the biological process can be considered cyclic just like the physical dissipative
process. However, considerably less incoming solar energy (about 1 - 2%) is bound by
photosynthesis compared to that of water evaporation; the net efficiency of solar energy
conversion into plant biomass is usually between 0.5 and a few percent of the incident
radiation (for more details see, for example, Blankenship 2002).
The theories and ideas associated with dissipative structures, open dynamic systems
operating far from equilibrium, and self-organization (Prigogine & Glansdorff 1971;
Prigogine 1980; Prigogine & Stengers 1984) have given us a clearer understanding of how
living organisms utilize a throughput of external energy to create new order and
structures of increased complexity (Capra 1996). These theories cast light on how
ecosystems have organized themselves during evolution: maximizing their sustainability
through cycling water and matter and dissipating energy. The dissipation of energy takes
place at various scales - from the micro-scale within cells to ecosystems and landscapes
(Schneider & Sagan 2005). At the landscape level, evapotranspiration plays an essential
role in energy dissipation and as such is highly dependent on the vegetation cover and
water availability.
2.2 Plants and water availability
Water is supplied to the land and its vegetation through precipitation. The various sources
of water contributing to precipitation differ in different regions of the Earth. In maritime
regions, water derived from evaporation from the sea prevails whilst further inland
precipitation may be derived equally from long-distance atmospheric transport of water
from the sea and from evapotranspiration from within the basin itself (Schlesinger 1997).
Availability of water is one of the most important factors determining the growth of plants:
hence the distribution of plants on Earth coincides with the availability of water. Deserts are
typically short of water and thus the vegetation is rather scarce or non-existent.
Nevertheless, plants have developed a number of different strategies during evolution to
cope with both conditions of water abundance on the one hand and water scarcity on the
other. For the purpose of this chapter we will focus on mechanisms that plants use to control
the local water cycle and why it is important.
There are several mechanisms that plants use to control the loss of water from their tissues.
One of these is the operation of stomata, their intricate structure, position on plants, their
size and numbers. Stomata are found in the leaf and stem epidermis of plants; they facilitate
gas exchange and the passage of water from the leaf or stem tissues to the surrounding air
by controlling the rate of transpiration. Stomata consist of a pair of guard cells, the opening
between them providing the connection between the external air and the system of
intercellular spaces. Plants adapted to dry conditions mostly have small stomata immersed
within the epidermis. Numbers of stomata differ from about 50 to 1000 stomata per mm
2
.
Stomata respond to the amount of water in the leaf tissue and to air humidity: closing when
the water content in leaf tissue is low and when ambient air humidity declines. In such cases
only a small amount of water is transpired through the cuticle (a wax layer on the
epidermis). In plants with a thin cuticle – most wetland plants (hygrophytes) belong to this
category – the cuticle transpiration may amount to a considerable percentage of total
transpiration. However, cuticle transpiration usually amounts to only a few percent of the
Evapotranspiration – Remote Sensing and Modeling
310
water released by stomatal transpiration. The effectiveness of the cuticle in reducing loss of
water is well seen in fruits, such as apples and pears, or potato tubers: if unpeeled they can
stay many weeks without any great water loss (Harder et al. 1965).
Transpiration by plants can be seen as a water loss in such cases as water scarcity; managers
of water reservoirs that supply drinking water would usually see it as a loss. For a plant,
however, transpiration is a necessity by which a plant maintains its inner environment
within the limit of optimal temperatures. And at the level of landscape, evapotranspiration
is the most efficient air conditioning system developed by nature.
In addition to optimising temperature, through evapotranspiration plants control the optimum
water balance in their root zone. The activity of plant roots in respect to water uptake regulates
the redox conditions in the root zone, thus regulating the rate of organic matter decomposition
that makes nutrients available for plants growth. It is therefore most likely that, through
evapotranspiration, the vegetation cover controls the irreversible losses of matter: an efficient
system where only so much organic matter is decomposed such that those mineral nutrients
freed from organic bonds are rapidly taken up by plants for their nutrition.
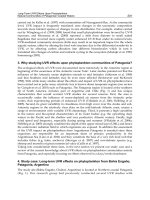
In dry environments, plants have developed ways to attract water condensation. As water
condensation takes place on surfaces, plants growing under the conditions of water-scarcity
typically have a high surface-volume ratio. Spines and hairs on plants have developed to
increase the plants’ surface-volume ratio - thus providing more surfaces for water
condensation (Fig. 2). Given the complex role of vegetation in maintaining a water balance,
smooth temperature gradients and a control of matter cycles in the landscape, any potential
economic profits expected from the destruction of natural vegetation cover need to be
carefully weighed against the loss of the functioning role of vegetation.
Fig. 2. Spines and hairs on cacti enhance water condensation in arid environments (Photo:
M. Marečková)
Evapotranspiration – A Driving Force in Landscape Sustainability
311
2.3 Water dynamics and matter losses
It is generally accepted that water is the most important transport and reaction medium –
many chemical reactions can only take place in the presence of water and matter is
transported mainly with water flow. Matter that is transported via rivers to the sea – both in
a dissolved or particulate form – has to be seen as an irreversible matter loss for continents
and their vegetation as it takes millions of years before the sea floor is lifted up to form a
new continent. Equally, matter that is leached through the soil to the permanent
groundwater is further unavailable for nutrition of the vegetation cover on land. Ripl (1992)
used data from palaeolimnological studies of lake sediments in southern Sweden (Digerfeldt
1972) to demonstrate the role of vegetation cover in matter and water flows. Vegetation
cover reconstruction and sediment dating has made it possible to document four distinctive
stages in landscape and vegetation development in postglacial North European catchments
and the relevant matter losses at each stage. During the first stage, the bare soils or soils with
scarce pioneer vegetation that occurred after the retrieval of glaciers were prone to elevated
soil erosion and high transport of dissolved matter. This was measured as a relatively
high rate of matter deposition in lake sediments; analysis showed that sediment
deposition rates were highly correlated with the deposition rates of base minerals,
nutrients and organic material. When climax vegetation became established within
catchments, rates of sediment deposition diminished some ten fold. With a fully
developed vegetation cover in catchments, low deposition rates of approximately 0.1 to
0.2 mm per year remained rather constant right through until the second half of the 19
th
century. Since then increasing rates of sewage discharge to lakes, clearance of forest and
intensification of agriculture have led to deposition rates increasing nearly a hundred fold
to present levels of 8 to 10 mm per year.
The reduction in matter losses from catchments covered by climax vegetation is ascribed to
the increased system efficiency of water and matter recycling. In catchments with a well-
developed vegetation cover, water and matter are bound to short-circuited cycles and losses
are minimal. In contrast, the increased clearance of forest, exposure of bare land, and
drainage of agricultural land have accelerated matter losses from catchments. The lowering
of the water table by humans has increased the rate of mineralization of organic matter and
also enhanced water percolation through soils that carries away the dissolved mineral ions
and nutrients. The increased inputs of nutrients to water bodies were documented by the
much higher deposition rates of sediments – the beginning of eutrophication (Digerfeldt
1972, Björk 1988, Björk et al. 1972, 2010).
Ripl et al. (1995) confirmed by a laboratory lysimeter experiment that the water dynamics in
a soil substrate has a major impact on the rate of organic matter decomposition; under the
conditions of intermittent wet and dry phases more organic matter was mineralized and
higher amounts of mineral ions leached through the soil than from the control soil substrate
with a continuous water flow. The significance of interchanging dry/wet phases and its
decisive role in matter losses can be documented also by many examples of drained lowland
fens in northern Europe, where increased matter losses have been observed following fen
drainage. The mineralization of organic matter accumulated throughout centuries has been
of such dimensions that soil subsidence, for example in the fenland of Cambridgeshire,
England, has amounted to more than 4.5 metres following the drainage that took place there
in the 1650s (Purseglove 1989). By contrast, permanently moist soils slowly accumulate
organic matter and matter losses are minimal.
Evapotranspiration – Remote Sensing and Modeling
312
2.4 Specific features of energy fluxes in wetland ecosystems – primary production
and decomposition of organic matter
Wetlands which are eutrophic, i.e., well supplied with plant mineral nutrients, are highly
productive because they do not suffer from water shortages. Individual types of wetlands
differ significantly - not only in their production of plant biomass but also in their capability
of long-term accumulation of dead organic matter (as detritus or peat). This capability
depends on the ratio between average rates of primary production and decomposition. For
example, bogs are distinguished by their low annual primary production of biomass
(usually only 100 to 250 g m
-2
of dry mass). Nonetheless, the strongly suppressed
decomposition of organic matter that is produced in bogs results in a net annual
accumulation of dead plant biomass that is eventually transformed into peat. As the peat
layer grows upwards, the bog vegetation loses contact with the groundwater rich in
minerals and its biomass production slows down. In contrast, though eutrophic fishponds
have a typical primary production one order of magnitude higher than in bogs, they often
hardly accumulate any dead biomass as the annual decomposition approaches or equals
annual net primary production. In fishponds, however, like in other wetlands, the
production to decomposition ratio depends on the supply of nutrients (especially P and N),
i.e., on the trophic status of the water (Pokorný et al. 2010b). Thus any lake or fishpond, if
oversupplied with nutrients, can accumulate a nutrient-rich organic sediment if the
decomposition rate cannot keep pace with the extremely high primary production.
Eventually, the fishpond becomes a source of nutrients; when oxygen gets depleted and
anaerobic conditions at the sediment-water interface occur, phosphorus is released from the
sediment enhancing the primary production even further.
2.5 Landscape sustainability
2.5.1 The dissipative-ecological-unit
The Earth’s atmosphere has been described by Lovelock (1990) as an open system, far from
equilibrium, characterized by a constant flow of energy and matter. Equally, living
organisms are open systems with respect to continual flows of energy and matter. However,
at a higher organisational level – such as an ecosystem – matter is continually recycled, i.e.,
what is a waste for one organism becomes a resource for another. Ripl & Hildmann (2000)
termed the smallest functional unit that is capable of forming internalized cycles of matter
and water while dissipating energy - the dissipative-ecological unit (DEU). The steadily
increasing resource stability of DEUs is achieved by their reduction of water percolation
through soils to the groundwater and instead their increase in local, short-circuited water
cycling within ecosystems by enhancing their evapotranspiration.
The concept of the dissipative-ecological-unit is used to demonstrate how nature, when not
disturbed by sudden changes in climatic conditions, tends to close cycles of matter, i.e. run
an efficient local resource economy and maintain relatively even temperatures and moisture
conditions.
2.5.2 Evapotranspiration and landscape sustainability
Results from a detailed study conducted in a predominantly agricultural catchment of the
River Stör in NW Germany demonstrated how the destruction of natural vegetation cover
over large areas has led to the opening up of cycles due to the disturbance of natural water
flow dynamics (Ripl et al. 1995, Ripl & Eiseltová 2010). Water and matter no longer cycle
within localized, short-circuited cycles; instead, reduced evapotranspiration has resulted in
Evapotranspiration – A Driving Force in Landscape Sustainability
313
increased water percolation through the soil accompanied by increased losses of matter. The
average losses of dissolved mineral ions measured within the Stör River catchment were
alarmingly high, about 1,050 kg of mineral salts per ha and year (excluding NaCl). A
detailed description of the measurements performed and methods used can be found in Ripl
and Hildmann (2000). Such land management systems are unsustainable in the long-term as
soil fertility will inevitably be gradually reduced.
A rather different situation can be observed in an undisturbed ecosystem, such as the rather
unique virgin forest of Rothwald in Austria. Here the feedback control mechanism of this
complex mature forest ecosystem is functioning according to the rules of nature. It is the
interlinked vegetation cover that is in control of the processes. In this dolomitic bedrock area
groundwater is very scarce - being present only in minor crevices. Oscillations of the water
table within the thick debris layer are mainly controlled by the plants through their
evapotranspiration. Despite the relatively high precipitation – over 1,000 mm a year – the
run off from the virgin forest remains very low and is restricted mainly to the period of
snow melt above frozen ground (February till May). The site does not suffer from shortage
of water as can be deduced from the highly damped temperature distribution; the
temperature amplitudes between day and night almost never exceed 8-9°C during
summer (Ripl et al. 2004). The organic matter decomposition is rather slow due to the
water-saturated conditions and the debris layer is rather high. The debris layer was 2-4
times higher in the Rothwald virgin forest that in the large areas of neighbouring
managed forest (Splechtna, pers. comm., 2000). Water analyses of melted snow samples
showed extremely low conductivity values (Table 1). This indicates that there is a much
quicker turnover of water evaporated from the virgin forest in relation to precipitation
brought from long distances away, as such precipitation water would have about 10 times
higher conductivity. It is estimated that very short water cycles with a frequency of one
day or less must be prevalent.
Conductivity
at 20° C
mS m
-1
Alkalinity
mmol l
-1
pH
Max 1.45 0.09 7.22
Min 0.26 0.00 4.73
Median 0.60 0.01 6.27
MW 0.72 0.03 6.49
no. of sites 17 16 16
Table 1. Conductivity, alkalinity and pH measured in melted snow from Rothwald virgin
forest.
Based on the findings described above we can define landscape sustainability as the
efficiency of the landscape to recycle water and matter, and to dissipate the incoming solar
energy. We have provided evidence that matter losses increase with increased water
percolation through soil – as a result of reduced evapotranspiration due to natural
vegetation clearance. In the following sections we provide data from a thermal camera and
satellite images. These data give supporting evidence that evapotranspiration plays a major
role in the dissipation of the incoming solar energy and dampening temperature
amplitudes.