Báo cáo hóa học: " Research Article Hardware/Software Codesign in a Compact Ion Mobility Spectrometer Sensor System for Subsurface Contaminant Detection" potx
Bạn đang xem bản rút gọn của tài liệu. Xem và tải ngay bản đầy đủ của tài liệu tại đây (967.77 KB, 8 trang )
Hindawi Publishing Corporation
EURASIP Journal on Embedded Systems
Volume 2008, Article ID 137295, 8 pages
doi:10.1155/2008/137295
Research Article
Hardware/Software Codesign in a Compact Ion
Mobility Spectrometer Sensor System for
Subsurface Contaminant Detection
Sin Ming Loo,
1
Jonathan P. Cole,
1
and Molly M. Gribb
2
1
Hartman Systems Integration Laboratory, Department of Electrical and Computer Engineering, Boise State University,
Boise, ID 83725, USA
2
Center for Environmental Sensing, Department of Civil Engineering, Boise State University, Boise, ID 83725, USA
Correspondence should be addressed to Sin Ming Loo,
Received 6 August 2007; Revised 3 December 2007; Accepted 7 January 2008
Recommended by Miriam Leeser
A field-programmable-gate-array-(FPGA-) based data acquisition and control system was designed in a hardware/software code-
sign environment using an embedded Xilinx Microblaze soft-core processor for use with a subsurface ion mobility spectrometer
(IMS) system, designed for detection of gaseous volatile organic compounds (VOCs). An FPGA is used to accelerate the digital sig-
nal processing algorithms and provide accurate timing and control. An embedded soft-core processor is used to ease development
by implementing nontime critical portions of the design in software. The design was successfully implemented using a low-cost,
off-the-shelf Xilinx Spartan-III FPGA and supporting digital and analog electronics.
Copyright © 2008 Sin Ming Loo et al. This is an open access article distributed under the Creative Commons Attribution License,
which permits unrestricted use, distribution, and reproduction in any medium, provided the original work is properly cited.
1. INTRODUCTION
Ion mobility spectrometry (IMS) is an analytical technique
for gas phase analysis of chemical compounds in laboratory
environments; more recently, this method has been used in
field applications to rapidly detect chemical warfare agents,
explosives, and narcotics [1, 2]. Ion mobility spectrometry is
used to separate and quantify ions based on the drift of ions
at ambient pressure under the influence of an electric field
against a counter-flowing neutral drift gas. Gas samples to be
analyzed are moved into a reaction region where the sample
molecules are ionized using one of several ionization meth-
ods (in our case a Ni
63
foil is used). The product ions pro-
duced are then introduced to the drift region of the IMS in
pulses by opening a gate for a specified time interval (called
the ion gate pulse width, or pulse width). Once in the drift
region, the ions are separated according to their mobilities,
which are dependent on the size-to-charge ratio of the ions.
When the ions reach the detector, a small current is gener-
ated that is amplified and sent to the data acquisition system.
This current is recorded as a function of drift time, which is
used to identify each analyte; the relative size of the current
peak is used to determine concentration.
The focus of this paper is on the use of a hard-
ware/software codesign technique and an FPGA for control
of a small IMS sensor system designed for real-time detection
of gaseous VOCs in the subsurface [3–5]. The areas of effort
include the use of an FPGA to implement IMS data acqui-
sition and processing, sensor and sampling module control,
digital filtering to remove noise from the IMS data, and dig-
ital signal processing for detecting current peaks for identi-
fication of VOCs. Section 2 provides an overview of the IMS
system, Section 3 describes the hardware/software codesign
implementation details, and in Section 4, results of system
validation tests are discussed. Finally, a summary is presented
in Section 5.
2. IMS SENSOR SYSTEM
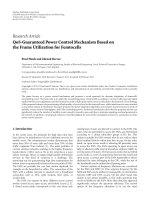
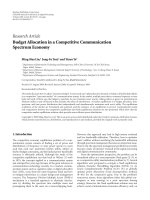
The sensor system is comprised of downhole subsystem and
uphole components (Figure 1).Theupholesubsystemin-
cludes a power supply, supply monitoring and communica-
tion, and the sensor drift and carrier gas supply. The down-
hole subsystem is housed in a 4.4-cm diameter, and 1.22-
m long cylindrical steel casing that can be lowered down an
open borehole (currently deployable to approximately 10 m)
2 EURASIP Journal on Embedded Systems
Subsurface
probe
housing
High voltage
supply
Gate
controller
Preamp
IMS
Sampling
module
Probe
tip
Power
management
ADC
H-bridge
IMS
driver
board
Up-hole
device
Comm.
transceiver
SRAM EEPROM
UART
SRAM
control
EEPROM
control
OPB
Data
FSM
FSL
Microblaze
processor
FSL
MAC
FIR
filter
FSL
Solenoid
control
FSM
FPGA
FPGA board
Figure 1: IMS hardware/software system block diagram.
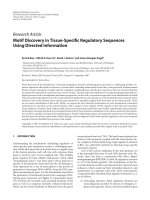
or inserted into the soil using telescopic drilling techniques
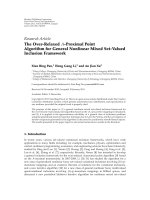
(Figure 2). The downhole subsystem includes the sampling
module (used to draw in gaseous samples from the soil for
introduction to the sensor), IMS sensor, preamplifier, high
voltage power supply, power manager, and an FPGA respon-
sible for communication, control, and data acquisition and
processing. During the prototyping stage, the FPGA is placed
uphole, but will ultimately reside with the downhole com-
ponents. A compact Spartan-III FPGA board has been de-
signed to be inserted into the IMS probe housing as shown
in Figure 2.
3. IMS HARDWARE/SOFTWARE CODESIGN
Previously, an embedded data acquisition (DA) system using
a Microchip PIC18F452 microcontroller (PIC) was used for
IMS system control [6, 7]. The PIC-based DA system pro-
vided a small, low-cost, and low-power solution capable of
meeting the needs of the system. The DA system took advan-
tage of the resources of the PICby using the on-chip analog-
to-digital conversion (ADC) to digitize the analog signal pro-
vided by the IMS and the on-chip memory to store the
data. However, the PIC-based DA system had many limita-
tions, including limited memory (1536 bytes), low-sampling
rate (10 kHz) and resolution (10-bit) ADC, only 24 digital
inputs/outputs (I/Os), and lack of digital signal processing
(DSP) power. These limitations led to very limited research
growth potential for the IMS system. When the DA require-
ments were re-evaluated, three of the most important crite-
ria identified were performance, accurate timing control, and
expandability.
To overcome some of the limitations of PIC microcon-
troller, a low-cost Xilinx Spartan-III FPGA was chosen to
be the main processing element of the IMS sensor system.
The FPGA provides a high degree of flexibility and scalabil-
ity, good high speed (DSP) performance, and a larger num-
ber of I/O pins (over 200 I/Os). Flexibility in the IMS system
was a high priority, since neither the IMS sensor nor the sys-
tem itself had been fully optimized. The high performance
FPGA DSP allows for upgrades and higher-order digital fil-
tering techniques that can help improve the signal-to-noise
ratio (SNR) and, therefore, the resolving power of the sensor.
3.1. IMS control stages
The process of controlling the IMS sensor system can be
divided into the following five control stages: initialization,
sampling, data acquisition, post processing,anddata transmis-
sion. In the initialization stage, the drift and carrier gas flow
rates are measured and if they are out of their desired oper-
ating ranges, they are adjusted accordingly. In addition, the
ion gate pulse width (PulseWidth) and data scan time (i.e.,
ScanTime, length of time over which ion currents are col-
lected at the detector) are set. The IMS system is then ready
to begin the sampling stage, during which a gaseous sample
is extracted from the soil with the sampling module and in-
troduced into the ionization region of the IMS sensor. In the
data acquisition stage, the ion gate is cycled open and closed
Sin Ming Loo et al. 3
RS232
Solenoid
drivers
FPGA
A/D
Gate
controller
High voltage
power supply
(HVPS) Preamplifier
IMS
sensor
Sampling
module
Probe
tip
IMS probe housing
Figure 2: IMS sensor with supporting electronics, metal probe housing, Spartan-III Starter Kit FPGA, and computer.
for 200 microsecond intervals (PulseWidth), and ions travel
through the drift tube until they strike the detector. The ion
currents are amplified, digitized, and stored in memory. This
data is collected repeatedly and averaged to eliminate noise.
If desired, current data is digitally filtered to further reduce
the amount of noise in the data and/or reduce the number of
data samples required to represent the signal. Once the data
are in memory, the postprocessing stage occurs when further
filtering may be applied and peak times and areas are calcu-
lated. Once this stage is complete, the data are transmitted to
the uphole subsystem.
3.2. Hardware and software control
The FPGA (along with the necessary external circuitry) must
initiate the various IMS control stage transitions, control the
ion gate controller and sampling module, collect, amplify,
digitize, and process the ion current measurements, perform
desired postprocessing of the data (including ion peak cal-
culations for identification and quantification of analytes),
and finally, communicate with the uphole subsystem. The
roles of the FPGA, the hardware modules that are imple-
mented by the FPGA, and most importantly the Xilinx Mi-
croblaze microprocessor, are shown in the IMS system dia-
gram (Figure 1). It is interesting to note that the system con-
trol naturally breaks down into hardware (those requiring
speed and accurate timing control) and software (postpro-
cessing for rapid algorithm changes/updates). Portions re-
quiring tight timing requirements were implemented with
VHDL and interfaced to the Microblaze through fast sim-
plex link (FSL). The overall operation of IMS hardware and
software control can be visualized with a task graph with six
tasks; see Figure 3 (init: initialization, samp: sampling, da:
data acquisition, post: postprocessing, and com: communi-
cation). The control is sequential in nature, thus hardware is
used where performance and accurate timing are required.
The init task is responsible for checking environmental
variables including drift gas flow rates, and receiving pa-
rameters from the uphole system. This task has been im-
plemented in C since parsing through a data packet can be
done much more easily and efficiently in software. The samp
task is implemented in VHDL since accurate timing can be
achieved in hardware (by counting clocks). The ionized sam-
ple molecules do not move into the drift region until the IMS
gate opens during the data acquisition stage (da task). The
third task, da, involves opening and closing the IMS gate at
discrete intervals (PulseWidth) and allowing groups of ions
to travel through the IMS where they eventually strike the
collector. This collection process is repeated, and the data is
averaged together to eliminate any anomalies. Much of the da
task is implemented in VHDL with moderately complex con-
trol in C. In the post task, the data can again be filtered dig-
itally (implemented in VHDL) to further remove any noise
from the data, and analysis methods can be applied to cal-
culate the peak locations and the area under the peaks, to
identify and quantify the compounds present. For example,
with peak detection algorithm, the ability to change num-
ber of scans that are averaged is extremely important during
the research phase of the sensor system development pro-
gram. Hardware implementations with state machines were
used because accurate timing control is critical for some tasks
and settings (e.g., InjectTime, ExtractTime, PulseWidth, and
ScanTime) of the sensor system. Finally, for the com task,
data are passed from the downhole device to the uphole
device. Details on the uphole device and the communica-
tion protocol have not yet been fully specified. However, it
is assumed that communication with the uphole device will
be achieved via a communication standard called recom-
mended standard 232 (RS232). This standard was chosen be-
cause of its wide use in industry and ease of implementation.
Figure 4 contains additional details related to Figure 3.
3.2.1. Control stages transitions
Transitions between control stages are achieved in the FPGA
as a combination of software implemented in C running on
an embedded Microblaze soft-core processor, and two sepa-
rate hardware finite state machines (FSMs) written in VHDL.
4 EURASIP Journal on Embedded Systems
Initialization Sampling Data Post-processing Communication
Figure 3: IMS control task graph.
The software control program remains in an idle state until
it receives a command from the uphole device. It will then
parse out the desired commands and data and begin the IMS
sensor data collection by sending commands to the appropri-
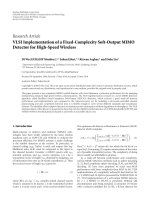
ate hardware. Figure 4 shows the flow diagram of the overall
control program. Due to the large amount of RAMrequired
to store and process the IMS data, the code is designed to
run in external 1 Mb static random access memory (SRAM),
as opposed to the internal block RAM(BRAM) of the FPGA.
The Microblaze controls the SRAMusing an external mem-
ory controller (EMC) IP core provided by Xilinx EDK, which
attaches to the Microblaze via the on-chip peripheral bus
(OPB).
A bootloader is used to run the software control in
SRAM. The software control program data is placed in
the Xilinx platform flash programmable read only memory
(PROM) along with the bit stream that is used to configure
the FPGA. The bootloader program runs in BRAM, and dur-
ing power-up of the system it copies program data from the
PROM and places it in SRAM. The bootloader then jumps to
the start of the SRAM and executes the program. The boot-
loader program and the methods used for extracting the data
from the PROM are based on a sample design provided by
Xilinx [8]. The PROM interface design is shown in Figure 5.
The logic in Figure 5 includes clock to the PROM, enable,
and initialize signal to indicate start of read. Since XCF02S is
a serial PROM, DIN is only one-bit width.
The first hardware FSM (referred to hereafter as the DA
FSM) generates the ion gate pulse width (PulseWidth), col-
lects the ion current data from the IMS sensor, and sends it
totheMicroblazewhereitisstoredinSRAM.TheDAFSM-
provides the software control program (running in Microb-
laze) with new ion current data points as they become avail-
able. The DA FSM communicates with Microblaze via two
FSL busses, one for sending and the other for receiving data.
These high-speed, unidirectional links allow the DA FSM to
pass data fast enough for the Microblaze to receive and pro-
cess it before receiving the next data packet. The FSL also al-
lows the Microblaze to send the FSM a single 32-bit parame-
ter representing the settings for the current IMS test param-
eters (ScanTime, PulseWidth, etc.), which is decoded by the
DA FSM. A state machine diagram of the DA FSM is shown
in Figure 6. The state machine uses ClkCnt
= 9 to transi-
tion to the send pulse state to ensure that the state machine
is synchronized properly. The ClkCnt counter is used to gen-
erate the ADC clk (which is always running), and checking
for ClkCnt
= 9 synchronizes the start of the gate pulse with
the rising edge of the clock. This also helps ensure that gate
pulse width is always the same width by making the gate
pulse starts and stops on the same number of counts every
time.
The sampling module FSM controls the timing of the ac-
tuation of solenoid valves in the sampling module that ex-
tract samples from the soil and then inject them into the
IMS ionization region. This FSM also communicates with
the Microblaze via two FSL busses. The software control pro-
gram sends data to the sampling module control FSM as a
single 32-bit word representing the extraction and injection
sequence for the valves. The FSM stays in IDLE state until a
start signal is received. At this time FSM proceeds to extract
state and the sample is extracted from the soil. Once enough
sample has been extracted, FSM moves to inject state where
the sample is introduced to the IMS sensor. A single bit is
sent to the Microblaze via FSL when the sampling module
FSM has completed its task. A high-level state machine dia-
gram of this FSM is shown in Figure 7.
3.2.2. IMS gate controller
The IMS gate controller is a digital device that controls the
flow of ions from the ionization region into the drift region
of the IMS sensor. The FPGA interfaces with the gate con-
troller via a single digital signal. When the signal is a digital
“low” the IMS gate is closed, and when the signal is a digital
“high” the IMS gate is open. A single, brief opening and clos-
ing of IMS gate is generated in the FPGA by counting clock
cycles using a countup counter, implemented as hardware in
the FPGA. A countup counter is designed to increment on
every rising edge of a clock. The counter value needed to gen-
erate a desired pulse width is equal to the desired ion gate
pulse width multiplied by the system clock frequency. The
accuracy of the timing is limited only by the frequency of the
system clock and the jitter of the signal. Our system clock
runs at 75 MHz using a digital clock manager (DCM) mod-
ule, which makes it possible to generate pulses (PulseWidth)
with an accuracy of 13.33 nanoseconds, or the duration of
a single clock cycle. If greater accuracy is required, the sys-
tem clock frequency can be raised using a DCM. The ion gate
pulse width is part of the hardware DA FSM and is designed
to provide the user with the option of selecting the desired
ion gate pulse width. This flexibility was especially valuable
during the prototype development stage of the IMS system
when the ideal pulse width had not yet been determined.
3.2.3. Sampling module
The sampling module extracts a volume of gas samples from
the soil to be introduced to the IMS sensor for analysis using
Sin Ming Loo et al. 5
Idle-wake
-up?
No
Ye s
Set parameters
numAvgs, ScanTime, InjectTime, ExtractTime,
continuousSampling, PulseWidth, filter, reportPeaks
Start solenoid control FSM
InjectTime, ExtractTime, continuousSampling
Sample ready?
No
Ye s
Start Data FSM
PulseWidth, ScanTime
Read IMS data
Filter?
Store averaged IMS data
Number averages met?
Continuous
Sampling
Ye s
Ye s
Ye s
Ye s
No
No
No
Detect peaks
Transmit results
Send to MAC FIR decimation filter
No
Number averages met?
Stop solenoid control FSM
Initialization
task
Sampling
task
Data
task
Post-
processing
task
Communication
task
Implemented in hardware
Figure 4: Overall control program.
latching solenoid valves [9]; it can be run in “single injec-
tion mode” in which a single sample is extracted, injected,
andanalyzedorincontinuousmodeinwhichacontinuous
stream of sample is injected into the IMS for analysis. These
valves are controlled by swapping the high and low termi-
nals and sending 20-millisecond, 5-V pulses to change the
open/close state. As these valves could not be driven directly
from the FPGA, which is only capable of driving 24 mA of
current at a maximum of 3.75 V, a half-H bridge (Texas In-
struments SN754410NE) is used to drive the valves. The con-
trol signals for the valves are generated by the sampling mod-
ule FSMas described above. The timing of state transitions
is achieved by counting clock cycles with a countup counter
in the same manner as for the gate controller. The sampling
module control code was written in VHDL and is designed to
allow for flexibility in the duration of the extraction and in-
jection states, so that the system can be optimized for differ-
ing environmental conditions. A single 32-bit control word
contains extraction time (ExtractTime), injection time (In-
jectTime), and continuous or single injection mode.
6 EURASIP Journal on Embedded Systems
Platform flash
XCF02S
DO
CE
INIT
CCLK
FPGA
M11
N9
A14
DIN
CE
INIT
CCLK
1
1
1
1
2
IMM
3
3
DIN
BUS
PROM
out
DIN
CE
INIT
CCLK
BUS
PAD
PROMREAD
In
bus Out bus
Util
bus split
Out1
Out2
Sig
Util
bus split
Out1
Out2
Sig
GPIO2
in
GPIO
d out
sys
clk s
Microblaze
Figure 5: Logic for bootloader.
Start =“1”
Start
=“0”
Idle
Load
PARAMS
ClkCnt < 9
Wai t
ClkCnt
= 9
Send
pulse
PulseCnt = PulseWidth
ADC
CS
low
ClkCnt < 9 PulseCnt < PulseWidth TimeCnt < LowTime
ClkCnt
= 9
ScanCnt
= ScanTime
TimeCnt
= NumBits+2
ContMode
=“1”
ScanCnt < ScanTime
TimeCnt
= NumBits+2
ContMode
=“X”
TimeCnt
= LowTime
ADC
sample
ScanCnt
= ScanTime
TimeCnt
= NumBits+2
ContMode
=“0”
ScanCnt < ScanTime
TimeCnt < NumBits+2
ContMode
=“X”
Figure 6: DA FSM state machine diagram.
3.2.4. Data acquisition and processing
The data acquisition process involves the following stages:
amplification, digitization, and processing of the ion current.
These stages are described below.
Preamplification
An inverting opamp configuration with a 10
9
gain factor was
used to amplify the subnano Amp ion current signal from
the IMS and convert it to a voltage before ADC.
Analog-to-digital conversion
For ease of implementation, an off-the-shelf successive-
approximation register (SAR) ADCwas used for ADC
(ADS7818, TI). All noise filtering is applied during postpro-
cessing to ensure that as much of the IMS signal remains in-
tact as possible. The ADS7818 interfaces with the FPGA via a
3-wire serial peripheral interface (SPI) protocol. The data are
collected from the ADS7818 in a 12 bit shift-register. The DA
FSMcollects data from the ADS7818 and sends them to the
Microblaze via FSL for processing and storage in SRAM every
2.1 microseconds (ScanTime). It is noted that ADS7818 has
Sin Ming Loo et al. 7
ClkCnt = InjectTime
repeat
= “0”
Start
= “0” ClkCnt < ExtractTime
ClkCnt < InjectTime
repeat = “X”
Idle
Start
= “1”
Extract
ClkCnt = ExtractTime
Inject
ClkCnt
= InjectTime
repeat
= “1”
Figure 7: Sampling module FSM state machine diagram.
top sampling rate of 500 K samples/second. Although this is
likely not needed for the system, it can be used to enhance
noise filtering by pushing the noise frequency further out in
the frequency spectrum, thus making the noise easier to fil-
ter.
Real-time processing
To improve analyte identification ability, it is important to
remove as much of the noise in the ion current readings as
possible without removing valid content. Therefore, multi-
ple scans of the IMS spectra are averaged to filter out system
noise. After data collected by the hardware FSM are sent to
Microblaze,averagesareperformedinrealtimeandstored
in external SRAM. The number of scans to be averaged is a
variable selected by the user via the uphole device.
The second area of real-time processing performed in
the FPGA and Microblaze is decimation filtering. The dec-
imator is designed using finite impulse response (FIR) fil-
tering techniques. The filter coefficients used in this design
were calculated using Matlab (MathWorks, Natick , MA) fil-
ter design tools [10]. The user selects the windowing method
used to calculate the coefficients, the number of taps, the cut-
off frequency and filter gain, and whether symmetric coeffi-
cients are desired. The Hamming window was used, and a
65-order (65 taps) filter was selected with a gain of 1 and
a cut-off equal to 10 kHz. Since IMS signal has bandwidth
of less than 10 kHz, a decimation factor of 10 was chosen
to bring the sampling rate down to
∼50 kHz, as this is an
appropriate sampling rate for the IMS. The design tool was
configured to generate the coefficients as unsigned 16-bit val-
ues to facilitate the integration of the coefficients into FPGA
filter implementation. In this implementation, oversampling
(500 K samples/second and decimated to 50 kHz) is used as
an attempt to reduce noise due to the antenna created by the
wiring in the probe and support cables to the uphole system
components.
The decimator is implemented in this design using the
Xilinx Logicore multiply accumulate finite impulse response
v5.1 (MACFIR) core attached to Microblaze via a send FSL
and a receive FSL [11]. The MACFIR is a highly configurable
and highly efficient core that is included with the Xilinx ISE
tools.
Postprocessing
Postprocessing of IMS data may be performed in the FPGA
prior to sending the data uphole, or after the data have been
collected by the uphole device. Once the noise has been re-
moved from the signal, the data can be processed to iden-
tify the analytes present in the sample. An important step in
this identification process is peak detection. The peak detec-
tion algorithm is implemented as a software routine written
in C running on Microblaze. The detection algorithm allows
the number of nearest neighbors to be passed in as an in-
put parameter to allow the routine to be altered according
to the types of compounds being detected, the widths of the
peaks being detected, and so that the number of unwanted
peak detections that occur due to noise can be reduced. In
addition, a noise floor threshold parameter is used that lim-
its peaks detected to those occurring above that threshold.
This is necessary even after applying noise filtration tech-
niques because a certain amount of noise will nearly always
be allowed to pass through the noise filter. The algorithm for
the autodetermination of the noise floor threshold uses the
initial
∼1 millisecond of data to determine the threshold by
storing the largest value during this interval as the thresh-
old. This method assumes that no peaks occur during this
interval, and the detected current is only due to DC offset
and noise. If this is not the case, then the threshold would
need to be provided directly or the algorithm can be altered
as needed.
Once the IMS sensor system is fully characterized and
calibrated, a table of mobility values will be stored in the sys-
tem. The peak locations (along with pressure and temper-
ature measurements) will allow analytes to be identified by
calculating the reduced ion mobility values associated with
the peaks and comparing them to the values stored in the ta-
ble. The results will then be sent to the uphole device.
8 EURASIP Journal on Embedded Systems
−0.1
0.1
0.3
0.5
0.7
0.9
1.1
1.3
Ion current (nA)
0.004 0.006 0.008 0.01 0.012 0.014 0.016
Time (s)
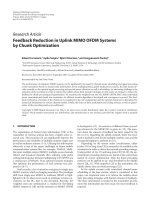
PCE related peaks
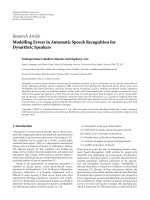
Figure 8: 15 PCE waveform collected using FPGA and ADC (512
averages).
4. SYSTEM VERIFICATION
A step-by-step approach to system verification was taken.
Each component of the design was verified on an individ-
ual basis, then additional components were successively com-
bined until the entire design was verified. Figure 8 shows per-
chloroethylene (PCE) data captured by the IMS system un-
der laboratory conditions. The sampling module was set to
continuously extract and inject the PCE sample gas with ex-
traction and injection times both equal to 0.5 second. An
ion gate pulse width of 200 microseconds and scan time of
19.6 milliseconds was used. As the PCE sample was injected
into the IMS, three distinct peaks characteristic of PCE be-
came apparent. The data was collected using the design as
described in Section 3 with 512 averages. This test showed
that the FPGA is capable of successfully gathering data from
the IMS while operating the sampling module. Further com-
plete sensor system characterization is currently underway.
5. SUMMARY
An FPGA data acquisition and control system for a com-
pact IMS sensor system that was designed for subsurface
use was successfully designed, implemented, and tested. The
functionality of the design was verified in a laboratory en-
vironment with PCE and in the field (not shown). The de-
sign provides accurate control and timing to the IMS gate
controller and sampling module while simultaneously col-
lecting IMS data with an external ADC. The system, even
though it is very sequential in nature, was designed in a true
hardware/software codesign environment with the use of Xil-
inx Microblaze soft processor core; it takes advantage of the
hardware resources of the FPGA to employ real-time digi-
tal signal processing to reduce noise in the data which eases
further processing of the data. The design makes use of an
embedded soft-core processor to provide a high-level soft-
ware interaction to the system and implement a peak detec-
tion algorithm. Since the FPGA can be reconfigured easily,
the design is flexible enough to allow for future changes and
improvements.
At this writing, this is the first use of FPGA in an IMS sys-
tem which has yielded a system that is easily expandable and
reconfigurable. These attributes are highly desirable, so that
as the needs of the IMS research program change, the hard-
ware can keep up with it. Throughout this research, design,
and implementation process, we ran into many software (de-
velopment tool) bugs, which were resolved in the latest soft-
ware releases. However, upgrading the software would cause
problems in other portions of our design. We found the flex-
ibility gained through the use of the FPGA and Microblaze
a mixed blessing. The system is very configurable, but due
to software problems, it was often difficult to determine if
a problem was due to hardware or software elements of the
system.
ACKNOWLEDGMENT
Funding of this project by EPA Award nos. X97031101-0 and
X97031102-0 is gratefully acknowledged.
REFERENCES
[1] F. W. Karasek, “Plasma chromatography,” Analytical Chem-
istry, vol. 46, no. 8, pp. 710A–720A, 1974.
[2] G. A. Eiceman and Z. Karpas, Ion mobilit y spectromet ry,CRC
Press, Boca Raton, Fla, USA, 1994.
[3]A.B.Kanu,H.H.Hill,M.M.Gribb,andR.N.Walters,“A
small ion mobility spectrometer sensor for detecting environ-
mental soil-gas contaminants,” Journal of Environmental Mon-
itoring, vol. 9, no. 1, pp. 51–60, 2007.
[4] D. Sevier, M. M. Gribb, R. N. Walters, et al., “An in-situ ion
mobility spectrometer sensor system for detecting gaseous
VOCs in the Vadose zone,” in Proceedings of the 4th Interna-
tional Conference on Unsaturated Soils, G. A. Miller, C. E. Za-
pata, S. L. Houston, and D. G. Fredlund, Eds., vol. 147, pp.
225–234, ASCE Publications, Carefree, Ariz, USA, April 2006.
[5]J.Cole,“Ontheuseofafieldprogrammablegatearrayina
compact ion mobility spectrometer sensor system for subsur-
face volatile organic compound detection,” M.S. thesis, De-
partment of Electrical and Computer Engineering, Boise State
University, Boise, Idaho, USA, 2007.
[6] W. A. Prouty, “Embedded system design for multi-purpose
sensors to detect and analyze environmental contaminants,”
M.S. thesis, Department of Electrical and Computer Engineer-
ing, Boise State University, Boise, Idaho, USA, 2003.
[7] “Microchip PIC18F452 System Specification,” Microchip
Technology, October 2006, .
[8] Xilinx PROM Application Note (XAPP 483), August 2006,
/>[9] K. P. Ryan, “A gas sampling module for a subsurface ion mobil-
ity spectrometer,” M.S. thesis, Department of Civil Engineer-
ing, Boise State University, Boise, Idaho, USA, 2006.
[10] MathWorks, Matlab Filter Design Toolbox, October 2006,
.
[11] Xilinx MAC FIR Filter (V5.1), March 2007, http://www
.xilinx.com/ipcenter/catalog/logicore/docs/mac
fir.pdf.