Báo cáo hóa học: " Research Article Compressing Proteomes: The Relevance of Medium Range Correlations" ppt
Bạn đang xem bản rút gọn của tài liệu. Xem và tải ngay bản đầy đủ của tài liệu tại đây (631.73 KB, 8 trang )
Hindawi Publishing Corporation
EURASIP Journal on Bioinformatics and Systems Biology
Volume 2007, Article ID 60723, 8 pages
doi:10.1155/2007/60723
Research Article
Compressing Proteomes: The Relevance of
Medium Range Correlations
Dario Benedetto,
1
Emanuele Caglioti,
1
and Claudia Chica
2
1
Dipartimento di Matematica, Universit
`
a di Roma “La Sapienza”, Piazzale Aldo Moro 5, 00185 Roma, Italy
2
Structural and Computational Biology Unit, EMBL Heidelberg, Meyerhofstraße 1, 69117 Heidelberg, Germany
Received 14 January 2007; Revised 28 May 2007; Accepted 10 September 2007
Recommended by Teemu Roos
We study the nonrandomness of proteome sequences by analysing the correlations that arise between amino acids at a short and
medium range, more specifically, between amino acids located 10 or 100 residues apart; respectively. We show that statistical mod-
els that consider these two types of correlation are more likely to seize the information contained in protein sequences and thus
achieve good compression rates. Finally, we propose that the cause for this redundancy is related to the evolutionary origin of
proteomes and protein sequences.
Copyright © 2007 Dario Benedetto et al. This is an open access article distributed under the Creative Commons Attribution
License, which permits unrestricted use, distribution, and reproduction in any medium, provided the original work is properly
cited.
1. INTRODUCTION
Protein sequences have been considered for a long time as
nearly random or highly complex sequences, from the infor-
mational content point of view. The main reason for this is
the local complexity of amino acid composition, that is, the
type and number of amino acids found in a sequence seg-
ment, especially inside the globular domains [1]. This com-
plexity could be related to the so called randomness of cod-
ing sequences in DNA, already pointed out in a pioneering
work [2] and explained by evolutionary models [3]. Studies
on protein sequence compression show that proteins behave
as sequences of independent characters and have a very low
compressibility, around 1% [4]. The ordered set of protein
sequences belonging to one organism, the proteome, was also
considered to be not compressible due to this little Markov
dependency [5]. Improvements are obtained by [6, 7]. How-
ever, later studies [8–10] suggest that proteomes contain dif-
ferent sources of regularities, and can be compressed to rates
around 30%. For a relevant discussion on the validity of these
results see Cao et al. [7].
In this work, we focus on the statistical study of proteome
sequences, using the concept of entropy brought into infor-
mation theory by Shannon [11]. The Shannon entropy is re-
lated to the amount of information of a sequence emitted by
a certain source. The entropy h of a sequence is the limit of
the average amount of information per character, when the
length of the sequence tends to infinity. In particular, for a
finite sequence of length L, the informational content in bits
is approximately Lh and so Lh is the minimum length in bit
of any sequence that contains the same information. In this
way Lh provides a theoretical lower bound for the sequence’s
compression. A compression algorithm is intended to code a
sequence into a shorter one, from which it is possible to ob-
tain unequivocally the former. In practise, one cannot com-
press at a rate equal to the Shannon entropy for the given
sequence. Nonetheless, it is possible to approximate such a
limit, using an efficient compression algorithm.
Statistical compression algorithms achieve their goal by
assigning shorter code words to the most probable charac-
ters; their efficiency depends on the accuracy of the model
used to estimate each character’s probability. Models try to
take advantage of the correlations between characters con-
sidering, for example, how the preceding characters, that is,
the character’s context, determine the probability of the next
one, as in the prediction by partial matching (PPM) scheme
[12].
Most successful algorithms for proteome compression
are based on the identification of duplicated sequences or
repeats. The compress protein (CP) algorithm [5], for ex-
ample, considers that duplicated sequences in proteomes are
similar but not identical because of mutation and evolu-
tionary divergence. CP uses a modified PPM that includes
the probability of amino acid substitutions when estimating
each residue probability. The ProtComp algorithm [8]opti-
mises the use of approximate repeats by updating the amino
2 EURASIP Journal on Bioinformatics and Systems Biology
Table 1: Proteome sequences.
Abbreviation Organism Proteome length Number of proteins
Mj Methanococcus jannaschii 448 779 1680
Hi Heamophilus influenzae 509 519 1657
Vc Vibrio cholerae 870 500 2988
Ec Escherichia c oli 157 8496 5339
Sc Saccharomyces cerev isiae 2 900 352 5835
Dm Drosophyla melanogaster 5 818 330 11 592
Ce Caenorhabditis elegans 6 874 562 17 456
Hs Homo sapiens 3 295 751 5733
acid substitution matrix as the repeated similar blocks appear
along the sequence. The context-tree weighting (CTW) [13]
is another context-based method that has been applied for
biological sequence compression. In [6] the authors present a
CTW-based algorithm that predicts the probability of a char-
acter by weighting the importance of short and long contexts
considering as well the occurrence of approximate repeats or
palindromes in those contexts. The XM [7] is a statistical al-
gorithm which combines, via a Bayesian average, the prob-
ability of an amino acid calculated on a local scale with the
probability of that same residue being part of a duplicated
region of the proteome.
Nonstatistical approaches, based on the Burros-Wheeler
transform (BWT) [9], have also been used for identifying
overlapping and distant repeats in proteomes, and efficiently
use them in compression. Even simpler models, that rely on a
block code representation of the protein sequences [10], have
proved to be successful in some cases.
All the algorithms commented above put into evidence
the existence and importance of redundancy in proteome se-
quences. Here we present a purely statistical study of 8 eu-
karyotic and prokaryotic proteomes. Firstly, we analyse the
correlation function of the whole sequences and find evi-
dence of medium range correlations, between amino acids
located 100 residues apart. Then we calculate the amino acid
correlations considering the protein boundaries and iden-
tify the role of the intra/interprotein scale in determining
the medium range correlations. Furthermore, we generate
groups of amino acids using their pair correlations at dis-
tance 100, that reveal the structural meaning of the medium
range correlations. Using the results of proteome correla-
tions, we propose a statistical model for the distribution of
amino acids in 4 proteomes: Haemophilus influenzae (bac-
teria), Methanococcus jannaschii (bacteria), Saccharomyces
cerevisiae (eukarya) and Homo sapiens (eukarya), and we es-
timate their compression rate to compare our results against
previous works.
The sources of nonrandomness studied fall into two
scales: the medium range correlations between amino acids
of the same and neighboring sequences, at distances of order
100, and the short range Markovian correlations between the
contiguous residues up to distance 10. Previous studies [9]
show that proteomes present repeated subsequences at very
long distances (50–300). In this article, we do not consider
these long-range correlations of the order of the proteome
length. Protein length range correlations are in agreement
with the process of sequence duplication, as it has been pre-
viously suggested for long-range correlations [9]; in addition
to that, we show that they also contain information about
the three-dimensional structure of the proteins. Short range
correlations might instead relate to the local constraints on
amino acid distribution due to secondary structure require-
ments.
2. RESULTS AND DISCUSSION
For our statistical analysis, we used the proteomes of 4
prokaryotic and 4 eukaryotic organisms shown in Tabl e 1 .
They were retrieved from the database of the Integr8 web
portal [14], with exception of the Hi, Mj, Sc, and Hs pro-
teomes that were obtained from the protein corpus in [15],
for the sake of comparison of our compression rate results
with previous studies on the same proteomes. The proteomes
are not complete (in particular the version of Hs in the pro-
tein corpus) but they represent a natural set of proteins where
the redundancy has a biological meaning. It is important to
remark that the sequence of the proteins in the proteome files
of the Integr8 database is not the natural one. Those files are
not useful for our analysis. Nevertheless, using the additional
information available in the database, it is possible to order
the proteins as they are found in the chromososmes. The pro-
teome files of the protein corpus do not present this problem,
but the sequence of the proteins is not available. Therefore,
for the analysis shown in Tabl e 2 and in Figure 2,wehave
used the version of Hi, Mj, Sc in the Integr8 database. For the
same reason, the data for Hs is missing in Tab le 2 since the
protein order is not obtainable at the Integr8 site.
2.1. Correlations
As a first approximation to the general trends in residue dis-
tribution, we study the cooccurrence of amino acids. More
precisely, we calculate the pair correlations at different dis-
tances, that is, the average number of times equal residues a
appear at distance k along the whole sequence
C
k
=
1
20
a
C
k
aa
(1)
Dario Benedetto et al. 3
−5e −05
5e
−05
0
0.0001
0.00015
0.0002
0.00025
0.0003
0.00035
0.0004
Correlation C(k)
1000900800700600500400300200100
Distance k
Dm
Ce
Sc
Mj
Vc
Hi
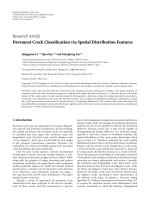
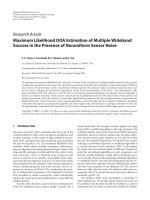
Figure 1: Correlation function for the 8 proteomes. Notice that the
function remains positive for distances up to 1000 and that eukary-
otic proteomes (continuous lines) tend to present higher values.
with
C
k
aa
=
1
N −k
N−k
i=1
χ
σ
i
= a
χ
σ
i+k
= a
− f
2
a
,(2)
where N is the sequence length, χ(σ
i
= a) is the charac-
teristic function of finding residue a at position i,andf
a
is
the relative frequency of amino acid a in the proteome. Ac-
cording to this definition, a positive correlation means that,
for a distance k, the number of pairs of equal amino acid
is more frequent than expected due to their frequency in
the proteome. The resulting correlation function for the 8
proteomes we studied (Figure 1) shows that eukaryotic se-
quences have stronger correlations than prokaryotic ones.
Moreover, for all the proteomes, the correlation remains pos-
itive at a medium range, for values of k bigger than 800 or
1000, depending on the proteome. We notice that the natu-
ral order of proteins in the proteomes, given by the succes-
sion of genes in the chromosomes, is relevant: when we ran-
domly permute proteins, the medium range correlations are
lost, both in eukaryotes and prokaryotes.
The medium range correlations imply that, in proteomes,
the amino acid distribution of neighboring proteins tends
to be more similar than that of distant ones. This fact can
be related to the process of duplication, recognied as the
dominant force in the evolution of protein function [16]. As
protein repeats have been related to duplication at different
scales (genome, gene, or exon) [17], it is possible that the
amino acid patterns responsible for the observed medium
range correlation have the same evolutionary origin.
Due to the correlation definition used, the medium range
correlations could be caused either by pairs of amino acids
belonging to the same protein, or to different ones. There-
fore, we split the nonlocal correlation into two groups and
analyse them separately: interprotein correlations (between
2 contiguous proteins) and intraprotein correlations (inside
Table 2: Intra- and interprotein correlation. Intraprotein correla-
tion is always higher than interprotein correlation, and correlation
between matching halves (
−−) is higher than that of not corre-
sponding halves (+
−).
Proteome Intraprot corr Interprot corr
−−
Interprot corr
+−
Mj 0.271914 0.050381 0.050231
Hi 0.265803 0.045588 0.039246
Vc 0.256386 0.063712 0.041780
Ec 0.271597 0.080064 0.069980
Sc 0.270560 0.032501 0.018606
Dm 0.295940 0.095722 0.056176
Ce 0.288071 0.122692 0.077690
the same protein sequence). In Tab le 2 , we present the re-
sults for the intraprotein correlation between the two halves
of the same protein and the interprotein correlation between
corresponding and noncorresponding halves of two contigu-
ous proteins: first half with first half (corr
−−
) and second half
with first half (corr
+−
).
These correlations are defined as follows. Let N
p
be the
number of proteins, let ρ
−
i
(a)andρ
+
i
(a) be the relative fre-
quency of the residue a in the first and the second half of the
ith protein, respectively, and let ρ(a) be the corresponding
mean value. We define
σ
±±
i,j
=
1
20
a
ρ
±
i
(a) −ρ(a)
ρ
±
j
(a) −ρ(a)
,(3)
for instance,
σ
±−
i,j
=
1
20
a
ρ
+
i
(a) −ρ(a)
ρ
−
j
(a) −ρ(a)
. (4)
We also define
σ
+
i
=
σ
++
i,i
, σ
−
i
=
σ
−−
i,i
. (5)
The intraprotein correlation is
C
intra
=
1
N
p
N
p
i=1
σ
−+
i,i
σ
−
i
σ
+
i
. (6)
The two interprotein correlations are
C
−−
inter
=
1
N
p
−1
N
p
−1
i=1
σ
−−
i,i+1
σ
−
i
σ
−
i+1
,
C
+−
inter
=
1
N
p
−1
N
p
−1
i=1
σ
+−
i,i+1
σ
+
i
σ
−
i+1
.
(7)
The correlation values in Tab le 2 have the same trend for all
the proteomes: intraprotein correlation is always higher than
interprotein correlation.
The correlation defined by means of σ
±±
i,j
are different
from the traditional correlation C
k
aa
which is the correla-
tion of the symbol a at distance k,wherek is the number of
residues: we have calculated the correlation function of the
4 EURASIP Journal on Bioinformatics and Systems Biology
−0.01
0
0.01
0.02
0.03
0.04
0.05
Correlation C(k)
0 5 10 15 20 25 30
Distance k (no of proteins)
Sc: inter-prot corr
−−
Sc: inter-prot corr
+−
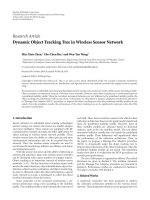
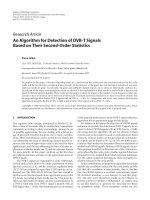
Figure 2: Correlation function, at distance of k proteins, between
amino acids belonging to corresponding (corr
−
), and noncorre-
sponding (corr
+−
) halves; S. cerevisiae proteome. Correlation be-
tween corresponding halves is higher, suggesting that structural re-
quirements modulate the evolution of protein sequences, by main-
taining certain amino acid patterns.
frequencies of the amino acids at the distance of one protein.
In Figure 2, we also analyse how the interprotein correlations
between matching and nonmatching protein halves vary with
the number k of proteins separating the two halves. We com-
pare
C
−−
(k) =
1
N
p
−k
N
p
−k
i=1
σ
−−
i,i+k
σ
−
i
σ
−
i+k
,
C
+−
(k) =
1
N
p
−k
N
p
−k
i=1
σ
+−
i,i+k
σ
+
i
σ
−
i+k
.
(8)
As an extension of the results in Ta bl e 2 , we find that the
correlation between matching halves is kept higher than that
of noncorresponding halves along the proteome. Analogous
results to Ta bl e 2 and Figure 2 hold for second-second and
first-second halves.
Gene duplication can explain both the existence and or-
der dependence of interprotein correlation, but it is not
enough to justify why intraprotein correlations remain high,
because high interprotein correlations can also appear in a
low intraprotein correlations context. Indeed, the presence of
intraprotein correlations indicates a nonrandom distribution
of amino acids at a protein length scale. This nonrandomness
can be related to segmental duplication, that is, duplication
of segments inside the same protein; likewise, it can reflect
the maintenance of amino acid patterns during the protein
divergence that follows gene duplication as a consequence of
the structural constraints imposed upon protein sequences.
As an example, extensive searches of protein databases
[18] reveal the high frequency of tandemly repeated se-
quences of approximately 50 amino acids, ARM and HEAT,
in eukaryotic proteins. Moreover, those repeats present a core
of strongly conserved hydrophobic residues even when the
other residues start to differ at several other positions.
The evidence obtained from the correlation analysis does
not allow to clarify the nature of the structural constraints
measured: do they reflect the modular repetition of sec-
ondary structure elements, caused by duplication or, per-
haps, they depend on the conservation of higher order ter-
tiary structure units like domains? We try to address this
question by defining amino acid groups as explained in the
next section.
2.2. Grouping of amino acids
In a previous study [4], the complexity of large sets of nonre-
dundant protein sequences was measured using a reduced al-
phabet approximation, that is, using groups of amino acids
defined by an a priori classification. The Shannon entropy
was then estimated from the entropies of the blocks of n-
characters. The authors did not find enough evidence to sup-
port the existence of short range correlations between the
amino acids of protein sequences.
Conversely, given the above evidence of medium range
correlations in proteome sequences, we build groups of cor-
related amino acids using the correlations between the 20
amino acids. We calculate C
k
ab
, the correlation between all
amino acid pairs ab at distances k, in the same way we cal-
culate C
k
aa
in the previous section:
C
k
ab
=
1
N −k
N−k
1
χ
σ
i
= a
χ
σ
i+k
= b
−
f
a
f
b
. (9)
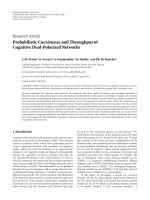
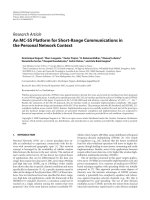
A quick look at the resulting 20
× 20 matrix for k = 100
(Figure 3), which presumably includes both intraprotein and
interprotein correlation, puts in evidence that the signs of the
matrix elements, and thus the positive and negative correla-
tions, are not distributed randomly among residues but, in-
stead, in a grouped fashion: some amino acids present posi-
tive or negative correlations with the same subset of residues.
Then, we construct groups of amino acids in such a way
that they maximise the positive medium range correlation;
in practical terms it means that amino acids which are more
likely to appear at distances of order 100 would be grouped
together.
For a given partition of the set of amino acids in N
g
groups, we calculate the sum of the correlation function be-
tween any pair of residues ab belonging to a same group.
More precisely, groups are obtained by maximising the fol-
lowing quantity:
F(G)
=
N
g
i=1
a,b∈g
i
200
k=1
C
k
ab
, (10)
which is function of a partition G of the amino acids in N
g
disjoint sets g
i
. Due to the huge number of possible choices
for the groups, we maximise this value using a simulated an-
nealing algorithm. This is a Monte Carlo algorithm used for
optimisation [19]. For a given partition G, we construct a
new partition G
choosing at random a residue and changing
Dario Benedetto et al. 5
VLIMFWNQHKRDEGASTCYP
VLIMFWNQHKRDEGAS
T
CYP
Figure 3: Correlation between the 20 amino acids for Hi. Posi-
tive (black) and negative (grey) correlations determine amino acid
groups.
Table 3: Groups of amino acids determined by maximisation of
the positive medium range correlation. Amino acids that are more
likely to appear at 200 residues distance are grouped together.
Proteome Groups
Hi
LIFWSY
VMGATP
NQHKRDEC
Mj
LIFWNSY
VMQHGATCP
KRDE
Sc
LIMFWCY
NQHSTP
KRDE
VGA
Hs
VLIMFWNY
HSTC
QKDE
RGAP
its group. If F(G
) >F(G), the algorithm accepts the new par-
tition. Iterating this procedure we would reach a local max-
imum which may not be the absolute maximum. In order
to avoid being trapped in a local maximum, the algorithm
accepts, with a small probability P, a new partition G
for
which F(G
) ≤ F(G). The value of this probability P slowly
decreases to zero as the number of iterations increases in such
a way that the convergence of the algorithm to the absolute
maximum of F is guaranteed.
The number and the structure of the groups chosen have
the highest value of F(G) and represent an equilibrated par-
tition of the 20 amino acids, that is, groups with only one
element are not accepted.
The idea behind our grouping scheme is to simplify
the amino acid pattern mining by taking advantage of their
synonymous relationships. It is well known that mutations
between amino acids sharing geometrical and/or physico-
chemical properties are the basis of neutral evolution at a
molecular level [20]; this fact also explains why there is
not a one-to-one relationship between protein sequences
and structures [21]. Moreover, structurally neighboring
residues have been found to distribute differentially (proxi-
mally/distally) in the protein sequences, depending on their
physico-chemical properties [22].
Indeed, the groups defined from the pair correlations at
amediumrange(Ta bl e 3 ) almost correspond with the natu-
ral classification based on their physico-chemical properties:
hydrophobic, polar, charged, small, and ambiguous. In par-
ticular, the fact that hydrophobic amino acids group together
allows us to think that the correlation function is gathering
some of the three-dimensional information contained in the
protein sequence, more precisely tertiary structure informa-
tion, as hydrophobic interactions are considered the driving
forces of the protein folding process [23].
Therefore, the reason why intraprotein correlations re-
main high is not only related to the repetition of secondary
structure units, but is also the conservation of the amino
acids responsible for the protein tertiary structure.
Beside this, it is important to notice that, even if the
amino acid usage in eukaryotes and prokaryotes is very sim-
ilar [24], the amino acid correlations are not, as they col-
lect part of the structural information, contained in the se-
quences. The number of groups is also different: 3 for H. in-
fluenzae and M. jannaschii,4forS. cere visiae and H. sapiens.
This could indicate a higher interchangeability of residues in
some proteomes, but further analysis is needed to confirm
this hypothesis.
2.3. Sequence entropy estimation
In order to quantify the capability that a statistical model has
to identify the nonrandomness of a sequence, one can use it
to construct an arithmetic coding compressor [25]. We es-
timate the compression rate of such a compressor with the
sequence entropy
S
=−
1
N
N
i
log
2
p
i
(σ
i
), (11)
using the model to calculate the probability P
i
σ
i
of charac-
ter σ
i
at position i. The better is the model, the lower is the
estimated value of the sequence entropy. We construct three
models to estimate the probability of each character, consid-
ering the previous ones and taking into account both short
and medium range correlations. For each model, we find pa-
rameters that minimise the sequence entropy. The S
min
value
obtained is taken as an estimate of the compression rate of
a running arithmetic codification [25] of the proteomes and
is used to compare our results with other compression algo-
rithms (Ta bl e 4 ).
Previous works on protein sequence compression like [5]
are based on short range Markovian models. In those models,
the probability of each amino acid is calculated as a function
of the context in which it appears, considering the frequency
6 EURASIP Journal on Bioinformatics and Systems Biology
Table 4: Compression rate in bit per character for the studied proteomes. One-character entropy is the entropy of the sequences considering
that their residues are independently distributed.
Algorithm Hi Mj Sc Hs
One-character entropy 4.155 4.068 4.165 4.133
CP, Nevill-Manning and Witten 1999 [5] 4.143 4.051 4.146 4.112
lza-CTW, Matsumoto et al. 2000 [6] 4.118 4.028 3.951 3.920
ProtComp, Cao et al. 2007 [7] 4.108 4.008 3.938 3.824
XM, Cao et al. 2007 [7] 4.102 4.000 3.885 3.786
Model 1
∗
4.111 4.017 3.963 3.978
Model 2
∗
4.102 4.005 3.948 3.933
Model 3
∗
4.100 4.002 3.945 3.931
ProtComp, Hategan and Tabus 2004 [8]
†
2.330 3.910 3.440 3.910
BWT/SCP, Adjeroh and Nan 2006 [9]
†
2.546 2.273 3.111 3.435
∗
Estimation
†
Results obtained with a different set of proteomes
with which this amino acid happens to be after the l previous
residues.
Following this idea, we start our statistical description
of proteome sequences taking into account the information
given by the neighboring residues using a variation of the in-
terpolated Markov models [26]. In order to predict the prob-
ability of the ith character, we consider the contexts up to a
length Nc (number of contexts) that precede it, that is, the
substrings σ
i−k
···σ
i−1
for k = 0, ,Nc. For any charac-
ter a, we count the number F
i
k
(a) of previous occurrences
of the substring σ
i−k
···σ
i−1
a. The conditional frequency of
finding character a after the context σ
i−k
···σ
i−1
is obtained
dividing by the sum over all amino acids b at position i:
F
i
k
(a)
b
F
i
k
(b)
. (12)
Our model 1 predicts the probability of character a at posi-
tion i with
Model 1: p
i
(a) =
1+
Nc
k=0
λ
k
F
i
k
(a)
b
1+
Nc
k=0
λ
k
F
i
k
(b)
. (13)
We remark that the main difference between our short range
approach and CTW is that we give a weight to the different
contexts, while in [6] a weight is given to their correspond-
ing conditional probabilities. We find that the most infor-
mative positions were the previous 8; this length is in qual-
itative agreement with the results found in [6]. Model 1 in
Ta bl e 4 indicates the results obtained considering only the
short range correlations for Nc
= 8.
The model depends on the parameters λ
k
that are op-
timised, using standard algorithms for minimisation, in or-
der to achieve the best estimate of the compression rate. This
“entropy minimisation” stage is very time expensive. In a real
compression procedure, those parameters should be speci-
fied and therefore would contribute to the estimated entropy.
In our case this contribution is negligible.
The short range correlations support the existence of pe-
riodic patterns in protein sequences. They can be caused by
the alternation of alpha-beta secondary structure units, as
argued in other works on latent periodicity of protein se-
quences [27, 28]. From the point of view of protein sequence
evolution, the short range parameters can also reflect the ex-
istence of constraints on the distribution of residues. Protein
sequences are modified by mutation, but still have to cope
with folding requirements that determine a nonrandom po-
sitioning of key residues, depending on their geometrical and
physico-chemical properties. In fact, structural alphabets de-
rived from hidden Markov models denote that local confor-
mations of protein structures have different sequence speci-
ficity [29].
The intra/interprotein correlations identified in previous
sections suggest that the frequencies of the single residues
has nonnegligible fluctuations on the medium range. We take
into account these fluctuations in our second model (model
2inTa bl e 4 ):
Model 2: p
i
(a) =
1+μR
i
L
(a)+
Nc
k=0
λ
k
F
i
k
(a)
b
1+μR
i
L
(b)+
Nc
k
=0
λ
k
F
i
k
(b)
. (14)
Here we added
R
i
L
(a) =
number of a in σ
i−L
···σ
i−1
i
L
. (15)
This quantity is proportional to the frequency of the amino
acid a in the subsequence of length L,withL a distance of
medium scale, starting from the position i
−L.Thefactori/L
guarantees that
a
R
i
L
(a) = i, so that it increases with i in the
same way as the other terms of the sum (e.g.,
a
F
i
0
(a) = i).
The parameter μ is optimised as λ
k
.TheoptimalvaluesforL
found during the entropy minimisation stage are 190 for Hi,
163 for Mj, 105 for Sc, and 115 for Hs.
Finally, in model 3, we use the groups found in
Section 2.2 (see Tab l e 3). In particular, a contribution to
the probablity of a given residue is obtained by computing
the probability of the residue to belong to a certain group
and then the conditional probability of the residue once the
group is given is
Model 3: p
i
(a) =
1+μG
i
L
g
a
f
i
(a)+
Nc
k=0
λ
k
F
i
k
(a)
b
1+μG
i
L
g
b
f
i
(b)+
Nc
k
=0
λ
k
F
i
k
(b)
,
(16)
Dario Benedetto et al. 7
where g
a
is the group of a, f
i
(a) is the relative frequency of a
in its group, as measured up to the position i
−1, and
G
i
L
(g) =
number of amino acids of
the group g inσ
i−L
···σ
i−1
i
L
.
(17)
For this model, the optimal values of the parameter L are 129
for Hi, 94 for Mj, 77 for Sc, and 100 for Hs.
As one can see in Tab le 4 , the capability of our statistical
model to represent the nonrandom information contained
in proteomes is comparable to those models that consider
repeated amino acid patterns at both short and medium scale
[6, 7].
The improvement in the performance of models 2 and 3
is due to the fact that they identify the short range correla-
tions and separate them from the fluctuations of amino acid
frequencies at a protein length range. This demonstrates that
both correlation types are informative and that the statistical
significance of repetitions at those scales is enough to model
the amino acid probabilities.
The compression rate achieved when the medium range
correlations are modelled with the frequency of amino acid
groups (model 3) is almost equivalent to the compression
rate of model 2. From a biological perspective it indicates that
groups of amino acids are meaningful, and that the redun-
dant information at medium scale has a structural compo-
nent might be coming from the three-dimensional structure
constraints.
According to our results, there is an important difference
in the compressibility rates of the eukaryotic and prokaryotic
proteomes which is in agreement with the correlation func-
tion in Figure 1. The sequences of S. cerevisiae and H. sapi-
ens are more redundant, and thus more compressible, than
those of H. influenzae and M. jannaschii; correspondingly,
the correlation functions of Sc and Hs remain positive for
longer distances than Hi and Mj. This additional redundancy
could be related to the presence, in eukaryotic proteomes, of
paralogous proteins with very similar distribution of synony-
mous amino acids, but different function. There is evidence
suggesting that paralogous genes have been recruited during
evolution of different metabolic pathways and are related to
the organism adaptability to environmental changes [16]. On
the other hand, the lower compressibility of the Hi and Mj
proteomes is in agreement with the reduction of prokaryotic
genome size as an adaptation to fast metabolic rates [30, 31].
3. CONCLUSIONS
In this article, we show that the correlation function gath-
ers evolutionary and structural information of proteomes.
Even if proteins are highly complex sequences, at a proteome
scale, it is possible to identify correlations between charac-
ters at short and medium ranges. It confirms that protein
sequences are not completely random, indeed they present
repeated amino acid patterns at those two scales. The alter-
nation of secondary structure units can determine the local
redundancy. This was already known and generally modelled
using Markov models. In our opinion, sequence duplication
is a reasonable explanation for the interprotein correlation.
However, it does not account for the intraprotein correla-
tions; this can instead be related to the maintenance of the
amino acid patterns responsible for the three-dimensional
structure, as the segregation between hydrophobic and polar
amino acids indicates. More elaborately, the sampling of the
space of structures during proteome evolution is determined
by the duplication processes but it is highly constrained by
the structural and functional requirements that protein se-
quences have to meet inside a living system.
Prokaryotic proteomes show lower correlation values, es-
pecially for distances under 100 residues, and a smaller com-
pressibility than eukaryotic proteomes. These characteristics
point at a higher redundancy of eukaryotic proteome se-
quences, and suggest that the increase of proteome size does
not imply de novo generation of protein sequences, with
completely different amino acid distribution.
ACKNOWLEDGMENTS
The authors would like to thank Toby Gibson for reading and
commenting the manuscript and the reviewers for their con-
structive criticism that helped to improve the quality of the
paper.
REFERENCES
[1] J. C. Wootton, “Non-globular domains in protein sequences:
automated segmentation using complexity measures,” Com-
puters & Chemistry, vol. 18, no. 3, pp. 269–285, 1994.
[2] B. E. Blaisdell, “A prevalent persistent global nonrandomness
that distinguishes coding and non-coding eucaryotic nuclear
DNA sequences,” Journal of Molecular Evolution, vol. 19, no. 2,
pp. 122–133, 1983.
[3] Y. Almirantis and A. Provata, “An evolutionary model for the
origin of non-randomness, long-range order and fractality in
the genome,” BioEssays, vol. 23, no. 7, pp. 647–656, 2001.
[4] O. Weiss, M. A. Jim
´
enez-Monta
˜
no, and H. Herzel, “Informa-
tion content of protein sequences,” Journal of Theoretical Biol-
ogy, vol. 206, no. 3, pp. 379–386, 2000.
[5] C. G. Nevill-Manning and I. H. Witten, “Protein is incom-
pressible,” in Proceedings of the Data Compression Conference
(DCC ’99), pp. 257–266, Snowbird, Utah, USA, March 1999.
[6] T. Matsumoto, K. Sadakane, and H. Imai, “Biological sequence
compression algorithms,” Genome Informatics, vol. 11, pp. 43–
52, 2000.
[7] M.D.Cao,T.I.Dix,L.Allison,andC.Mears,“Asimplestatis-
tical algorithm for biological sequence compression,” in Pro-
ceedings of the Data Compression Conference (DCC ’07),pp.
43–52, Snowbird, Utah, USA, March 2007.
[8] A. Hategan and I. Tabus, “Protein is compressible,” in Pro-
ceedings of the 6th Nordic Signal Processing Symposium (NOR-
SIG ’04), pp. 192–195, Espoo, Finland, June 2004.
[9] D. Adjeroh and F. Nan, “On compressibility of protein se-
quences,” in Proceedings of the Data Compression Conference
(DCC ’06), pp. 422–434, Snowbird, Utah, USA, March 2006.
[10] G. Sampath, “A block coding method that leads to signifi-
cantly lower entropy values for the proteins and coding sec-
tions of Haemophilus influenzae,” i n Proceedings of the IEEE
Bioinformatics Conference (CSB ’03), pp. 287–293, Stanford,
Calif, USA, August 2003.
8 EURASIP Journal on Bioinformatics and Systems Biology
[11] C. E. Shannon, “A mathematical theory of communication,”
Bell System Technical Journal, vol. 27, pp. 379–423 and 623–
656, 1948.
[12] J. Cleary and I. Witten, “Data compression using adaptive cod-
ing and partial string matching,” IEEE Transactions on Com-
munications, vol. 32, no. 4, pp. 396–402, 1984.
[13] F. M. J. Willems, Y. M. Shtarkov, and T. J. Tjalkens, “The
context-tree weighting method: basic properties,” IEEE Trans-
actions on Information Theory, vol. 41, no. 3, pp. 653–664,
1995.
[14] Integr8 web portal, />2006.
[15] J. Abel, “The data compression resource on the internet,”
o/, 2005.
[16] C. A. Orengo and J. M. Thornton, “Protein families and their
evolution—a structural perspective,” Annual Review of Bio-
chemistry, vol. 74, pp. 867–900, 2005.
[17] J. Heringa, “The evolution and recognition of protein se-
quence repeats,” Computers & Chemist ry, vol. 18, no. 3, pp.
233–243, 1994.
[18] M.A.Andrade,C.Petosa,S.I.O’Donoghue,C.W.M
¨
uller, and
P. Bork, “Comparison of ARM and HEAT protein repeats,”
Journal of Molecular Biology, vol. 309, no. 1, pp. 1–18, 2001.
[19] S. Kirkpatrick, C. D. Gelatt Jr., and M. P. Vecchi, “Optimiza-
tion by simulated annealing,” Science, vol. 220, no. 4598, pp.
671–680, 1983.
[20] L. A. Mirny and E. I. Shakhnovich, “Universally conserved po-
sitions in protein folds: reading evolutionary signals about sta-
bility, folding kinetics and function,” Journal of Molecular Bi-
ology, vol. 291, no. 1, pp. 177–196, 1999.
[21]M.A.Huynen,P.F.Stadler,andW.Fontana,“Smoothness
within ruggedness: the role of neutrality in adaptation,” Pro-
ceedings of the National Academy of Sciences of the United States
of America, vol. 93, no. 1, pp. 397–401, 1996.
[22] S. Karlin, “Statistical signals in bioinformatics,” Proceedings of
the National Academy of Sciences of the United States of Amer-
ica, vol. 102, no. 38, pp. 13355–13362, 2005.
[23] K. A. Dill, “Dominant forces in protein folding,” Biochemistry,
vol. 29, no. 31, pp. 7133–7155, 1990.
[24] B. Rost, “Did evolution leap to create the protein universe?”
Current Opinion in Structural Biology, vol. 12, no. 3, pp. 409–
416, 2002.
[25] J. Rissanen and G. G. Langdon Jr., “Arithmetic Coding,” IBM
Journal of Research and Development, vol. 23, no. 2, pp. 149–
162, 1979.
[26] S. L. Salzberg, A. L. Delcher, S. Kasif, and O. White, “Microbial
gene identification using interpolated Markov models,” Nu-
cleic Acids Research, vol. 26, no. 2, pp. 544–548, 1998.
[27] V. P. Turutina, A. A. Laskin, N. A. Kudryashov, K. G.
Skryabin, and E. V. Korotkov, “Identification of latent period-
icity in amino acid sequences of protein families,” Biochemistry
(Moscow), vol. 71, no. 1, pp. 18–31, 2006.
[28] E. V. Korotkov and M. A. Korotkova, “Enlarged similarity of
nucleic acid sequences,” DNA Research, vol. 3, no. 3, pp. 157–
164, 1996.
[29]A.C.CamprouxandP.Tuff
´
ery, “Hidden Markov model-
derived structural alphabet for proteins: the learning of pro-
tein local shapes captures sequence specificity,” Biochimica et
Biophysica Acta, vol. 1724, no. 3, pp. 394–403, 2005.
[30] S. D. Bentley and J. Parkhill, “Comparative genomic structure
of prokaryotes,” Annual Review of Genetics, vol. 38, pp. 771–
791, 2004.
[31] J. Raes, J. O. Korbel, M. J. Lercher, C. von Mering, and P. Bork,
“Prediction of eff
ective genome size in metagenomic samples,”
Genome Biology, vol. 8, no. 1, p. R10, 2007.