Báo cáo hóa học: " Research Article Variation in the Correlation of G + C Composition with Synonymous Codon Usage Bias among Bacteria" docx
Bạn đang xem bản rút gọn của tài liệu. Xem và tải ngay bản đầy đủ của tài liệu tại đây (4.45 MB, 7 trang )
Hindawi Publishing Corporation
EURASIP Journal on Bioinformatics and Systems Biology
Volume 2007, Article ID 61374, 7 pages
doi:10.1155/2007/61374
Research Article
Variation in the Correlation of G + C Composition with
Synonymous Codon Usage Bias among Bacteria
Haruo Suzuki, Rintaro Saito, and Masaru Tomita
Institute for Advanced Biosciences, Keio University, Yamagata 997-0017, Japan
Received 31 January 2007; Accepted 4 June 2007
Recommended by Teemu Roos
G + C composition at the third codon position (GC3) is widely reported to be correlated with synonymous codon usage bias.
However, no quantitative attempt has been made to compare the extent of this correlation among different genomes. Here, we
applied Shannon entropy from information theory to measure the degree of GC3 bias and that of synonymous codon usage bias
of each gene. The strength of the correlation of GC3 with synonymous codon usage bias, quantified by a correlation coefficient,
varied widely among bacterial genomes, ranging from
−0.07 to 0.95. Previous analyses suggesting that the relationship between
GC3 and synonymous codon usage bias is independent of species are thus inconsistent with the more detailed analyses obtained
here for individual species.
Copyright © 2007 Haruo Suzuki et al. This is an open access article distributed under the Creative Commons Attribution License,
which permits unrestricted use, distribution, and reproduction in any medium, provided the original work is properly cited.
1. INTRODUCTION
Most amino acids can be encoded by more than one codon
(i.e., a triplet of nucleotides); such codons are described as
being synonymous and usually di ffer by one nucleotide in
the third position. In many organisms, alternative synony-
mous codons are not used with equal frequency. Various fac-
tors have been proposed to contribute to synonymous codon
usage bias, including G + C composition, replication strand
bias, and translational selection [1]. Here, we focus on the
contribution of G + C composition to synonymous codon
usage bias.
G + C composition has been widely reported to be cor-
related with synonymous codon usage bias [2–11]. However,
no quantitative attempt has been made to compare the ex-
tent of this correlation among different genomes. It would be
useful to be able to quantify the strength of the correlation
of G + C composition with synonymous codon usage bias
in such a way that the estimates could be compared among
genomes.
Different methods have been used to analyse the
relationships between G + C composition and synonymous
codon usage. Multivariate analysis methods, such as corre-
spondence analysis [5–7] and principal component analysis
[8], have been widely used to construct measures account-
ing for the largest fractions of the total variation in synony-
mous codon usage among genes. Carbone et al. [2, 3] used
the codon adaptation index as a “universal” measure of dom-
inating codon usage bias. The measures obtained by these
methods can be interpreted as having different features (e.g.,
G + C composition bias, replication strand bias, and transla-
tionally selec ted codon bias), depending on the gene groups
analyzed. Therefore, these methods would be useful for ex-
ploratory data analysis but not for the analysis of interest
here. By contrast, measures such as the “effective number of
codons” [10] and Shannon entropy from information theory
[11] are well defined; these measures can be regarded as rep-
resenting the degree of deviation from equal usage of synony-
mous codons, independently of the genes analyzed. Previous
analyses of the relationships between G +C composition a nd
synonymous codon usage bias using these measures have had
two problems. First, these measures of synonymous codon
usage bias have failed to take into account al l three aspects of
amino acid usage (i.e., the number of different amino acids,
their relative frequency, and their codon degeneracy), and
therefore are affected by amino acid usage bias, which may
mask the effects directly linked to synonymous codon usage
bias. Second, previous analyses have compared the “degree”
of synonymous codon usage bias with G + C content [de-
fined as (G + C)/(A+T+G+C)],andhavethereforeyielded
a nonlinear U-shaped relationship (a gene with a very low or
very high G + C content has a high degree of synonymous
2 EURASIP Journal on Bioinformatics and Systems Biology
codon usage bias) [9–11]; it is thus difficult to quantify the
nonlinear relationship.
To overcome the first of these problems, we use the
“weighted sum of relative entropy” (E
w
)asameasureofsyn-
onymous codon usage bias [12]. This measure takes into
account all three aspec ts of amino acid usage enumerated
above, and indeed is little affected by amino acid usage bi-
ases. To overcome the second problem, we compare the de-
gree of synonymous codon usage bias (E
w
) with the degree of
G+C content bias (entropy) instead of simply the G+ C con-
tent; this step can provide a linear relationship. The strength
of the linear relationship can be easily quantified by using a
correlation coefficient.
The approach of quantifying the strength of the corre-
lation of G + C composition with synonymous codon usage
bias by using the entropy and correlation coefficient is ap-
plied to bacterial species for w h ich whole genome sequences
are available.
2. MATERIALS AND METHODS
2.1. Software
All analyses were conducted by using G-language genome
analysis environment software [13], available at http://www
.g-language.org. Graphs such as the histogram and scatter
plot were generated in the R statistical computing environ-
ment [14], available at .
2.2. Sequences
We tested data from 371 bacterial genomes (see Additional
Table 1 for a comprehensive list (available online at http://
www2.bioinfo.ttck.keio.ac.jp/genome/haruo/BSB
ST1.pdf)).
Complete genomes in GenBank format [15]weredown-
loaded from the NCBI repository site ( />genomes/Bacteria). Protein coding sequences containing
letters other than A, C, G, or T and those containing amino
acids with residues less than their degree of codon degener-
acy were discarded. From each coding sequence, start and
stop codons were excluded.
2.3. Analyses
2.3.1. Measure of the degree of synonymous
codon usage bias
Therelativefrequencyofthe jth synonymous codon for the
ith amino acid (R
ij
) is defined as the ratio of the number of
occurrences of a codon to the sum of all synonymous codons:
R
ij
=
n
ij
k
i
j=1
n
ij
,(1)
where n
ij
is the number of occurrences of the jth codon for
the ith amino acid, and k
i
is the degree of codon degeneracy
for the ith amino acid.
The degree of bias in synonymous codon usage of the
ith amino acid (H
i
) was quantified w ith a measure of un-
certainty (entropy) in Shannon’s information theory [16]:
H
i
=−
k
i
j=1
R
ij
log
2
R
ij
,(2)
H
i
can take values from 0 (maximum bias where only one
codon is used and all other synonyms are not present) to a
maximum value H
i max
=−k
i
((1/k
i
)log
2
(1/k
i
)) = log
2
k
i
(no
bias where alternative synonymous codons is used with equal
frequency; that is, for every j, R
ij
= 1/k
i
).
The relative entropy of the ith amino acid (E
i
)isdefined
as the ratio of the observed entropy to the maximum possible
in the amino acid:
E
i
=
H
i
H
i max
=
H
i
log
2
k
i
,(3)
E
i
ranges from 0 (maximum bias when H
i
= 0) to 1 (no bias
when H
i
= log
2
k
i
).
To obtain an estimate of the overall bias in synonymous
codon usage of a gene, we combined estimates of the bias
from different amino acids, as follows. First, to take account
of the difference in the degree of codon degeneracy (k
i
)be-
tween different amino acids, we used the relative entropy (E
i
)
instead of the entropy (H
i
) as an estimate of the bias of each
amino acid. Second, to take account of the difference in rel-
ative frequency between different amino acids in the protein,
we calculated the sum of the relative entropy of each amino
acid weighted by its relative frequency in the protein. The
measure of synonymous codon usage bias, designated as the
“weighted sum of relative entropy” (E
w
)[12], is g iven by
E
w
=
s
i=1
w
i
E
i
,(4)
where s is the number of different amino acid species in the
protein and w
i
is the relative frequency of the ith amino acid
in the protein as a weig hting factor. E
w
ranges from 0 (maxi-
mum bias) to 1 (no bias).
2.3.2. Measure of the d egree of G + C composition bias
The ent ropy was calculated to quantify the degree of bias in
G + C composition at the first, second, and third codon po-
sitions of a gene (H
GC1
, H
GC2
,andH
GC3
,resp.),
H
p
=−p log
2
p − (1 − p)log
2
(1 − p), (5)
where p is the G+C content (defined as (G+C)/(A+T+G+C))
at the first, second, or third codon positions in the nucleotide
sequence (GC1, GC2, or GC3).
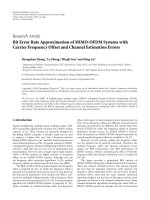
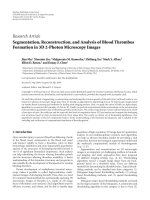
The entropy (H) for G + C composition (and for usage
of two-fold degenerate codons; coding for asparagine, aspar-
tic acid, cysteine, glutamic acid, glutamine, histidine, lysine,
phenylalanine, or tyrosine) with values p and 1
− p is plotted
in Figure 1 as a function of p.
Haruo Suzuki et al. 3
10.80.60.40.20
p
0.2
0.4
0.6
0.8
1
H (bits)
Figure 1: Entropy (H) of G + C composition and usage of two fold
degenerate codons with values p and 1
− p.
2.3.3. Estimation of the correlation of G + C
composition with synonymous codon
usage bias
Spearman’s rank correlation coefficient (r) was calculated
to quantify the strength of the correlation between G + C
composition bias (H
GC1
, H
GC2
,andH
GC3
) and synonymous
codon usage bias (E
w
),
r
=
m
g
=1
x
g
− x
y
g
− y
m
g
=1
x
g
− x
2
m
g
=1
y
g
− y
2
,
x =
1
m
m
g=1
x
g
, y =
1
m
m
g=1
y
g
,
(6)
where x
g
is the rank of the x-axis value (H
GC1
, H
GC2
,orH
GC3
)
for the gth gene, y
g
is the rank of the y-axis value (E
w
)for
the gth gene, and m is the number of genes in the genome.
The r value can vary from
−1 (perfect negative correlation)
through 0 (no correlation) to +1 (perfect positive correla-
tion).
3. RESULTS
3.1. Correlation of G + C composition with
synonymous codon usage bias (r value)
We investigated the correlation b etween the degree of G + C
composition bias (H
GC1
, H
GC2
,andH
GC3
)andthatofsyn-
onymous codon usage bias (E
w
) within each genome.
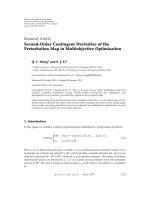
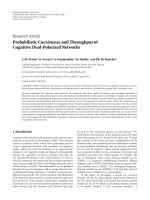
Figure 2 shows scatter plots of E
w
plotted against H
GC1
,
H
GC2
,andH
GC3
with Geobacter metallireducens GS-15 genes
and with Saccharophagus degradans 2–40 genes as examples
and the Spearman’s rank correlation coefficient (r) calculated
from each plot. In G. metallireducens, the value of E
w
was
much better correlated with H
GC3
(Figure 2(c)) than with
H
GC1
(Figure 2(a)), or H
GC2
(Figure 2(b)), indicating that
GC3 contributed more to synonymous codon usage bias than
GC1 and GC2. In S. degradans, the value of E
w
was not cor-
related with H
GC1
(Figure 2(d)), H
GC2
(Figure 2(e)), or H
GC3
(Figure 2(f)), indicating that neither GC1, nor GC2 nor GC3
contributed to synonymous codon usage bias.
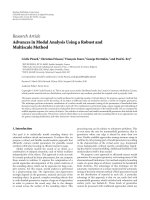
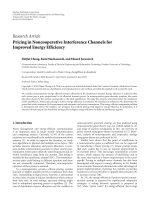
To compare the contributions of GC1, GC2, and GC3 to
synonymous codon usage bias, we produced pairwise scatter
plots of the r values of H
GC1
, H
GC2
,andH
GC3
with E
w
for 371
genomes (Figure 3).
In the scatter plot of the r values of H
GC3
(y-axis) plot-
ted against those of H
GC1
(x -axis) (Figure 3(a)), 362 points
(97.6% of the total) are on the upper left of the line y
= x,
indicating that GC3 contributed more to synonymous codon
usage bias than did GC1 in most of the genomes analyzed.
In the scatter plot of the r values of H
GC3
(y-axis) plot-
ted against those of H
GC2
(x -axis) (Figure 3(b)), 367 points
(98.9% of the total) are on the upper left of the line y
= x,
indicating that GC3 contributed more to synonymous codon
usage bias than did GC2 in most genomes analyzed.
In the scatter plot of the r values of H
GC1
(y-axis) plotted
against those of H
GC2
(x -axis) (Figure 3(c)), the scatter plot
displays a diffuse distribution of points: 186 points (50.1%
of the total) are on the upper left of the line y
= x, in-
dicating that the relative contributions of GC1 and GC2 to
synonymous codon usage bias varied widely from genome to
genome.
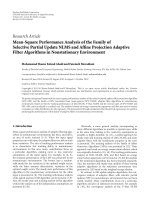
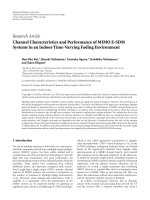
We constructed histograms showing the distribution of
r values of H
GC1
, H
GC2
,andH
GC3
with E
w
for 371 bacte-
rial genomes (Figure 4). The r values of H
GC1
(Figure 4(a))
and H
GC2
(Figure 4(b)) were distributed evenly between pos-
itive and negative values, whereas those of H
GC3
(Figure 4(c))
were distributed towards positive values. The ranges [min-
imum, maximum] of the r values of H
GC1
, H
GC2
,and
H
GC3
were [−0.51, 0.46], [−0.28, 0.39], and [−0.07, 0.95],
respectively. The r values of H
GC1
(Figure 4(a))andH
GC2
(Figure 4(b)) exhibited a monomodal distribution, whereas
those of H
GC3
(Figure 4(c)) exhibited a multimodal distribu-
tion.
3.2. Correlation of r value with genomic features
To investigate whether the correlation of GC3 with synony-
mous codon usage bias (the r value of H
GC3
versus E
w
)was
related to species characteristics, we compared the r values
with genomic features such as genomic G + C content and
tRNA gene copy number. Among the 371 genomes analyzed
here, genomic G + C content ranged from 23% to 73% and
tRNA gene copy number varied from 28 to 145.
We constructed scatter plots of the r values of H
GC3
with
E
w
plotted against genomic G + C content and tRNA gene
copy number for 371 genomes (Figure 5). The relationship
between the r value of H
GC3
and the tRNA gene copy number
was unclear (Figure 5(b)). In contrast, the r values of H
GC3
tended to be high in G + C-poor or G + C-rich genomes, re-
vealing a nonlinear relationship between the r value of H
GC3
andgenomicG+Ccontent(Figure 5(a)). The highest r value
4 EURASIP Journal on Bioinformatics and Systems Biology
10.90.80.70.6
H
GC1
, r = 0.25
0.4
0.5
0.6
0.7
0.8
0.9
E
w
(a)
10.950.90.85
H
GC2
, r =−0.01
0.4
0.5
0.6
0.7
0.8
0.9
E
w
(b)
10.90.80.70.60.50.40.3
H
GC3
, r = 0.95
0.4
0.5
0.6
0.7
0.8
0.9
E
w
(c)
10.960.920.88
H
GC1
, r = 0.06
0.6
0.7
0.8
0.9
E
w
(d)
0.980.940.90.86
H
GC2
, r =−0.08
0.6
0.7
0.8
0.9
E
w
(e)
10.950.90.85
H
GC3
, r =−0.07
0.6
0.7
0.8
0.9
E
w
(f)
Figure 2: Scatter plots of E
w
plotted against (a) H
GC1
,(b)H
GC2
, and (C) H
GC3
for Geobacter metallireducens GS-15 genes and against (d)
H
GC1
,(e)H
GC2
, and (f) H
GC3
for Saccharophagus degradans 2–40 genes. The extent of the correlation between H
GC1
, H
GC2
,andH
GC3
and E
w
is represented by Spearman’s rank correlation coefficient (r).
of H
GC3
(0.95) was found in G. metallireducens,withage-
nomic G+C content of 60% (Figure 2(c)). The lowest r value
of H
GC3
(−0.07) was found in S. degradans, with a genomic
G + C content of 46% (Figure 2(f)). The mean and standard
deviation of the r values of H
GC3
for G + C-poor bacteria
(with genomic G + C contents less than 40%) were 0.58 and
0.12, respectively. The corresponding values for G + C-rich
bacteria (with genomic G + C contents greater than 60%)
Haruo Suzuki et al. 5
00.50−0.5−1
r of H
GC1
−1
−0.5
0
0.5
1
r of H
GC3
(a)
10.50−0.5−1
r of H
GC2
−1
−0.5
0
0.5
1
r of H
GC3
(b)
10.50−0.5−1
r of H
GC2
−1
−0.5
0
0.5
1
r of H
GC1
(c)
Figure 3: Pairwise scatter plots of the r values of H
GC1
, H
GC2
and
H
GC3
with E
w
for 371 bacterial genomes. Comparison of the corre-
lation with E
w
of (a) H
GC3
and H
GC1
,(b)H
GC3
and H
GC2
, and (c)
H
GC1
and H
GC2
.
10.50−0.5−1
r of H
GC1
0
20
40
60
80
Number of genomes
(a)
10.50−0.5−1
r of H
GC2
0
20
40
60
80
Number of genomes
(b)
10.50−0.5−1
r of H
GC3
0
20
40
60
80
Number of genomes
(c)
Figure 4: Histograms of the distribution of r values of (a) H
GC1
,(b)
H
GC2
, and (c) H
GC3
with E
w
for 371 bacterial genomes.
were 0.86 and 0.04. Thus, the r values of H
GC3
for G + C-
poor bacteria tended to be lower than those for G + C-rich
bacteria.
4. DISCUSSION
Other investigators have reported that G + C composition is
correlated with synonymous codon usage bias in many or-
ganisms. However, no quantitative a ttempt has been made
to compare the extent of this correlation among different
genomes. Here, we quantified the strength of the correlation
of G +C composition bias (H
GC1
, H
GC2
,andH
GC3
)withsyn-
onymous codon usage bias (E
w
) by using a correlation coeffi-
cient (r). This approach allowed us to quantitatively compare
the strength of this correlation among different genomes.
6 EURASIP Journal on Bioinformatics and Systems Biology
7060504030
Genomic G + C content (%)
0
0.2
0.4
0.6
0.8
r of H
GC3
(a)
140120100806040
tRNA gene number
0
0.2
0.4
0.6
0.8
r of H
GC3
(b)
Figure 5: Scatter plots of the r values of H
GC3
with E
w
plotted against (a) genomic G+C content and (b) tRNA gene number for 371 bacterial
genomes.
In a previous analysis of the relationships between G + C
composition and synonymous codon usage bias, Wan et al.
[9] stated that “GC3 was the most important factor in codon
bias among GC, GC1, GC2, and GC3.” This is quantitatively
supported by the pairwise comparison of the r values of
H
GC1
, H
GC2
,andH
GC3
(Figure 3). However, the statement by
Wan et al. that “GC3 is the key factor driving synonymous
codon usage and that this mechanism is independent of
species” differs from our conclusion that the strength of the
correlation of GC3 with synonymous codon usage bias (the
r value of H
GC3
) varies widely among species (Figure 4(c)).
This discordance appears to have arisen because Wan et al.
combined the genes from different genomes into a single
dataset for their analysis. This analysis of combined data
from different genomes masks the presence of genomes in
which the correlation of GC3 with synonymous codon usage
bias is negligible (such as that of S. degradans; Figure 2(f));
the results are thus inconsistent with those of the more de-
tailed analyses obtained here for individual genomes.
Three factors, G+C composition, replication strand bias,
and translational selection, are well documented to shape
synonymous codon usage bias [1].
First, in bacteria with extreme genomic G + C composi-
tions (either G + C–rich or A + T–rich), synonymous codon
usage could be dominated by strong mutational bias (toward
G+CorA+T)[17, 18]. The data in Figure 5(a) indicate
that, although genomic G + C content was nonlinearly corre-
lated with the r value of H
GC3
, there are some exceptions; for
example, Nanoarchaeum equitans Kin4-M and Mycoplasma
genitalium G37 had identical genomic G + C contents of
32% but very different r values of H
GC3
(0.34 and 0.87, resp.),
and Ther mococcus kodakarensis KOD1 had a genomic G + C
content of around 50% but a high r value of H
GC3
(0.86).
The existence of the outliers suggests that, although muta-
tional biases have a major influence on the correlation of
GC3 with synonymous codon usage bias, other evolutionary
factors may play a part. For example, horizontal gene trans-
fer among bacteria with different genomic G + C content
can contribute to intragenomic variation in G + C content
[19, 20].
Second, the spirochaete Borrelia burgdorferi exhibits a
strong base usage skew between leading and lagging strands
of replication (generally inferred as reflecting strand-specific
mutational bias): genes on the leading strand tend to pref-
erentially use G- or T-ending codons [21]. The r values of
H
GC3
for genes on the leading and lagging strands are similar
(0.65 and 0.63, resp.). This suggests that strand bias has little
influence on the correlation of GC3 with synonymous codon
usagebiasinB. burgdorferi.
Third, in bacteria with more tRNA genes, synonymous
codon usage could be subject to stronger translational selec-
tion [22]. Figure 5(b) shows that tRNA gene copy number
was not correlated with the r value of H
GC3
. This suggests
that translational selection has little influence on the corre-
lation of GC3 with synonymous codon usage bias. Sharp et
al. [22] showed that the S value as a measure of tr a nslation-
ally selected codon usage bias is highly correlated with tRNA
gene copy number but is not correlated with genomic G + C
content. Thus, the r value of H
GC3
can be used as a measure
complementary to the S value.
The most accepted hypothesis for the unequal usage of
synonymous codons in bacterial genomes is that the unequal
usage is the result of a very complex balance among different
evolutionary forces (mutation and selection) [23]. The com-
bined use of the r value and other methods (e.g., the S value)
will improve our understanding of the relative contributions
of different evolutionary forces to synonymous codon usage
bias.
Haruo Suzuki et al. 7
ABBREVIATIONS
A: Adenine
T: Thymine
G: Guanine
C: Cytosine
GC1: G + C content at the first codon p osition
GC2: G + C content at the second codon position
GC3: G + C content at the third codon position
H
GC1
:EntropyofGC1
H
GC2
:EntropyofGC2
H
GC3
:EntropyofGC3
E
w
: Weighted sum of relative entropy
r: Spearman’s rank correlation coefficient
ACKNOWLEDGMENTS
The authors thank Dr Kazuharu Arakawa (Institute for Ad-
vanced Biosciences, Keio University) for his technical advice
on the G-language genome analysis environment, and Ku-
nihiro Baba (Facult y of Policy Management, Keio Univer-
sity) for his technical advice on the R statistical comput-
ing environment. This work was suppor ted by the Ministry
of Education, Culture, Sports, Science, and Technology of
Japan Grant-in-Aid for the 21st Century Centre of Excellence
(COE) Program entitled “Understanding and Control of Life
via Systems Biology” (Keio University).
REFERENCES
[1] M. D. Ermolaeva, “Synonymous codon usage in bacteria,”
Current Issues in Molecular Biology, vol. 3, no. 4, pp. 91–97,
2001.
[2] A. Carbone, F. Kepes, and A. Zinovyev, “Codon bias signa-
tures, organization of microorganisms in codon space, and
lifestyle,” Molecular Biology and Evolution,vol.22,no.3,pp.
547–561, 2005.
[3] A. Carbone, A. Zinovyev, and F. K
´
ep
`
es, “Codon adaptation in-
dex as a measure of dominating codon bias,” Bioinformatics,
vol. 19, no. 16, pp. 2005–2015, 2003.
[4] R. D. Knight, S. J. Freeland, and L. F. Landweber, “A sim-
ple model based on mutation and selection explains trends
in codon and amino-acid usage and GC composition within
and across genomes,” Genome Biology,vol.2,no.4,pp.
research0010.1–research0010.13, 2001.
[5] J.R.LobryandA.Necs¸ulea, “Synonymous codon usage and
its potential link with optimal growth temperature in prokary-
otes,” Gene, vol. 385, pp. 128–136, 2006.
[6] D. J. Lynn, G. A. C. Singer, and D. A. Hickey, “Synonymous
codon usage is subject to selection in thermophilic bacteria,”
Nucleic Acids Research, vol. 30, no. 19, pp. 4272–4277, 2002.
[7] G. A. C. Singer and D. A. Hickey, “Thermophilic prokaryotes
have characteristic patterns of codon usage, amino acid com-
position and nucleotide content,” Gene, vol. 317, no. 1-2, pp.
39–47, 2003.
[8] H. Suzuki, R. Saito, and M. Tomita, “A problem in multivariate
analysis of codon usage data and a possible solution,” FEBS
Letters, vol. 579, no. 28, pp. 6499–6504, 2005.
[9] X F. Wan, D. Xu, A. Kleinhofs, and J. Zhou, “Quantitative
relationship between synonymous codon usage bias and GC
composition across unicellular genomes,” BMC Evolutionary
Biology, vol. 4, p. 19, 2004.
[10] F. Wright, “The ‘effective number of codons’ used in a gene,”
Gene, vol. 87, no. 1, pp. 23–29, 1990.
[11] B. Zeeberg, “Shannon information theoretic computation of
synonymous codon usage biases in coding regions of human
and mouse genomes,” Genome Research, vol. 12, no. 6, pp.
944–955, 2002.
[12] H. Suzuki, R. Saito, and M. Tomita, “The ‘weighted sum of
relative entropy’: a new index for synonymous codon usage
bias,” Gene, vol. 335, no. 1-2, pp. 19–23, 2004.
[13]K.Arakawa,K.Mori,K.Ikeda,T.Matsuzaki,Y.Kobayashi,
and M. Tomita, “G-language genome analysis environment:
a workbench for nucleotide sequence data mining,” Bioinfor-
matics, vol. 19, no. 2, pp. 305–306, 2003.
[14] R Development Core Team, R: a language and environment for
statistical computing, R Foundation for Statistical Computing,
Vienna, Austria, 2006.
[15] D. A. Benson, I. Karsch-Mizrachi, D. J. Lipman, J. Ostell, and
D. L. Wheeler, “GenBank,” Nucleic Acids Research, vol. 35, sup-
plement 1, pp. D21–D25, 2007.
[16] C. E. Shannon, “A mathematical theory of communication,”
Bell System Technical Journal, vol. 27, pp. 379–423, 1948.
[17] A. Muto and S. Osawa, “The guanine and cytosine content
of genomic DNA and bacterial evolution,” Proceedings of the
National Academy of Sciences of the United States of America,
vol. 84, no. 1, pp. 166–169, 1987.
[18] N. Sueoka, “On the genetic basis of variation and heterogene-
ity of DNA base composition,” Proceedings of the National
Academy of Sciences of the United States of America, vol. 48,
no. 4, pp. 582–592, 1962.
[19] S. Garcia-Vallve, A. Romeu, and J. Palau, “Horizontal gene
transfer in bacterial and archaeal complete genomes,” Genome
Research
, vol. 10, no. 11, pp. 1719–1725, 2000.
[20] R. J. Grocock and P. M. Sharp, “Synonymous codon usage in
Pseudomonas aeruginosa PA01,” Gene, vol. 289, no. 1-2, pp.
131–139, 2002.
[21] J. O. McInerney, “Replicational and transcriptional selection
on codon usage in Borrelia burgdorferi,” Proceedings of the
National Academy of Sciences of the United States of America,
vol. 95, no. 18, pp. 10698–10703, 1998.
[22]P.M.Sharp,E.Bailes,R.J.Grocock,J.F.Peden,andR.E.
Sockett, “Variation in the strength of selected codon usage
bias among bacteria,” Nucleic Acids Research,vol.33,no.4,pp.
1141–1153, 2005.
[23] P. M. Sharp, M. Stenico, J. F. Peden, and A. T. Lloyd, “Codon
usage: mutational bias, translational selection, or both?” Bio-
chemical Society Transactions, vol. 21, no. 4, pp. 835–841, 1993.