Báo cáo hóa học: " Research Article The Effect of Listener Accent Background on Accent Perception and Comprehension" pot
Bạn đang xem bản rút gọn của tài liệu. Xem và tải ngay bản đầy đủ của tài liệu tại đây (833.5 KB, 8 trang )
Hindawi Publishing Corporation
EURASIP Journal on Audio, Speech, and Music Processing
Volume 2007, Article ID 76030, 8 pages
doi:10.1155/2007/76030
Research Article
The Effect of Listener Accent Background on
Accent Perception and Comprehension
Ayako Ikeno and John H. L. Hansen
The Center for Robust Speech Systems, Erik Jonsson School of Engineering and Computer Science, University of Texas at Dallas,
P.O. Box 830688, TX 75083-0688, USA
Received 8 January 2007; Accepted 26 August 2007
Recommended by Jont B. Allen
Variability of speaker accent is a challenge for effective human communication as well as speech technology including automatic
speech recognition and accent identification. The motivation of this study is to contribute to a deeper understanding of accent
variation across speakers from a cognitive perspective. The goal is to provide perceptual assessment of accent variation in native
and English. The main focus is to investigate how listener’s accent background affects accent perception and comprehensibility.
The results from perceptual experiments show that the listeners’ accent background impacts their ability to categorize accents.
Speaker accent type affects perceptual accent classification. The interaction between listener accent background and speaker accent
type is significant for both accent perception and speech comprehension. In addition, the results indicate that the comprehensi-
bility of the speech contributes to accent perception. The outcomes point to the complex nature of accent perception, and provide
a foundation for further investigation on the involvement of cognitive processing for accent perception. These findings contribute
to a richer understanding of the cognitive aspects of accent variation, and its application for speech technology.
Copyright © 2007 A. Ikeno and J. H. L. Hansen. This is an open access article distributed under the Creative Commons
Attribution License, which permits unrestricted use, distribution, and reproduction in any medium, provided the original work is
properly cited.
1. INTRODUCTION
There is a wide range of features contained within the
speech signal that provide information concerning a particu-
lar speaker’s characteristics. A small sampling include (i) ut-
terance content, (ii) speaker identity including age and gen-
der, (iii) emotion/stress, (iv) language/accent, and to a lesser
degree (v) traits such as health (e.g., vocal folds if the speaker
has a cold or is a smoker, etc.). Accent or dialect is a linguis-
tic trait of speaker identity, which indicates the speaker’s lan-
guage background. Accent and dialect both refer to linguistic
variation of a language. Use of these two terms can be am-
biguous, however. In this paper, we use the term accent to be
defined as “the cumulative auditory effect of those features
of pronunciation which identify where a person is from re-
gionally and socially. The linguistic literature emphasies that
the term refers to pronunciation only, is thus distinct from
dialect, which refers to grammar and vocabulary as well”
(Crystal [1, page 2]). English accent, in this study, refers to
both English speech produced by native speakers whose first
language is English (native accent), and by nonnative speak-
ers whose first language is not English (nonnative accent).
Humans learn and use categories as a cognitive process
in everyday life (e.g., Markman and Ross [2]; Ross [3]). A
large part of this categorization is related to linguistic cate-
gories (e.g., Lucy and Gaskins [4, 5]), since how people learn
to categorize objects or concepts has a natural interplay with
the language and how their mind associates the objects or
concepts within the categories (e.g., Yoshida and Smith [6];
Sandhofer and Smith [7]). Although studies on learning and
the use of categories have not dealt with categorization of ac-
cent variation, accents are categories in a general sense. For
example, when people refer to a certain type of accent, such
as “southern accent” in the US or “British accent,” it is con-
ceptually recognized as a distinctive type of accent category.
This suggests that listeners’ familiarity or prior knowledge of
particular accents plays an important role in accent percep-
tion (cf. Clopper [8]). This study will employ a set of percep-
tual experiments, which assess the relationship between the
listeners’ accent background and their perception of accent
variation as well as comprehension of the speech.
Previous studies on accent perception have focused on
detection of nonnative accent (e.g., Jilka [9]; Munro [10]),
and on the perceptual assessment of the degree of foreign
2 EURASIP Journal on Audio, Speech, and Music Processing
accentedness (e.g., Carmichael [11]; Flege [12]; Flege et al.
[13]; Magen [14]). It is understandable for various studies to
have focused on perception of nonnative accents, since non-
native accented English can be problematic in many ways, in-
cluding effective human communication (Davies and Tyler
[15]; Hahn [16]; Pickering [17–19]; Tyler et al. [20]; Wen-
nerstrom [21–24]) and reliable automatic speech recogni-
tion (e.g., Angkititrakul and Hansen [25]; Byrne et al. [26];
Faria [27]; Ikeno et al. [28]; Tomokiyo [29], Ward et al.
[30]). However, variability of native accent perception has
not received as much attention despite the fact that native ac-
cent variation is also problematic for speech technology (e.g.,
Hansen et al. [31, 32]; Tjalve and Huckvale [33]) and in some
cases for human communication as well (Grabe et al., to ap-
pear).
Previous studies that investigated native English accent
perception include Clopper and Pisoni [34–36], Evans and
Iverson [37], and Labov and Sharon [38]. The analyses in
this study focus on listener perception of native English ac-
cent, and consider the relationships between listener accent
background and accent perception from a perspective dif-
ferent than that in past studies. In previous research, all lis-
teners were native listeners of one of the accent categories
provided for the task (e.g., Clopper [8]; Clopper and Pisoni
[34–36], van Heuven and van Leyden [39]) in order to as-
sess the effect of their accent background on the accuracy
of accent perception. Although it is one of the most direct
ways to address the issues of listener dependent character-
istics of perceived accent, there are broader perspectives to
consider. The manner in which listeners who are less famil-
iar with certain accents categorize different accent charac-
teristics can provide a more general understanding of ac-
cent perception as a cognitive process. It can also help iden-
tify which listeners might be more effective or reliable in
performing human accent recognition. Therefore, an ap-
proach that contributes to a deeper understanding of the
relationships between the range of listeners’ accent back-
grounds and their perception of accents is important, as
well as in providing insight into more accent-type-specific
approaches.
The first task in this experiment focuses on assessing lis-
teners’ ability to accurately categorize native English accents
(Task 1). The second task evaluates how accurately listeners
are able to understand the speech (Task 2). The results indi-
cate that accent perception is affected by not only variability
of speech production characteristics but other factors such
as comprehensibility of the speech. The observations suggest
the complex nature of accent perception as a cognitive pro-
cess. The following section describes experimental setup and
procedures.
2. METHODS
This section presents the experimental design employed for
the three sets of perceptual experiments conducted in this
study, including details on test speech materials, listeners,
and listening test procedures.
Table 1: Listener distribution summary.
US British Nonnative
Number of listeners 11 11 11
Male 1 7 4
Female 10 4 7
Age range 22–34 27–43 24–36
Years of residence in US NS 1–10 2–12
2.1. Listeners
The total number of listeners used for this experiment is 33,
with an age range of 22 to 43. All listeners reported no his-
tory of hearing or speech problems. The listener distribution
summary is shown in Ta bl e 1.
Twenty-two US native and nonnative English listeners
were recruited from student populations at the University of
Colorado at Boulder (CU). Most of the British listeners were
recruited through other research institutions in the Boulder
area due to difficulty in obtaining access to British listeners
through CU. The listeners participating in this study received
either a course credit (i.e., psychology subject pool) or mon-
etary compensation after taking the test.
Here, 11 nonnative listeners refer to subjects whose na-
tive languages are Chinese (1), Croatian (1), German (1),
Japanese (1), Korean (3), Spanish (1), Thai (2), and Tigrinya
(1, from Ethiopia) (i.e., speakers of English as a second lan-
guage). All British listeners were from England. However,
they are referred to as “British,” since “English” would be
confusing in the context of this study, which discusses accent
variation of English language from different regions.
British, US, and nonnative listeners were employed in
this experiment to represent different types of familiarity
with the accents. As will be described in the following sec-
tion, UK accented speech was used for the native accent clas-
sification. British listeners represent nativeness for both En-
glish language and UK accents in a broad sense. US listeners
are native to English language but not native listeners of UK
accents. Nonnative listeners are nonnative for both English
language and UK accents, since their first language is not En-
glish and they have not resided in the UK.
2.2. Test speech materials
For Task 1 (native English accent classification), the following
three UK accents were selected: Belfast (Irish), Cambridge
(British English), and Cardiff (Welsh). UK accents were em-
ployed as test materials for this task in an attempt to more
clearly differentiate listener familiarity with the accents. It
is difficult to categorize listeners’ familiarity with a partic-
ular accent in a precise manner, since there are varied factors
that influence the amount of exposure listeners might have
had with the accent. However, UK listeners in this study were
clearly more familiar with UK accents than US or nonnative
listeners since the US and nonnative listeners have not been
exposedtoUKaccentsasmuchasUKnativelistenershave.
All speech samples used in this set of experiment, for
both training and test, are spontaneously produced speech,
A. Ikeno and J. H. L. Hansen 3
and therefore, none of the samples are identical. Although
there are issues that arise due to the inconsistency of speech
samples, spontaneous speech was selected, since read speech
may not represent natural characteristics of how each speaker
speaks, including accent characteristics. The words spoken in
the speech materials are general words with which partici-
pating individuals would be familiar, such as “mother” for
single content words, and “and then you go to your left” for
phrases. Speakers in the test set were different from speakers
in the training set.
The test data set was composed of single content words,
phrases, and sentences extracted from utterances in IViE cor-
pus(Grabeetal.[40], A to-
tal of 36 audio samples were presented to the listeners: 12
content word samples, 12 short phrase samples, and 12 long
phrase or sentence samples. The samples were selected based
on the number of syllables for the single content words, and
number of words for phrases. One- to 3-syllable words were
used for single content words, for example, “north,” “par-
ties,” and “delighted.” For phrases, 3 to 26 words were in-
cluded; 3 to 10 words (5 words on average) in short phrases,
and 11 to 26 words (17 words on average) in long phrases.
In each set, the three accents were presented in a random-
ized order. Words that indicate the characteristic of regional
variation were not included in the test speech samples, since
this experiment focuses on the effect of accent/pronunciation
variation rather than dialectal variation, which also includes
word selection and grammar variation. The training data was
about 60 seconds long per accent type.
For Task 2 (orthographic transcription), the same test
data described above were used: British English (Cam-
bridge), Irish (Belfast), and Welsh (Cardiff) native accents.
2.3. Listening test procedures
Listening tests were conducted individually in an ASHA cer-
tified single-wall sound booth. Tasks consisted of the follow-
ing two scenarios: Task 1: UK native English accent classifi-
cation (3-way response), and Task 2: orthographic transcrip-
tion of the speech heard by the listeners. One test audio file
was presented at a time using an interactive computer inter-
face.
Task 1
The classification task includes 3 types of native English ac-
cent: Cambridge (British English), Belfast (Irish), and Cardiff
(Welsh). The listeners were provided with human training
material of a 60-second long audio file per accent, which was
labeled as Accents 1, 2, and 3.
1
The training audio was acces-
sible by the listeners throughout the test. Listeners were not
1
These audio samples represented characteristics of each accent clearly.
Based on posttest survey, the eleven native British English listeners were
able to identify those as Southern England (Accent 1), North Ireland (Ac-
cent 2), and Wales (Accent 3) without being told from where these accents
originated.
informed of where the three accents originated. The three ac-
cents were presented this way in an attempt to provide the
least amount of external information (e.g., dialect region)
other than actual accent characteristics that are represented
in the speech. They were asked to listen to each test audio file
up to 3 times and select one of the three accent types (Ac-
cents 1, 2, or 3). Listeners were also asked to indicate their
confidence (1
= not sure at all through 5 = absolutely sure)
on their selections.
Task 2
For the transcription task, listeners were asked to listen to
each audio file once and transcribe to the best of their abil-
ity the speech content they heard. Transcription word-error
rates were automatically calculated based on word insertion,
deletion, and substitution. The results will be discussed in re-
lation to the results from Task 1 (accent classification).
2.4. Statistical analysis
Statistical analysis is performed using the repeated measures
ANOVA for classification accuracy, classification confusabil-
ity, and word-error rate. Listener accent background (UK,
US, nonnative) is used as a between factor. Speakers’ accent
type (Cambridge, Belfast, and Cardiff) is the category for
repeated measurement. Significance level 5% is employed.
Fisher’s PLSD is employed for post hoc test.
3. RESULTS
In this section, the analysis of experimental results from Task
1 (native English accent classification) and Task 2 (transcrip-
tion) is presented.
3.1. Task 1: UK native english accent classification
The goal of this task is to assess the relationship between the
listeners’ accent background and their ability to perceive dif-
ferences among native English accents.
3.1.1. Task 1: UK accent classification accuracy
The classification results were analyzed to assess the rela-
tionship between listener accent background and speaker ac-
cent type. The repeated measures ANOVA analysis on clas-
sification accuracy showed a significant effect of listener ac-
cent background (P < .0001) and speaker accent type (P <
.0001). The interaction between listener accent background
and speaker accent type is also significant (P
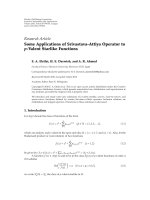
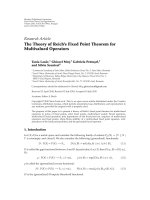
= .0012). British
listeners performed with the highest accuracy (83% on aver-
age), as illustrated in Figure 1. Overall, US listeners’ classifi-
cation accuracy was significantly lower than that of British
listeners (56%). Nonnative listeners showed the lowest clas-
sification accuracy (45%).
A post hoc test shows that differences among the three
listener groups as well as the three speaker accent types are
significant. Although none of the US or nonnative listeners
indicated being particularly familiar with the UK accents, US
4 EURASIP Journal on Audio, Speech, and Music Processing
0
20
40
60
80
100
Accuracy (%)
90
91
66
63
66
38
63
38
34
Average 83%
British
Average 56%
US
Average 45%
nonnative
Listener accent background
Cambridge
Belfast
Cardiff
Figure 1: UK accent classification accuracy (Cambridge, Belfast, and
Cardiff) across three listener groups.
listeners were able to perceive differences among the three ac-
cents more accurately than the nonnative listeners. The dif-
ference in their performance is significant (P
= .0242). This
might suggest that in comparison to nonnative listeners’ per-
formance, being a native speaker/listener of English (US) is
beneficial in accent classification even though their perfor-
mance is not as reliable as familiar listeners’ (British).
As illustrated in Figure 1, for native listeners (British and
US) Cambridge accent and Belfast accent were perceived
with similar accuracy (British: 90% and 91%; US: 63% and
66%) though the accuracy for Belfast accent is slightly higher
in both cases. However, Cardiff accent was significantly less
often perceived correctly (British accuracy: 66%; US accu-
racy: 38%). In the case of nonnative listeners, classification
accuracy for Cambridge accent is the same as US listeners’
(63%). Cardiff accent classification accuracy by nonnative
listeners is similarly low as seen for US listeners’ (34%) as
well. For nonnative listeners classification accuracy of Belfast
accent was also low (38%).
Confidence rating results also suggest that listeners’ re-
sponses were based on their perception of accent types rather
than having to randomly select among the three accents. All
three listener groups rated their confidence higher than 3.0
(somewhat sure) on average in a 5-point scale (1
= not sure
at all, 3
= somewhat sure, 5 = absolutely sure). Similar to
the classification accuracy, British listeners’ confidence rat-
ings were higher (3.9 on average) and US and nonnative lis-
teners’ ratings were lower (3.2% and 3.0% on average).
3.1.2. Task 1: context single content words versus phrases
This section examines how context (single content words
versus phrases) contributes to the effect of listener accent
background and speaker accent type on classification accu-
racy. The repeated measures ANOVA analysis on classifica-
tion accuracy showed a significant effect of listener accent
background with both single content words (P
= .0003) and
phrases (P < .0001) as well as a significant effect of speaker
0
10
20
30
40
50
60
70
80
90
100
Classification accuracy (%)
British US Nonnative
Listener accent background
69
89
53
57
43
46
Single words
Phrases
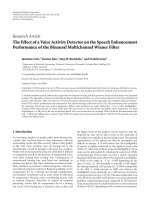
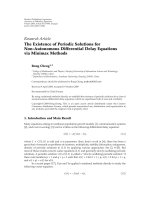
Figure 2: UK accent classification accuracy average based on speech
content (single content words versus phrases) across three listener
groups.
accent type (words, P < .0001; phrases, P < .0001). With
phrases, the repeated measures ANOVA on classification ac-
curacy also showed a significant interaction between listener
accent background (British, US, nonnative) and speaker ac-
cent type (Cambridge, Belfast, Cardiff)(P
= .0011).
A post hoc test shows that in the case of single content
words, the differences between British listeners’ performance
and US or nonnative listeners’ performance are significant (P
= .0080, P < .0001) but not the difference between US listen-
ers and nonnative listeners. As for the speaker type, the differ-
ence between Cambridge or Belfast accent and Cardiff accent
is significant (P < .0001). The difference between Cambridge
accent and Belfast accent is not significant.
It also shows that, with phases, the differences among
all three listener groups are significant (British versus US or
nonnative, P
= < .0001; US versus nonnative, P = .0422).
The differences among the three speaker accent types are also
significant (Cambridge versus Belfast, P
= .0056; Cambridge
versus Cardiff, P < .0001; Belfast versus Cardiff, P
= .0008).
As Figure 2 illustrates, familiar (British) listeners’ perfor-
mance benefited from longer context (69% versus 89% on
average). However, for unfamiliar (US and nonnative) listen-
ers, longer context did not provide additional cues to perceive
the three accents more accurately (US: 53% versus 57%; non-
native: 43% versus 46%).
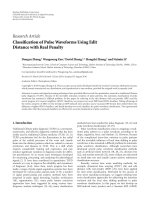
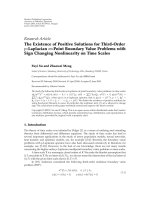
With single content words, listeners were able to clas-
sify Cambridge and Belfast accents with similar accuracy for
each British, US, and nonnative listener group. Cardiff ac-
cent, on the other hand, showed significantly lower accuracy
than Cambridge accent or Belfast accent. It was classified ac-
curately less than half of the time or at chance level by all
listener groups, as can be seen in Figure 3.
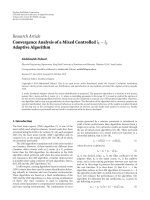
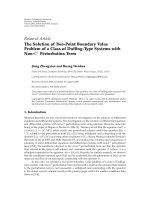
With phrases, although overall classification accuracy
improves, the accuracy for Cardiff accent remains lower than
the accuracy for Cambridge accent and Belfast accent in the
cases of all listener groups (British: 75%; US: 40%; nonna-
tive: 37%), as illustrated in Figure 4. Nonnative listeners did
not benefit from longer context.
A. Ikeno and J. H. L. Hansen 5
0
10
20
30
40
50
60
70
80
90
100
Classification accuracy (%)
British US Nonnative
Listener accent background
75
86
45
64
61
34
52
50
27
Cambridge
Belfast
Cardiff
Figure 3: UK accent classification accuracy across three listener
groups when single words were provided as speech samples.
0
10
20
30
40
50
60
70
80
90
100
Classification accuracy (%)
British US Nonnative
Listener accent background
97
93
75
63
68
40
68
33
37
Cambridge
Belfast
Cardiff
Figure 4: UK accent classification accuracy across three listener
groups when phrases are provided as speech samples.
In summary, longer context (phrases) contributed to the
effect of listener accent background on classification accu-
racy for native listeners (British, US), as was seen in Figure 2.
When familiar (British) listeners were provided with phrases,
classification accuracy was higher than with single content
words.
The following section focuses on the classification con-
fusability among the three UK accents (Cambridge, Belfast,
and Cardiff).
3.1.3. Task 1: UK accent classification confusability
In this section, the analysis focuses on pairwise confusabil-
ity results from UK accent classification (Task 1) in order
to examine how those accents were misperceived. The re-
peated measures ANOVA analysis on classification confus-
ability shows a significant effect of listener accent type (P
< .0001) and speaker accent type (P < .0001) and signif-
icant interaction between listener accent background and
speaker accent type (P
= .0001). A post hoc test shows
0
10
20
30
40
50
60
70
80
90
100
Accuracy & confusability (%)
British US Nonnative
Listener accent background
20
13
66
37
24
38
36
30
34
Cambridge
Belfast
Cardiff
Figure 5: UK accent classification accuracy and confusability for
Cardiff accent, across three listener groups. For example, British lis-
teners misperceived Cardiff accent as Cambridge accent 20% of the
time, and as Belfast accent 13% of the time.
0
10
20
30
40
50
60
70
80
90
100
Accuracy & confusability (%)
British US Nonnative
Listener accent background
90
3
7
63
10
27
63
18 19
Cambridge
Belfast
Cardiff
Figure 6: UK accent classification accuracy and confusability for
Cambridge accent, across three listener groups.
that effect of all three listener groups is significant (British
versus US or nonnative, P < .0001; US versus nonnative,
P
= .0242).
As shown in Figure 5,Cardiff accent was more often mis-
perceived as Cambridge accent than as Belfast accent by all
types of listeners (British: 20% and 13%, US: 37% and 24%,
nonnative: 36% and 30%), especially by less familiar listen-
ers, who misperceived Cardiff as Cambridge accent as often
as they accurately perceived it to be Cardiff accent (US: 37%
and 38%, nonnative: 36% and 34%).
Similarly, as illustrated in Figure 6, Cambridge accent was
misperceived as Cardiff accent more often especially by na-
tive listeners (British: 7%, US: 27%), compared to the cases
where Cambridge accent was misperceived as Belfast ac-
cent (British: 3%, US: 10%). These observations suggest that
Cardiff accent and Cambridge accent are perceptually more
confusable with each other than with Belfast accent.
6 EURASIP Journal on Audio, Speech, and Music Processing
0
10
20
30
40
50
60
70
80
90
100
Tr an scr i pt i on a cc ura c y (% )
British US Nonnative
Listener accent background
85
67
83
88
72
87
44
42
58
Cambridge
Belfast
Cardiff
Figure 7: UK accent transcript ion accuracy across three listener
groups.
3.2. Task 2: transcription: accent perception and
speech comprehensibility
Comprehensibility of nonnative accented English has been
identified to be affected by listeners’ language background
(i.e., native or nonnative listeners of English) (e.g., Bent
and Bradlow [41]). However, past studies have not directly
compared comprehensibility of spoken English and accent
perception. This section, using the listener framework from
Section 2.3, focuses on the effect of speech comprehensibil-
ity by having listeners orthographically transcribe what they
heard.
Repeated measures ANOVA reveal a significant effect of
listener accent background (P < .0001) and speaker accent
type (P < .0001) and significant interaction between listener
accent background and speaker accent type (P
= .0005). A
post hoc test shows significant effect of listener accent back-
ground in the cases of native listeners (UK, US) versus non-
native listeners (P < .0001). It also shows significant effect
of speaker accent type in all cases (Cambridge versus Belfast,
Belfast versus Cardiff, P < .0001; Cambridge versus Cardiff,
P
= .0273).
As illustrated in Figure 7, overall transcription accuracy
2
is affected by the listeners’ nativeness to the language (native
versus nonnative English listeners) rather than their native
English accent type (British versus American). Both British
and US listeners comprehended the speech similarly well
(78% and 82% on average) in comparison to nonnative lis-
teners (48%). For all three listener groups, Cardiff accent
is clearly more comprehensible (83%, 87%, and 58%) than
Belfast accent (67%, 72%, and 42%). For native (British
and US) listeners, Cambridge accent and Cardiff accent were
2
Transcription accuracy for each speech sample is calculated based on
word-error rate (WER), which takes word insertion, substitution, and
deletion into account. Transcription accuracy therefore is 100% minus
WER.
equally comprehensible (British: 85% and 83%; US: 88% and
87%).
According to these trends, it is suggested that native En-
glish listeners (British and US) classified less comprehensi-
ble speech as Belfast accent. This can partially explain why
Cardiff accent was more often confused with Cambridge ac-
cent but not as Belfast accent by native (British and US) lis-
teners (Figure 5), since Cambridge accent and Cardiff accent
were similarly comprehensible for native listeners.
These trends indicate that more comprehensible speech
does not necessarily mean more accurate accent perception.
However, comprehensibility of the speech may play a role as
an indicator of accent characteristics in accent perception in
the cases of native English listeners. In this sense, character-
istics related to speech comprehension contribute to accent
perception. As described in Bent and Bradlow [41], compre-
hension of nonnative accented speech is more accurate when
speakers and listeners share the same native language. Na-
tive listeners in this current study may have had an intuitive
knowledge about this type of phenomena, and used compre-
hensibility of the speech as one of the distinguishing charac-
teristics of the accents (more comprehensible accent versus
less comprehensible accent). It may be the case that the artic-
ulatory variability of accents affects listener comprehension,
and in turn, comprehensibility of the speech impacts accent
perception.
4. DISCUSSION AND CONCLUSION
The experimental results illustrated in Section 3 showed that
for both native English accent classification task and tran-
scription task, the effect of listener accent background and
the effect of speaker accent type are statistically signifi-
cant. The interaction of these factors was significant in both
tasks as well. The results also indicate that being a native
speaker/listener of English is beneficial in accent classifica-
tion, although the difference in performance between famil-
iar native listeners and unfamiliar native listeners was signifi-
cant. On the other hand, as for speech comprehension, famil-
iar and unfamiliar native listeners’ performance was similarly
well. This suggests that comprehension is less dependent on
listener accent type, compared to perception of speaker ac-
cent type. It was also observed that speech comprehension
contributes to accent perception. That is, similarly compre-
hensible accents are more often misperceived as each other
than as more or less comprehensible accents.
The same type of trend was also observed in another ex-
periment (Ikeno and Hansen [42]) which examined the re-
lationship between listener accent background and speaker
accent type through native-nonnative accent detection. In
the detection task as well, it was found that comprehensi-
bility of the speech was related to accent perception. More
comprehensible native English accents tended to be correctly
perceived as native more often, and less comprehensible na-
tive accented English tended to be misperceived as nonna-
tive more often. This trend, taken together with the classifi-
cation results presented in this paper, supports that charac-
teristics related to speech comprehension provides cues for
accent perception.
A. Ikeno and J. H. L. Hansen 7
The findings point to complex nature of accent variation
as a cognitive process. A more complete understanding of
the underlying traits that contribute to both production and
perception of accent is important in a number of domains.
These include (i) speaker recognition or classification (e.g.,
Angkititrakul et al. [43]; Huggins and Patel [44]), (ii) lan-
guage learning and foreign accent modification (e.g., Com-
puter Assisted Language Learning, ), (iii)
automatic accent detection for spoken document retrieval
(e.g., Hansen et al. [31, 32], http://speechfind.utdallas.edu),
(iv) improved knowledge for automatic speech recognition
(e.g., Faria [27]; Ikeno et al. [28]), (v) call center rout-
ing of accent dependent calls to appropriate operators (e.g.,
), and (vi) forensic analysis for legal
and security applications (e.g., Nolan [45]).
In this study, the outcomes indicated the important as-
pects of speaker accent characteristics and the significance
of listener accent background in accent perception. One of
the most crucial implications is that accent perception in-
volves different types or levels of cognitive processes; speech
perception and language processing. This indicates a com-
plex nature of accent perception, and therefore suggests pos-
sible challenges for automated systems that deal with accent
categorization (e.g., classification, detection, identification)
tasks. Finally, it is suggested that this study will contribute
to the motivation of further investigation of cognitive issues
associated with accent variation in human communication
as well as for speaker identification by humans and by ma-
chines.
REFERENCES
[1] D. Crystal, A Dictionary of Linguistics and Phonetics,Blackwell,
Malden, Mass, USA, 1997.
[2] A. B. Markman and B. H. Ross, “Category use and category
learning,” Psychological Bulletin, vol. 129, no. 4, pp. 592–613,
2003.
[3] B. H. Ross, “The use of categories affects classification,” Jour-
nal of Memory and Language, vol. 37, no. 2, pp. 240–267, 1997.
[4] J. A. Lucy and S. Gaskins, “Grammatical categories and the
development of classification preferences: a comparative ap-
proach,” in Language Acquisition and Conceptual Development,
S. C. Levinson and M. Bowerman, Eds., pp. 257–283, Cam-
bridge University Press, New York, NY, USA, 2001.
[5] J. A. Lucy and S. Gaskins, “Interaction of language type and
referent type in the development of nonverbal classification
preferences,” in Language in Mind, D. Gentner and S. Goldin-
Meadow, Eds., pp. 465–492, MIT Press, Cambridge, Mass,
USA, 2003.
[6] H. Yoshida and L. B. Smith, “Shifting ontological bound-
aries: how Japanese- and English-speaking children generalize
names for animals and artifacts,” Developmental Science, vol. 6,
no. 1, pp. 1–17, 2003.
[7] C. M. Sandhofer and L. B. Smith, “Perceptual complexity and
form class cues in novel word extension tasks: how 4-year-old
children interpret adjectives and count nouns,” Developmental
Science, vol. 7, no. 3, pp. 378–388, 2004.
[8] C. G. Clopper, “Linguistic experience and the perceptual clas-
sification of dialect variation,” Ph.D. dissertation, Indiana Uni-
versity, Bloomington, Ind, USA, 2004.
[9] M. Jilka, “The contribution of intonation to the perception
of foreign accent,” Doctoral dissertation, Arbeiten des Insti-
tuts f
¨
ur Maschinelle Sprachverarbeitung (AIMS), University of
Stuttgart, Stuttgart, Germany, 2000.
[10] M. Munro, “Non-segmental factors in foreign accent: ratings
of filtered speech,” Studies in Second Language Acquisition,
vol. 17, no. 1, pp. 17–34, 1995.
[11] L. Carmichael, “Measurable degrees of foreign accent: a cor-
relational study of production, perception, and acquisition,”
Unpublished M.A. thesis, University of Washington, Seattle,
Wash, USA, 2000.
[12] J. E. Flege, “The production of “new” and “similar” phones
in a foreign language: evidence for the effect of equivalence
classification,” Journal of Phonetics, vol. 15, pp. 47–65, 1978.
[13] J.E.Flege,M.J.Munro,andI.R.A.MacKay,“Factorsaffect-
ing strength of perceived foreign accent in a second language,”
Journal of the Acoustical Society of America, vol. 97, no. 5, pp.
3125–3134, 1995.
[14] H. S. Magen, “The perception of foreign-accented speech,”
Journal of Phonetics, vol. 26, no. 4, pp. 381–400, 1998.
[15] C. Davies and A. Tyler, “Demystifying cross-cultural (mis)
communication: improving performance through balanced
feedback of international teaching assistants,” Alexandria, VA,
TESOL, 201-220, 1994.
[16] L. Hahn, “Native speakers’ reaction to non-native stress in En-
glish discourse,” Unpublished doctoral dissertation, University
of Illinois, Urbana-Champaign, Ill, USA, 1999.
[17] L. Pickering, “The analysis of prosodic systems in the class-
room discourse of NS and NNS teaching assistants,” Doctoral
dissertation, University of Florida, Gainesville, Fla, USA, 1999.
[18] L. Pickering and C. Wiltshire, “Pitch accent in Indian-English
teaching discourse,” World Englishes, vol. 19, no. 2, pp. 173–
183, 2000.
[19] L. Pickering, “The role of tone choice in improving ITA com-
munication in the classroom,” TESOL Quarterly, vol. 35, no. 2,
pp. 233–255, 2001.
[20] A. Tyler, A. Jeffries, and C. Davies, “The effect of discourse
structuring devices on listener perceptions of coherence in
non-native university teachers’ spoken discourse,” World En-
glishes
, vol. 7, no. 2, pp. 101–110, 1988.
[21] A. Wennerstrom, “Intonational meaning in English discourse:
a study of non-native speakers,” Applied Linguistics, vol. 15,
no. 4, pp. 399–420, 1994.
[22] A. Wennerstrom, “Intonation as cohesion in academic dis-
course: a study of Chinese speakers of English,” Studies in Sec-
ond Language Acquisition, vol. 20, no. 1, pp. 1–25, 1998.
[23] A. Wennerstrom, “The role of intonation in second language
fluency,” in Perspectives on Fluency, pp. 102–127, The Univer-
sity of Michigan Press, Ann Arbor, Mich, USA, 2000.
[24] A. Wennerstrom, The Music of Everyday Speech: Prosody and
Discourse Analysis, Oxford University Press, New York, NY,
USA, 2001.
[25] P. Angkititrakul and J. H. L. Hansen, “Advances in phone-
based modeling for automatic accent classification,” IEEE
Transactions on Audio, Speech and Language Processing, vol. 14,
no. 2, pp. 634–646, 2006.
[26] W. Byrne, E. Knodt, S. Khudanpur, and J. Bernstein, “Is auto-
matic speech recognition ready for non-native speech? A data
collection effort and initial experiments in modeling conversa-
tional hispanic english,” in Proceedings of Conference on Speech
Technology in Language Learning (ESCA-ITR &), Marholmen,
Sweden, 1998.
8 EURASIP Journal on Audio, Speech, and Music Processing
[27] A. Faria, “Accent classification for speech recognition,” in Pro-
ceedings of the 2nd Joint Workshop on Multimodal Interaction
and Related Machine Learning Algorithms (MLMI ’05), Edin-
burgh, UK, July 2005.
[28] A. Ikeno, B. Pellom, D. Cer, et al., “Issues in recognition
of Spanish-accented spontaneous English,” in Proceedings of
Workshop on Spontaneous Speech Processing and Recognition
(ISCA ’03), pp. 63–66, Tokyo, Japan, 2003.
[29] L. M. Tomokiyo and A. Waibel, “Adaptation methods for non-
native speech,” in Proceedings of Multilinguality in Spoken Lan-
guage Processing, Aalborg, Denmark, September 2001.
[30] W. Ward, H. Krech, X. Yu, et al., “Lexicon adaptation for
LCVSR: speaker idiosyncracies, non-native speakers, and pro-
nunciation choice,” in Proceedings of Workshop on Pronunci-
ation Modeling and Lex icon Adaptation for Spoken Language
Technology (PLMA ’02), pp. 83–88, Estes Park, Colo, USA,
2002.
[31] J. H. L. Hansen, R. Huang, P. Mangalath, B. Zhou, M. Sea-
dle,andJ.R.DellerJr.,“SPEECHFIND:spokendocumentre-
trieval for a national gallery of the spoken word,” in Proceed-
ings of the 6th Nordic Signal Processing Simposium (NORSIG
’04), pp. 1–4, Espoo, Finland, April 2004.
[32] J. H. L. Hansen, U. Yapanel, R. Huang, and A. Ikeno, “Dialect
analysis and modeling for automatic classification,” in Pro-
ceedingsofInternationalConferenceonSpokenLanguagePro-
cessing (ICSLP ’04), pp. 1–4, Jeju Island, Korea, October 2004.
[33] M. Tjalve and M. Huckvale, “Pronunciation variation mod-
elling using accent features,” in Proceedings of the 9th European
Conference on Speech Communication and Technology (Inter-
Speech ’05), pp. 1341–1344, Lisbon, Portugal, September 2005.
[34] C. G. Clopper and D. B. Pisoni, “Effects of talker variability on
perceptual learning of dialects,” Language and Speech, vol. 47,
no. 3, pp. 207–239, 2004.
[35] C. G. Clopper and D. B. Pisoni, “Homebodies and army
brats: some effects of early linguistic experience and residen-
tial history on dialect categorization,” Language Variation and
Change, vol. 16, pp. 31–48, 2004.
[36] C. G. Clopper and D. B. Pisoni, “Some acoustic cues for the
perceptual categorization of American English regional di-
alects,” Journal of Phonetics, vol. 32, no. 1, pp. 111–140, 2004.
[37] B. G. Evans and P. Iverson, “Vowel normalization for accent:
an investigation of best exemplar locations in northern and
southern British English sentences,” Journal of the Acoustical
Society of America, vol. 115, no. 1, pp. 352–361, 2004.
[38] W. Labov and A. Sharon, “Understanding birmingham,” in
Language Variety in the South Revisited, C. Bernstein, T. Nun-
nally, and R. Sabino, Eds., pp. 508–573, University of Alabama
Press, Tuscaloosa, Ala, USA, 1997.
[39] V. J. van Heuven and K. van Leyden, “A contrastive acousti-
cal investigation of Orkney and Shetland intonation,” in Pro-
ceedings of the 15th International Congress of Phonetic Sciences,
M. J. Sol
´
e, D. Recasens, and J. Romero, Eds., pp. 805–808,
Barcelona, Spain, 2003.
[40] E. Grabe, B. Post, and F. Nolan, “The IViE corpus,”
Department of Linguistics, University of Cambridge,
2001 />∼esther/ivyweb.
[41] T. Bent and A. R. Bradlow, “The interlanguage speech intel-
ligibility benefit,” Journal of the Acoustical Society of America,
vol. 114, no. 3, pp. 1600–1610, 2003.
[42] A. Ikeno and J. H. L. Hansen, “Perceptual recognition cues in
native English accent variation: “listener accent, perceived ac-
cent, and comprehension”,” in Proceedings of the IEEE Inter-
national Conference on Acoustics, Speech and Signal Processing
(ICASSP ’06), vol. 1, pp. 401–404, Toulouse, France, May 2006.
[43] P. Angkititrakul, J. H. L. Hansen, and S. Baghaii, “Cluster-
dependent modeling and confidence measure processing for
in-set/out-of-set speaker identification,” in Proceedings of In-
ternational Conference on Spoken Language Processing (ICSLP
’04), pp. 1–4, Jeju Island, South Korea, October 2004.
[44] A. W. F. Huggins and Y. Patel, “The use of shibboleth words
for automatically classifying speakers by dialect,” in Proceed-
ings of the International Conference on Spoken Language Pro-
cessing (ICSLP ’96), vol. 4, pp. 2017–2020, Philadelphia, Pa,
USA, October 1996.
[45] F. Nolan, “Intonation in speaker identification: an experiment
on pitch alignment features,” Forensic Linguistics,vol.9,no.1,
pp. 1–21, 2002.