Báo cáo hóa học: " Research Article A Robust Approach to Segment Desired Object Based on Salient Colors" pot
Bạn đang xem bản rút gọn của tài liệu. Xem và tải ngay bản đầy đủ của tài liệu tại đây (7.56 MB, 11 trang )
Hindawi Publishing Corporation
EURASIP Journal on Image and Video Processing
Volume 2008, Article ID 489202, 11 pages
doi:10.1155/2008/489202
Research Article
A Robust Approach to Segment Desired O bject
Based on Salient Colors
J
´
er
ˆ
ome Da Rugna and Hubert Konik
Laboratoire LIGIV, Universit
´
e Jean Monnet, B
ˆ
atiment E, 18 Rue Beno
ˆ
ıt Lauras, 42000 Saint-Etienne, France
Correspondence should be addressed to J
´
er
ˆ
ome Da Rugna,
Received 13 September 2007; Revised 29 October 2007; Accepted 22 November 2007
Recommended by Alain Tremeau
This paper presents a clustering-based color segmentation method where the desired object is focused on. As classical methods
suffer from a lack of robustness, salient colors appearing in the object are used to intuitively tune the algorithm. These salient
colors are extracted according to a psychovisual scheme and a peak-finding step. Results on various test sequences, covering a
representative set of outdoor real videos, show the improvement when compared to a simple implementation of the same K-means
oriented segmentation algorithm with ad hoc parameter setting strategy and with the well-known mean-shift algorithm.
Copyright © 2008 J. Da Rugna and H. Konik. This is an open access article distributed under the Creative Commons Attribution
License, which permits unrestricted use, distribution, and reproduction in any medium, provided the original work is properly
cited.
1. INTRODUCTION
Digital videos are nowadays widespread on the World Wide
Web or mobile phones but, whereas text documents are self-
describing, their utility suffers as they do not give any ex-
plicit description of their content. The MPEG-7 standard
gives however the true-content-based representation of any
video that allows manipulation and adaptation [15] but the
challenge is still to develop a system that is able to segment
automatically and accurately any videos.
Indeed, more precisely, in the field of new multimedia
services, and more specially around the digital content cre-
ation, distribution, and services, the technology for creating
clickable videos allowing the viewers to click on objects in the
video and purchase products or obtain some complemen-
tary information is a real challenge. This technology sup-
poses firstly an automatic extraction from the image of each
object of interest.
Several segmentation approaches have been proposed us-
ing principally inherent motion [6, 25] or more complex in-
formation [23] in a tracking objective [24]. Moreover, the
well-known semantic gap problem can be narrowed down
using object ontology to define high-level concepts or us-
ing machine learning methods to associate low-level features
with query concepts [12]. Only homogeneity of pixels within
a region plays a role. Similarity identification is calculated
over simple continuous pixel neighborhood similarity with-
out guiding the result through a postsegmentation step based
on human vision [27]. In our work, the deal is not to dis-
cuss about the tracking problem, but only to discuss on how
to improve the segmentation step using some a priori infor-
mation on considered objects. Furthermore, the parameters
have to be few and with a clear interpretation. Besides, only
the segmentation step, that is to say the low-level one, has
to be analyzed. No posttreatment will be possible in order
to improve the results as in [8], where color saliency is in-
troduced, defined from average border contrast, or in [14]
where a probabilistic model for the nonpurposive group-
ing problem is performed. In this study, we can assume that
the following object will appear similar enough along the
sequence. On the other hand, the lighting conditions can
change during the sequence because of shadows or point of
view changing for example.
The segmentation, when talking about image processing
and computer vision, is one of its fundamental problems.
In several approaches, the task of segmentation is divided
into two parts. First part concentrates on low-level process-
ing which can be rather implemented in computers. The sec-
ond part is then provided either from a high-level processing
through a more semantic processing (machine learning) or
simply from a human user who will correct in order to pro-
duce the final segmentation result [12].
2 EURASIP Journal on Image and Video Processing
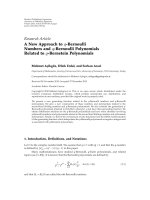
(a) User selection (b) Reference object
Figure 1: Selection step of the reference object. The user selects
a frame in the sequence where the desired object is representative
enough. He locates by hand the object to create a mask and then
initiates the process.
Primarily classified into four types: thresholding, bound-
ary-based, region-based, and hybrid techniques [13], pub-
lished low-level techniques are innumerable. Unfortunately,
segmentation is still nowadays a very challenging task as no
method that is effective for each color image has been de-
veloped so far. Our approach is then not to develop another
method but to improve first naively, and then saliency ori-
ented, this step in adding some features on the desired object,
previously provided by the user, as illustrated in Figure 1.
This paper then discusses the robustness of segmenting
general images, that is, images of any sort of scene under any
illumination, where only one shot of the desired object is
taken as a reference [20]. More precisely, even if the rest of
the image is rawly segmented, the more robust the segmen-
tation of the object is, the better the results are. Some illumi-
nation changes or shades can perturb the segmentation step
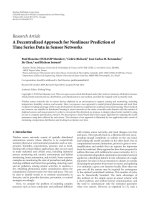
too. Lets cite the example of the blue sky diver filmed dur-
ing his drop (Figure 2). When the white sky diver is too close
or when he becomes smaller and smaller, the robustness may
be defective. The end goal, the tracking of the desired object
during the sequence, will be improved if the segmentation re-
sult is not too sensitive and changing. Partitioning the image
into a set of meaningful regions is in fact prerequisite before
any analysis can be applied. The object tracking is then gener-
ally based on the visual features extracted from these regions.
Among all recent image segmentation techniques, in-
stead of implementing all of them [3, 10, 18, 20, 27], we
have focused our work on two more significant methods
and classically used in the concerned context: a mean-shift-
based method, called MS [7], and the K-means clustering
method [4], called KM. As previously noticed, our goal deals
with how to improve the results and the robustness of these
methods in using some color features extracted from the de-
sired objects. Two important properties for color features
detection are repeatability, meaning that the colors should
be invariant of the varying viewing conditions, and distinc-
tiveness, meaning that they should have high discriminative
power. First of all, the use of MPEG-7 dominant color de-
scriptor (DCD) will be implemented, and to avoid an over-
fitting behavior, we introduce a new approach based on a per-
ceptive saliency model [9].
Lastly, we propose different objective criteria to com-
pare the results. Since the development of common and rea-
sonable ones for evaluating and comparing the segmenta-
tion results performance is yet problematic [16], besides the
Figure 2: Some images extracted of the “sky diver” sequence. Dur-
ing this short cut, that lasted for about 3 seconds, the reference ob-
ject, that is the blue sky diver, changes in size and in shape as well as
the lighting conditions.
ground-truth where the desired objects are given by some ex-
perts, our results will be compared with a classical measure
introduced in [2], which integrates color and spatial distribu-
tion of the regions without requiring any user-set parameter
or threshold value.
This paper is organized as follows. Section 2 reconsid-
ers the lack of unsupervised segmentation algorithms and
discusses their use considering the desired objects features.
Section 3 gives an overview of our constraining algorithm
introducing representative colors, while presenting some ex-
perimental illustrations in comparison with the other tech-
niques reviewed. Finally, Section 4 concludes this paper.
2. USING THE DESIRED OBJECT TO ORIENT
THE SEGMENTATION ALGORITHM
As our objective is to supervise the segmentation method,
we have focused our work on a simple method where the pa-
rameters tuning seems to be logical. The clustering approach
[4] permits to adapt the partition of color space in regards
to the desired object. The principal idea is that adaptive his-
tograms can represent more efficiently the distributions with
much less bins. In [19], the authors proposed a clustering-
based color model where the color space of the object is par-
titioned adaptively but with an empirical setting. In order to
be more robust, the desire to automatically determine the
number of bins is given as a conclusion. Before introduc-
ing a clustering-based approach, lets first introduce the ob-
jective evaluation used in this study in order to measure the
improvement done.
The ill-defined nature of the segmentation problem
makes actually the evaluation of any algorithm difficult. Un-
nikrishnan et al. [22] list three characteristics crucial for
a segmentation algorithm to possess: correctness, that is
the ability to produce a segmentation which agrees with
J. Da Rugna and H. Konik 3
ground-truth, stability with respect to parameter choice, and
stability with respect to image choice. From now on, the as-
sessment introduced in this study will rely on a heteroge-
neous ground-truth coupled to two objective criteria mea-
suring the quality and the robustness of the results.
2.1. Ground-truth
Simulations have been performed to evaluate the perfor-
mance of the proposed algorithm. The experiments have
been carried out on different outdoor sequences, chosen for
their diversity and illumination variations. The first one con-
sists in the DCI-StEM mini movie that provides a full 2 k HD
noncompressed video. The second one is the classical “coast-
guard” sequence, where a little boat guided by a man in red
crosses a bigger one. Each frame is of size 352
×288. The third
(of size 1440
× 1080) and fourth ones (of size 1280 × 720)
present, respectively, a skier passing near the boundary of a
forest implying shadows and divers in a sunny sky with lo-
cal changes of illumination conditions. These sequences are
parts of the Microsoft WMV high definition content show-
case, available at the company’s website (“adrenaline rush”
and “to the limit” sequences). The first three sequences are
presented in Figure 3 while the fourth one has previously
been shown in the introduction part. The temporal resolu-
tion of the test sequences is 25 images per second. Each frame
has been segmented by hand with all desired objects by some
experts.
2.2. Objective evaluation criteria
In the field of data clustering, different measures for evalu-
ation have been developed; Borsotti et al. [2] proposed an
empirical function B(I) design for the evaluation of the seg-
mentation results and checked for different clustering tech-
niques:
B(I)
=
√
R
10000 × (N·M)
×
R
i=1
e
2
i
1 + log A
i
+
Ψ
A
i
A
i
2
,
(1)
where I is the segmented image of size N
×M, R is the num-
ber of regions of the segmented image, A
1≤i≤R
is the number
of pixels of the ith region, e
i
is the color error of the region
i,andΨ(A
i
) is the number of regions of area A
i
. e
i
is calcu-
lated as the sum of the distances to the region color average.
In this formula, the first term is a normalization factor, the
second penalizes oversegmentation, and the third term pe-
nalizes results with nonhomogeneous regions, that is to say
undersegmentation.
Moreover, segmentation is only a part of a larger track-
ing system and the larger system will be improved if the seg-
mentation does not misclassify objects pixels as the back-
ground. The ground-truth segmentation is available and we
could evaluate the percentage of misclassified pixels (ob-
ject/background) for each frame. While the entire object is
important and not particularly the distribution of the regions
inside it, without using an overlapping area matrix [16], the
discrepancy measure is then based on a number of misseg-
mented pixels, called OBC as object-background confusion.
Let Y
=
NY
j
j=1
be a segmentation of the object X and X the
complementary part, that is the part of the image not covered
by the object X. Then the OBC coefficient is defined by
OBC
=
N
j
=1
Card
Y
j
∩ X
×
δ
j
Card(X)
(2)
with
δ
j
=
⎧
⎪
⎪
⎨
⎪
⎪
⎩
1if
Card
Y
j
∩ X
Card
Y
j
≥
t,
0 else,
(3)
where Card(A) is the number of pixels of the region A. t is a
threshold, set to 5%, that enables a region to have a small part
of pixels mixed in the background without being considered
as mixed.
The lower these measures are, the better the segmenta-
tion results are. The robustness of the tracking step will then
depend on small values for these criteria and also on low vari-
ances favorable to a good stability.
2.3. Object oriented K-means algorithm
This classical clustering process is based on an iterative algo-
rithm: each pixel is first allocated to initial cluster K
i
with the
closest cluster center using a specific distance and the main
idea is to change the position of cluster centers as long as at
least one of them is modified by the iteration step. Gener-
ally, dominant colors in the images create dense clusters in
the color space in a natural way. Nevertheless, the results de-
pend on the position of the initial clusters center. To avoid
inherent problem of random initialization, we use an effi-
cient partitioning of the image color space to specify initial
cluster centers [28]. The authors propose a scheme based on
a coarse division of the RGB color space. The initial clusters
correspond to the centroids of the most representative color
bins.
Considering the complexity and the color quantity of
outdoor real scenes, the K-means method suffers from a lack
of adaptability. Our aim is to follow an object in a video se-
quence with the knowledge of it. The matter of this study
is to focus only on the color information without consider-
ing neither the motion nor texture or geometry information
[23].
The initial step is then now to extract dominant colors
that will constrain the segmentation algorithm. Considering
one object, to extract the representative or dominant colors
is a complex problem. First of all, we may discuss about the
following question: what are these colors? Subjectively, it is
commonly known that dominant colors are absolutely not
unique and very relative to the person who defined them. In
this paper, we will discuss about representative colors extrac-
tion only in one aim: to use these colors to refine the K-means
segmentation algorithm.
MPEG-7 defined multimedia content description and
specially color descriptors. The MPEG-7 committee has ap-
proved several color descriptors including the DCD [21].
4 EURASIP Journal on Image and Video Processing
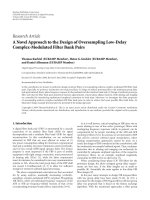
Figure 3: Some frames extracted of sequence 1, sequence 2, and sequence 3, where the reference objects are, respectively, the bottle of wine,
the little boat, and the skier.
Input: A 3D Color Histogram H
Output: Significant peaks of the Histogram
Peaks
← Local maxima of H
Peaks
← Local maxima of Peaks
T
α
← α·max (Peaks)
Peaks
{p ∈ Peaks; H(p) ≥ T
α
}
foreach (p
1
, p
2
) ∈ Peaks × Peaks
if
p
1
, p
2
≤β
if H(p
1
) <H(p
2
)
Peaks
← Peaks \{p
1
}
else
Peaks
← Peaks \{p
2
}
Algorithm 1: Peak-finding algorithm.
While classical techniques are low-cost, fast, and coarse
privileged [11, 28], our objective is to take care of very small
regions and local variations of color images. In this context,
the peak-finding algorithm (see Algorithm 1) introduced in
[5] by Cheng and Sun is used to identify the most signifi-
cant peaks of the histogram in the RGB color space. α is a
threshold used to exclude not enough representative peaks
and β represents the minimum distance allowed between two
peaks. The authors set α to 0.05 and β to 15.
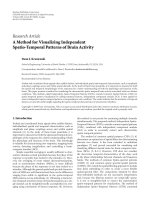
Figure 4 illustrates some dominant colors extracted on
some colorful objects.
Then, the adapted method, named ooKM for object ori-
ented K-means, is the initial method where the dominant
colors, extracted from the desired object as previously de-
scribed, are added to the list of initial cluster centers. More
precisely, the clusters are issued from two families: those
which are obtained considering the entire image and those
obtained with the initial object. We expect that object clus-
Figure 4: Some dominant colors extraction examples. The same
parameters of the peak-finding algorithm are used. The variation of
the number of colors depends on the method that focuses only on
the histogram properties and not on a desired number of colors.
ters, after the iterations during the K-means classification,
will be attractive enough to continue in the final result.
2.4. First results
Ta bl e 1 presents the comparative results using dominant col-
ors versus the original KM algorithm. In order to be on a
level playing field between the two methods, a number of re-
gions quasiequivalent for each method is as much as possible
retained.
As regards Ta bl e 1, the values of Borsotti and OBC cri-
teria are lower for ooKM method. But the difference is not
significant enough to conclude to a superiority of this con-
strained approach. To explain this slight improvement, it is
necessary to focus on the behavior of each method along
the sequence. Figures 5 and 6 give the evolution of Borsotti
and OBC criteria along the sequence 4 while using the dom-
inant colors selected on the object first taken on frame 16
as a reference and on frame 36, respectively. Even if the re-
sults are noticeably improved around these frames, this fact
is not present on the entire sequence. We are confronted to an
J. Da Rugna and H. Konik 5
Table 1: Comparative results KM versus ooKM obtained with oriented approaches with test sequences. Average values and standard devia-
tions are given. The Borsotti and #N values are computed only on the object ground-truth mask.
Criteria Borsotti OBC #N
Method KM ooKM KM ooKM KM ooKM
Sequence 1 3.14 ± 2.63 2.87 ± 2.42 0.06 ± 0.16 0.04 ± 0.01 9 ± 3.3 9 ± 3.1
Sequence 2 0.06
± 0.02 0.06 ± 0.02 0.22 ± 0.22 0.21 ± 0.17 8 ± 0.2 8 ± 0.5
Sequence 3 0.50
± 0.10 0.33 ± 0.09 0.46 ± 0.04 0.28 ± 0.11 4 ± 1.4 6 ± 0.7
Sequence 4 0.97
± 0.37 0.96 ± 0.47 0.43 ± 0.19 0.37 ± 0.23 12 ± 2.1 10 ± 1.1
overfitting problem where the learned colors are too precise:
they cannot be generalized to the complete sequence.
ItcanbeseenfromFigure 5 that around the frame where
the object is extracted the difference between the KM results
and the ooKM ones is larger. In fact, the clusters are pre-
served on the object implying better Borsotti results. On the
contrary, when the dominant colors are used for segmenting
frames where the lighting conditions have noticeably varied,
the clusters are mixed with the background ones and the re-
sults are similar considering the two approaches. The differ-
ence likewise exists with the OBC criteria but the results seem
to be less influenced.
Objectively, we can assume that the results will be im-
proved if we select more dominant colors in order to entirely
cover the object color distribution. Nevertheless, the curves
presentedinFigures7 and 8 illustrate this point of view: it is
possible to parameter the KM algorithm (by notably defining
more seeds) to perform best results for both criteria.
These curves show the evolution of the Borsotti and OBC
criteria on increasing the number of regions. The behavior is
logically an improvement of these both criteria even if some-
times they rise again. The dot, representing the ooKM algo-
rithm, seems to be a good deal between criteria results and
number of regions. Indeed, our aim is to fit as best as possi-
ble the data, without creating a large amount of regions. This
is first because erroneous image segmentation, that is over-
segmentation, is a source of errors and difficulties in further
tracking step; second because, as we have previously said, no
posttreatment leading to a fusion step between adjacent re-
gionswillbeused.
As a first conclusion, the naive idea to constrain the K-
means clustering using dominant colors as complementary
clusters is neither sufficient nor better enough compared to
the KM algorithm alone.
3. OBJECT SALIENT COLORS METHODOLOGY
Extracting the dominant colors of the object in order to im-
prove the K-means clustering has lead to a certain deadlock
even in increasing the number of clusters. The aim is now
to implement a saliency-based mechanism to focus the at-
tention on a well selection of the retained colors as original
clusters.
3.1. Itti model and dominant colors extraction
Itti et al. [1, 9] have proposed a model mapping the saliency
of objects in the visual environment. The aim of this map is
to simulate the human visual attention during the bottom-up
phase using 3 kinds of features: intensity, colors, and orien-
tations (at 0, 45, 90, and 135 degrees). Several spatial scales,
computed using a Gaussian pyramid, allow to simulate hu-
man visual receptive fields: center-surround reception is im-
plemented as the difference between two levels of the pyra-
mid. Six-feature maps are designed 2–5, 2–6, 3–6, 3–7, 4–7,
and 4–8; 2, 3, 4, 5, 6, 7, and 8 corresponding to the pyramid
levels. This process, applies, respectively, to color, intensity,
and orientations, and permits to compute 42 maps separated
in 7 groups: intensity contrast, red/green and blue/yellow
double opponent channels, and 4 encoding orientation con-
trasts (at 0, 45, 90, and 135 degrees). After a normalization
step, all these feature maps are summed to obtain a saliency
map where maxima represent the focus of attention during
the bottom-up phase [17].
Figure 9 presents some salient maps obtained on differ-
ent images. The maxima of intensity correspond to the fo-
cusing zones: in the second image we can estimate for exam-
ple that the skier, for which a zoom is proposed, and bottom
flags are clearly attracting attention.
To avoid the overfitting problem issued from classical col-
ors extraction, the basic idea is to search the representative
colors not on the whole object but in two zones of it: the
high-focusing one and the low-focusing one. From the visual
attention point of view, they represent the low and the high
frequencies. We may note here that the salient map is com-
puted on the reference object and not in the complete image.
As literature fixed the focus threshold at 0.3, we consider that
any pixel whose salient value is higher than this threshold is
the high-focusing pixel group. Reciprocally, we set a thresh-
old of 0.05 to create the low-focusing pixel group.
Figure 10 shows an example of the salient colors retained
on the blue sky diver object. Colors that are attractive and
those that are on the contrary rather dark are automatically
selected. We used the peak-finding algorithm previously pre-
sented during the dominant colors extraction process. We
present in Figure 11 extraction of some salient colors from
objects previously used in Figure 4. Compared to the classical
dominant color extraction, this method generates colors rep-
resenting main zones and small zones of the object where the
classical one is more concentrated only on the main zones.
6 EURASIP Journal on Image and Video Processing
120406080
Frames
0
0.2
0.4
0.6
0.8
1
Borsotti (normalized)
KM
ooKM
(a)
120406080
Frames
0
0.2
0.4
0.6
0.8
1
Borsotti (normalized)
KM
ooKM
(b)
Figure 5: Illustrations of the “overfitting” problem. The reference is, respectively, selected on frames 16 and 36. The figure shows the Borsotti
criteria for KM and ooKM methods.
120406080
Frames
0
0.2
0.4
0.6
0.8
1
Object-background confusion
(normalized)
KM
ooKM
(a)
120406080
Frames
0
0.2
0.4
0.6
0.8
1
Object-background confusion
(normalized)
KM
ooKM
(b)
Figure 6: Illustrations of the “overfitting” problem. The reference is, respectively, selected on frames 16 and 36. The figure shows the OBC
criteria for KM and ooKM methods.
1 5 10 15 20 25 30 35
Number of regions
0
0.4
0.8
1.5
Borsotti
KM
ooKM
(a)
1 5 10 15 20 25 30 35 40 45 50
Number of regions
0
0.6
1.5
3
4
Borsotti
KM
ooKM
(b)
Figure 7: Illustrations of the difficulty to reach the best deal between Borsotti optimization and number of regions in the object (sequence 3
and sequence 4). KM results are obtained by setting the number of germs from 4 to 50. The final number of regions depends on the number
of clusters but there is not a strict equivalence.
J. Da Rugna and H. Konik 7
1 5 10 15 20 25 30 35
Number of regions
0
0.2
0.4
0.6
0.8
1
OBC
KM
ooKM
(a)
1 5 10 15 20 25 30 35 40 45 50
Number of regions
0
0.2
0.4
0.6
0.8
1
OBC
KM
ooKM
(b)
Figure 8: Illustrations of the difficulty to reach the best deal between OBC optimization and number of regions in the object (sequence 3
and sequence 4). KM results are obtained by setting the number of germs from 4 to 50.
Figure 9: Examples of salient maps. The two first maps are com-
puted on the complete images. The last map is obtained by com-
puting saliency only on the red skier object.
As in the ooKM methodology, the soKM method (sali-
ent-oriented KM) consists in combining the extracted col-
ors through the saliency-map with the basic cluster seeds.
Algorithm 2 resumes the overall steps of this methodology.
3.2. Results
Regarding the previous conclusion using dominant colors,
lets compare now the results obtained with this saliency-
based approach. First of all, the global results will be pre-
sented, second the problem of overfitting will be reconsid-
ered, and finally the improvement according to the classical
mean-shift method will be shown.
Ta bl e 2 gives the average criterion on the four sequences
with ooKM versus soKM methods. For both criteria, the
soKM method is more efficient than ooKM, with a notice-
Green
Blue
Red
Figure 10: Principle of colors extraction based on saliency. After the
thresholding in three classes of the saliency map, peaks are extracted
on the color histogram with the previous algorithm to generate the
final colors.
Input: n frames F
i
and one object O
Output: Object-oriented segmentation of the n frames
map
← Salient-map of O
ObjSeeds
← Colors extraction computed on map
foreach frame F
i
ImgSeeds ← Extraction based on F
i
color partitioning
Seeds
← ImgSeeds ∪ObjSeeds
K-means segmentation of F
i
using Seeds
Algorithm 2: soKM algorithm.
able improvement of the stability. Indeed, if we consider the
sequence 4, where the difference between the criteria values
is the less important, the standard deviation is divided by 3
for OBC and Borsotti criteria. And the lower the deviation is,
the more stable the segmentation is expected to be.
Figures 12 and 13 illustrate obtained results initialized
with the object contained in frame 16: the overfitting prob-
lem is not present for the soKM method. Using saliency map
allows to initiate germs able to generalize the extracted col-
ors; in this point, classical dominant color method fails.
The improvement in injecting clusters based on salient
colors instead of dominant colors during the K-means algo-
rithm has been noticed in Ta bl e 2 . Compare our results with
the MS method [7] used recently in color image segmenta-
tion [22, 26]. While this quite general method is used without
similar prior information considered, we consider its large
using in the literature as a necessary benchmark reference.
8 EURASIP Journal on Image and Video Processing
Table 2: Comparative results ooKM versus soKM obtained with oriented approaches with test sequences. Average values and standard
deviations are given.
Criteria Borsotti OBC #N
Method ooKM soKM ooKM soKM ooKM soKM
Sequence 1 2.87 ± 2.42 0.56 ± 0.12 0.04 ± 0.01 0.01 ± 0.01 9 ± 3.1 9 ± 2.2
Sequence 2 0.06
± 0.02 0.04 ± 0.01 0.21 ± 0.17 0.12 ± 0.09 8 ± 0.5 8 ± 0.9
Sequence 3 0.33
± 0.09 0.28 ± 0.06 0.28 ± 0.11 0.15 ± 0.06 6 ± 0.7 6 ± 0.8
Sequence 4 0.96
± 0.47 0.82 ± 0.14 0.37 ± 0.23 0.26 ± 0.08 10 ± 1.1 10 ± 0.8
Table 3: Comparative results MS versus ooKM obtained with oriented approaches with test sequences. Average values and standard devia-
tions are given.
Criteria Borsotti OBC #N
Method MS soKM MS soKM MS soKM
Sequence 1 2.58 ± 0.34 0.56 ± 0.12 0.03 ± 0.01 0.01 ± 0.01 11 ± 1.2 9 ± 2.2
Sequence 2 0.14
± 0.01 0.04 ± 0.01 0.27 ± 0.14 0.12 ± 0.09 7 ± 0.5 8 ± 0.9
Sequence 3 0.99
± 0.18 0.28 ± 0.06 0.66 ± 0.08 0.15 ± 0.06 7 ± 0.8 6 ± 0.8
Sequence 4 1.36
± 0.68 0.82 ± 0.14 0.27 ± 0.26 0.26 ± 0.08 10 ± 1.4 10 ± 0.8
Figure 11: Some salient colors extraction examples. These colors
differ from the dominant colors in values as well as in number. As
expected, some retained colors are not present in majority but seem
to fit visual attractive colors.
120406080
Frames
0
0.2
0.4
0.6
0.8
1
Borsotti (normalized)
KM
ooKM
soKM
MS
Figure 12: Results of Borsotti criterion on sequence 4 with all seg-
mentation methods. The blue sky diver is taken from frame 16: in-
stead of ooKM method, the soKM one does not suffer from over-
fitting. MS method is not stable at the end of the sequence, where
object is really small and near, in colors, to the background, that is
the sky. In overall sequence, soKM gets best results in value and in
variation.
120 406080
Frames
0
0.2
0.4
0.6
0.8
1
Object-background confusion
(normalized)
KM
ooKM
soKM
MS
Figure 13: Results of OBC criterion on sequence 4 with all segmen-
tation methods. MS and soKM are comparable at the beginning of
the sequence but only the soKM method is efficient at the end of it.
The results given in Ta bl e 3 confirm the efficiency of our
soKM model. In fact, with similar number of regions, the
soKM algorithm always leads to better results as the MS one
for both criteria. Nevertheless, the MS algorithm is applied
on each frame without taking into account any color infor-
mation of the object.
Figures 14, 15, 16,and17 present the stability of our
method among the 4 selected entire sequences. In these
graphics, the nearer the data from (0, 0) are, the more effi-
cient the method is expected to be. Thus, we first retrieve the
previous results: soKM is the most stable and remains stable
on all sequences.
Finally, Figure 18 gives some visual results and illustrates
how the object influences the obtained segmentation. We
have extracted in Figure 18(a) two sky divers: a red one and a
J. Da Rugna and H. Konik 9
012345678
Borsotti
0
0.02
0.04
0.06
0.08
0.1
Object-background confusion
KM
ooKM
soKM
MS
Figure 14: Results of Borsotti versus OBC on sequence 1 with all
segmentation methods. This figure illustrates the stability of soKM
method compared to the 3 other methods. We also retrieve the good
behavior for the OBC criterion for method KM, nevertheless penal-
ized by a high Borsotti value.
00.025 0.05 0.075 0.10.125 0.15 0.175
Borsotti
0
0.1
0.2
0.3
0.4
0.5
0.6
Object-background confusion
KM
ooKM
soKM
MS
Figure 15: Results of Borsotti versus OBC on sequence 2 with all
segmentation methods. MS method suffers from the poor quality
of the sequence 2: KM and oriented KM methods seem more effi-
cient considering these few colors and low-resolution frames. For
the 4 methods the same behavior is present: on some frames, the
OBC values are strongly increased without the same behavior on the
Borsotti criteria. These frames correspond to the two boats crossing.
blue one. KM method gives on the red sky diver very poor re-
sults: the red color was not fitted correctly by a germ. The MS
segmentation seems visually correct on the two sky divers,
which was relatively expected for this method. However, the
best segmentations are obtained using the soKM method
in Figures 18(d) and 18(e). These examples also show how
much soKM is object oriented: the other object is absolutely
bad segmented.
4. CONCLUSION
In this paper, we have presented a new strategy to tune
the K-means algorithm for adaptive video segmentation.
This method is only the first low-level step of a more gen-
eral scheme of objects tracking in a context of content-
00.511.5
Borsotti
0
0.25
0.5
0.75
Object-background confusion
KM
ooKM
soKM
MS
Figure 16: Results of Borsotti versus OBC on sequence 3 with all
segmentation methods. ooKM and soKM reach quite same effi-
ciency except for some frames, these ones corresponding to the
“skier in shadow” event. MS seems again penalized by the few colors
contained in each frame.
00.511.522.5
Borsotti
0
0.25
0.5
0.75
Object-background confusion
KM
ooKM
soKM
MS
Figure 17: Results of Borsotti versus OBC on sequence 4 with all
segmentation methods. We retrieve previous results: MS and soKM
are quite comparable, but MS is no more efficient on some frames
(the end of the sequence).
enhancement called video clicking. In order to automatically
follow a desired object chosen by the user, each step of the
image processing must be optimized. Our response consists
then in using available a priori knowledge on it to constrain
the segmentation.
In addition to the first insufficient use of dominant col-
ors, we have introduced a saliency-based improvement of
K-means algorithm, where salient colors are coupled to pri-
mary clusters. The assessment used in this study on hetero-
geneous sequences (lighting conditions, view-point and ge-
ometry changes, etc.) has demonstrated a better efficiency of
this model. Its generalization ability implies a noticeably bet-
ter behavior both in quality and in robustness.
Currently, one static reference of the object is employed
over the whole sequence. It is desirable to update and learn
salient colors to adjust the model to sudden variations, which
is our future work.
10 EURASIP Journal on Image and Video Processing
(a) Extracted frame from sequence 4
(b) KM segmentation. The red
sky diver segmentation is not
good enough: many details have
been lost. Details seem respected
in other segmentation but a part
of the blue sky diver is combined
with the sky
(c) MS segmentation. Inversely at
theredskydiver,theblueoneis
badly segmented as many details
do not remain and a part of the
object is combined with the sky
(d) soKM, blue sky diver ori-
ented. Blue sky diver is visually
correctly segmented and correctly
separated from the sky. The red
one is segmented similar to KM
method
(e) soKM, red sky diver oriented.
Like the blue one oriented results
are efficient on the red sky diver.
Theblueskydiverisbadlyseg-
mented even far away from the
KM method
Figure 18: Some segmentation examples on a frame of sequence 4.
Two objects are considered: the red and the blue sky divers, in order
to well illustrate the constraining approach according to the desired
object.
ACKNOWLEDGMENT
This research was supported by the R
´
egion Rh
ˆ
one-Alpes,
project LIMA, cluster ISLE.
REFERENCES
[1] J. Bonaiuto and L. Itti, “The use of attention and spatial infor-
mation for rapid facial recognition in video,” Image and Vision
Computing, vol. 24, no. 6, pp. 557–563, 2006.
[2] M. Borsotti, P. Campadelli, and R. Schettini, “Quantita-
tive evaluation of color image segmentation results,” Pattern
Recognition Letters, vol. 19, no. 8, pp. 741–747, 1998.
[3] W. Cai, S. Chen, and D. Zhang, “Fast and robust fuzzy c-means
clustering algorithms incorporating local information for im-
age segmentation,” Pattern Recognition, vol. 40, no. 3, pp. 825–
838, 2007.
[4]H.D.Cheng,X.H.Jiang,Y.Sun,andJ.Wang,“Colorim-
age segmentation: advances and prospects,” Pattern Recogni-
tion, vol. 34, no. 12, pp. 2259–2281, 2001.
[5] H D. Cheng and Y. Sun, “A hierarchical approach to color im-
age segmentation using homogeneity,” IEEE Transactions on
Image Processing, vol. 9, no. 12, pp. 2071–2082, 2000.
[6] A. Colombari, A. Fusiello, and V. Murino, “Segmentation
and tracking of multiple video objects,” Pattern Recognition,
vol. 40, no. 4, pp. 1307–1317, 2007.
[7] D. Comaniciu and P. Meer, “Mean shift: a robust approach
toward feature space analysis,” IEEE Transactions on Pattern
Analysis and Machine Intelligence, vol. 24, no. 5, pp. 603–619,
2002.
[8] G. Heidemann, “Region saliency as a measure for colour seg-
mentation stability,” Image and Vision Computing, vol. 26,
no. 2, pp. 211–227, 2008.
[9] L. Itti and C. Koch, “A saliency-based search mechanism for
overt and covert shifts of visual attention,” Vision Research,
vol. 40, no. 10-12, pp. 1489–1506, 2000.
[10] B K. Jeon, Y B. Jung, and K S. Hong, “Image segmentation
by unsupervised sparse clustering,” Pattern Recognition Letters,
vol. 27, no. 14, pp. 1650–1664, 2006.
[11] J. Jiang, Y. Weng, and P. Li, “Dominant colour extraction in
DCT domain,” Image and Vision Computing, vol. 24, no. 12,
pp. 1269–1277, 2006.
[12] Y. Liu, D. Zhang, G. Lu, and W Y. Ma, “A survey of content-
based image retrieval with high-level semantics,” Pattern
Recognition, vol. 40, no. 1, pp. 262–282, 2007.
[13] R. Lukac and K. N. Plataniotis, Color Image Processing: Meth-
ods and Applications, CRC Press, Boca Raton, Fla, USA, 2007.
[14] J. Luo and C E. Guo, “Perceptual grouping of segmented re-
gions in color images,” Pattern Recognition, vol. 36, no. 12, pp.
2781–2792, 2003.
[15] J. M. Martinez, R. Koenen, and F. Pereira, “MPEG-7: the
generic multimedia content description standard, part 1,”
IEEE Multimedia, vol. 9, no. 2, pp. 78–87, 2002.
[16] A. Ortiz and G. Oliver, “On the use of the overlapping area
matrix for image segmentation evaluation: a survey and new
performance measures,” Pattern Recognition Letters, vol. 27,
no. 16, pp. 1916–1926, 2006.
[17] N. Ouerhani, R. von Wartburg, H. Hugli, and R. Muri, “Em-
pirical validation of the saliency-based model of visual atten-
tion,” Computer Vision and Image Analysis,vol.3,no.1,pp.
13–24, 2004.
[18] M. Ozden and E. Polat, “A color image segmentation approach
for content-based image retrieval,” Pattern Recognition, vol. 40,
no. 4, pp. 1318–1325, 2007.
[19] L. Peihua, “A clustering-based color model and integral images
for fast object tracking,” Signal Processing: Image Communica-
tion, vol. 21, no. 8, pp. 676–687, 2006.
[20] L. Pi, C. Shen, F. Li, and J. Fan, “A variational formulation for
segmenting desired objects in color images,”
Image and Vision
Computing, vol. 25, no. 9, pp. 1414–1421, 2007.
[21] P. Salembier and T. Sikora, Introduction to MPEG-7: Multi-
media Content Description Interface., John Wiley & Sons, New
York, NY, USA, 2002.
[22] R. Unnikrishnan, C. Pantofaru, and M. Hebert, “Toward ob-
jective evaluation of image segmentation algorithms,” IEEE
Transactions on Pattern Analysis and Machine Intelligence,
vol. 29, no. 6, pp. 929–944, 2007.
[23] H. Veeraraghavan, P. Schrater, and N. Papanikolopoulos, “Ro-
bust target detection and tracking through integration of mo-
tion, color, and geometry,” Computer Vision and Image Under-
standing, vol. 103, no. 2, pp. 121–138, 2006.
J. Da Rugna and H. Konik 11
[24] H. Wang and D. Suter, “A consensus-based method for track-
ing: modelling background scenario and foreground appear-
ance,” Pattern Recognition, vol. 40, no. 3, pp. 1091–1105, 2007.
[25] Y. Wang, K F. Loe, T. Tan, and J K. Wu, “Spatiotemporal
video segmentation based on graphical models,” IEEE Trans-
actions on Image Processing, vol. 14, no. 7, pp. 937–947, 2005.
[26] Y. Wang, J. Yang, and N. Peng, “Unsupervised color-texture
segmentation based on soft criterion with adaptive mean-shift
clustering,” Pattern Recognition Letters, vol. 27, no. 5, pp. 386–
392, 2006.
[27] A. v. Wangenheim, R. F. Bertoldi, D. D. Abdala, and M. M.
Richter, “Color image segmentation guided by a color gradient
network,” Pattern Recognition Letters, vol. 28, no. 13, pp. 1795–
1803, 2007.
[28] N. Yang, C. M. Kuo, W. Chang, and T. Li, “A fast MPEG-7
dominant color extraction with new similarity measure for
image retrieval,” Journal of Visual Communication and Image
Representation, vol. 19, no. 2, pp. 92–105, 2008.