Báo cáo hóa học: " Research Article Compression at the Source for Digital Camcorders" docx
Bạn đang xem bản rút gọn của tài liệu. Xem và tải ngay bản đầy đủ của tài liệu tại đây (1.49 MB, 11 trang )
Hindawi Publishing Corporation
EURASIP Journal on Advances in Signal Processing
Volume 2007, Article ID 24106, 11 pages
doi:10.1155/2007/24106
Research Article
Compression at the Source for Digital Camcorders
Nir Maor,
1
Arie Feuer,
1
and Graham C. Goodwin
2
1
Department of Electrical Engineering (EE), Technion-Israel Institute of Technology, Haifa 32000, Israel
2
School of Electrical Engineering and Computer Science, University of Newcastle, Callaghan NSW 2308, Australia
Received 2 October 2006; Accepted 30 March 2007
Recommended by Russell C. Hardie
Typical sensors (CCD or CMOS) used in home digital camcorders have the potential of generating high definition (HD) video
sequences. However, the data read out rate is a bottleneck which, invariably, forces significant quality deterioration in recorded
video clips. This paper describes a novel technology for achieving a better utilization of sensor capabilit y, resulting in HD quality
video clips with esentially the same hardware. The technology is based on the use of a particular type of nonuniform sampling
strategy. This strategy combines infrequent high spatial resolution frames with more frequent low resolution frames. This combi-
nation allows the data rate constraint to be achieved while retaining an HD quality output. Post processing via filter banks is used
to combine the high and low spatial resolution frames to produce the HD quality output. The paper provides full details of the
reconstruction algorithm as well as proofs of all key supporting theories.
Copyright © 2007 Nir Maor et al. This is an open access article distributed under the Creative Commons Attribution License,
which permits unrestricted use, distribution, and reproduction in any medium, provided the or iginal work is properly cited.
1. INTRODUCTION: CURRENT TECHNOLOGY
In many digital systems, one faces the problem of having a
source which generates data at a rate higher than that which
can be transmitted over an associated communication chan-
nel. As a consequence, some means of compression are re-
quired at the source. A specific case of this problem arises in
the current technology of digital home camcorders.
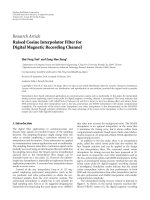
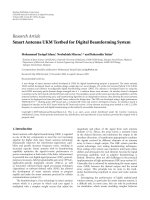
Figure 1 shows a schematic diagram of a typical digital
camcorder. Images are captured on a two-dimensional sen-
sor array (either CCD or CMOS). Each sensor in the array
gives a spatial sample of the continuous image, a pixel, and
the whole array gives a temporal sample of the time-varying
image, a frame. The result is a 3D sampling process of a signal
having two spatial dimensions and one temporal dimension.
A hard constraint on the spatial resolution in each frame is
determined by the number of sensors in the sensor array,
while a hard constraint on the frame rate is determined by
the minimum exposure time required by the sensor tech-
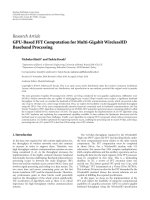
nology. The result is a uniformly sampled digital video se-
quence which perfectly captures a time-varying image whose
spectrum is bandlimited to a box as shown in Figure 2.We
note that the cross-sectional area of the box depends on the
spatial resolution constraint, while the other dimension of
the box depends on the maximal frame rate. As it turns out,
the spectrum of typical time-varying images can reasonably
be assumed to be contained in this box. Thus, the sensor
technology of most home digital camcorders can, in prin-
ciple, generate video of high quality (high definition).
However, in current sensor technology, there is a third
hard constraint, namely, the rate at which the data from the
sensor can be read. This turns out to be the dominant con-
straint since this rate is typically lower than the rate of data
generated by the sensor. Thus, downsampling (either spa-
tially and/or temporally) is necessary to meet the read out
constraint. In current technology, this downsampling is done
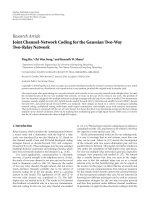
uniformly. The result is a uniformly sampled digital video se-
quence (see Figure 1) which can perfectly capture only those
scenes which have a spectrum limited to a box of consider-
ably smaller dimensions. This is illustrated in Figure 3 where
the box in dashed lines represents the full sensor capability
and the solid box represents the reduced capability resulting
from the use of uniform downsampling. The end result is
quite often unsatisfactory due to the associated spatial and/or
temporal information loss.
With the above as background, the question addressed in
the current paper is whether a different compression mecha-
nism can be utilized, which will lead to significantly less in-
formation loss. We show, in the sequel, that the technology
we present achieves this goal. An important point is that the
new mechanism does not require a new sensor array, but,
instead, achieves a better utilizat ion of existing capabilities.
The idea thus yields resolution gains without requiring ma-
jor hardware modification. (The core idea is the subject of
2 EURASIP Journal on Advances in Signal Processing
TG
Memory
Display
(TV or LCD)
Image
processing
pipeline
Image
sensor
Time
varying
scene
Uniformly
sampled
video
sequence
Figure 1: Schematics diagram of a typical digital camcorder.
ω
t
ω
x
ω
y
Proportional to maximal
sensor resolution
Proportional to maximal
frame rate
Figure 2: Sensor array potential capacity.
a recent patent application by a subset of the current au-
thors [1].)
Previous relevant work includes the work done by
Shechtman et al. [2]. In the latter paper, the authors use
a number of camcorders recording the same scene, to
overcome single camcorder limitations. Some of these cam-
corders have high spatial resolution but slow frame rate and
others have reduced spatial resolution but high frame rate.
The resulting data is fused to generate a single high quality
video sequence (with high spatial resolution and fast frame
rate). This approach has limited practical use because of the
use of multiple camcorders. Also, the idea involves some
technical difficulties such as the need to perform registration
of the data from the different camcorders. The idea described
in the current paper avoids these difficulties.
The layout of the remainder of the paper is as follows: in
Section 2 we describe the spectral properties of typical v ideo
clips. This provides the basis for our approach as presented in
Section 3. Note that we describe our approach both heuris-
tically and formally. In Section 4 we present experimental
ω
t
ω
x
ω
y
Actual data
rate transferred
Figure 3: Digital camcorder actual capacity.
ω
t
ω
x
|I(ω
x
,0,ω
t
)|
Figure 4: 3D spectrum of a typical video clip (shows only the ω
t
and ω
x
axes).
results using our approach. Finally, in Section 5 we provide
conclusions.
2. VIDEO SPECTRAL PROPERTIES
The technology that we present here is based on the premise
that the data read out rate, or equivalently, the volume in
Figure 3, is a hard constraint. We deal with this constraint
by modify ing the downsampling scheme (data compression)
so as to better fit the characteristics of the data. We do this by
appropriate use of nonuniform sampling so as to avoid the
redundancy inherent in uniform sampling. Background to
this idea is contained in [3] which discusses the potential re-
dundancy frequently associated with uniform sampling (see
also [4]).
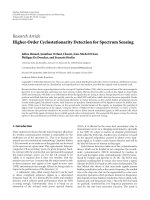
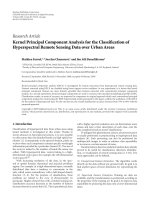
To support our idea we have conducted a thorough study
of the spectral properties of over 150 typical video clips. To
illustrate our findings, we show the spectrum of one of these
clips in Figure 4. (We show only one of the spatial frequency
axes with similar results for the second spatial frequency.)
We note in this figure that the spectral energy is concentrated
Nir Maor et al. 3
ω
t
ω
x
ω
y
Figure 5: Spectral support shape of video clips.
around the spatial frequency plane and the temporal frequency
axis. This characteristic is common to all clips studied. We
will see in the sequel that this observation is, indeed, the cor-
nerstone of our method.
To further support our key observation, we passed a large
number of video clips through three ideal lowpass filters hav-
ing spectral support of a fixed volume but different shapes.
The first and second filters had a box-like support represent-
ing either uniform spatial or temporal decimation. A third
filter had the more intricate shape shown in Figure 5.The
outputs of these filters were compared both quantitatively
(using PSNR) and qualitatively (by viewing the video clips)
to the original input clip. On average, the third filter pro-
duced a 10 dB advantage over the other two. In all cases ex-
amined, the qualitative comparisons were even more favor-
able than suggested by the quantitative comparison. Full de-
tails of the study are presented in [5]. Our technology (as
will be shown in the sequel) can accommodate more intri-
cate shapes which may constitute a better fit to actual spec-
tral supports. Indeed, we are currently experimenting with
the dimensions and shape of the filter support as illustrated
in Figure 5 to better fit the “foot print” of typical video spec-
tra (see also Remark 2).
3. NONUNIFORMLY SAMPLED VIDEO
3.1. Heuristic explanation of the sampling strategy
By examining the spectral properties of typical video clips,
as described in the previous section, we have observed that
there is hardly any information which has simultaneously
both high spatial and high temporal frequencies. This ob-
servation leads to the intuitive idea of interweaving a combi-
nation of two sequences: one of high spatial resolution but
slow frame rate and a second with low spatial resolution
but high frame rate. The result is a nonuniformly sampled
video sequence as schematically depicted in Figure 6.Note
that there is a time gap inserted fol lowing each of the high
resolution frames since these frames require more time to
be read out (see Remark 3). In the remainder of the paper,
we will formal ly prove that sampling schemes of the type
shown in Figure 6 do indeed allow perfect reconstruction of
Δx
Δy
(2N +1)Δy
(2N +1)Δx
Frame type A Frame type B
t
(2M
1
+1)Δt
(2M
2
+1)Δt Δt
Figure 6: Nonuniformly sampled video sequence.
signals which have a frequency domain “footprint” of the
type shown in Figure 5.
3.2. Perfect reconstruction from nonuniform
sampled data
To develop the associated theoretical results, we will utilize
ideas related to sampling lattices. For background on these
concepts the reader is referred to [3, 6, 7]. A central tool in
our discussion will be the mulitdimensional generalized sam-
pling expansion (GSE). For completeness, we have included a
brief (without proofs) exposition of the GSE in Appendix A.
A more detailed discussion can be found in, for example,
[3, 8, 9].
In the sequel, we will first demonst rate that the sam-
pling pattern used (see Figure 6)isaformofrecurrentsam-
pling. We will then employ the GSE tool. In particular, we
will utilize the idea that perfect reconstruction from a re-
current sampling is possible if the sampling pattern and the
signal spectral support are such that the resulting matrix H
(see (A. 24)inAppendix A) is nonsingular. Specifically, we
will show that the sampling pattern in Figure 6 allows per-
fect reconstruction of signals having spectral support as in
Figure 5.
To simplify the presentation we will consider only the
case where one of the spatial dimensions is affected while
the other spatial dimension is untouched during the pro-
cess (namely, it has the full available spatial resolution of
the sensor array). The extension to the more general case is
straightforward but involves more complex notation. Thus,
we will examine a sampling pattern of the type shown in
Figure 7. Furthermore, to simplify notation, we let z
= [
x
t
].
We also use Δx and Δt to represent full spatial and temporal
resolution. However, we note that the use of these sampling
intervals in a uniform pattern would lead to a data r ate that
could not be read off the sensor array.
4 EURASIP Journal on Advances in Signal Processing
Δt
Δx
x
t
Figure 7: The nonuniform sampling pattern considered.
Also, to make the presentation easier, we will ignore the
extra time interval after the high resolution frames as shown
in Figure 5. (See also Remark 3.) More formally, we consider
the sampling lattice
LAT ( T)
=
Tn : n ∈ Z
2
,(1)
where
T
=
(2L +1)Δx 0
0(2M +1)Δt
. (2)
In each unit cell of this lattice we add 2(L + M)samples
Δx
0
2L
=1
0
mΔt
2M
m
=1
(3)
to obtain the sampling pattern
Ψ
=
2(L+M)+1
q=1
LAT ( T)+z
q
,(4)
where
z
q
=
⎧
⎪
⎪
⎪
⎪
⎪
⎪
⎪
⎪
⎪
⎪
⎪
⎪
⎪
⎪
⎪
⎨
⎪
⎪
⎪
⎪
⎪
⎪
⎪
⎪
⎪
⎪
⎪
⎪
⎪
⎪
⎪
⎩
0,forq = 1,
⎡
⎣
(q − 1)Δx
0
⎤
⎦
,forq = 2, ,2L +1,
⎡
⎣
0
(q
− 2L − 1)Δt
⎤
⎦
,forq = 2(L +1), ,
2(L + M)+1.
(5)
As shown in Appendix A this constitutes a recurrent sam-
pling pattern. Moreover, we readily observe that this is ex-
actly the sampling pattern portrayed in Figure 7 (for L
= 2
and M
= 3). (Note that, for these values, every seventh frame
has full resolution while, in the low resolution frames, only
every fifth line is read.) The unit cell we consider for the re-
ciprocal lattice, LAT (2πT
−T
) ={2πT
−T
n : n ∈ Z
2
},is
UC
2πT
−T
=
ω :
ω
x
<
π
(2L +1)Δx
,
ω
t
<
π
(2M +1)Δt
.
(6)
Unit cell
ω
x
π
Δt
π
Δx
π
(2L +1)Δt
−
π
Δx
−
π
Δt
π
(2L +1)Δx
−
π
(2L +1)Δx
−
π
(2L +1)Δt
Figure 8: Unit cell of reciprocal lattice.
This is illustrated in Figure 8. (Note that the dashed box
in the figure represents the sensor data generation capacity
which, as previously noted, exceeds the data transition capa-
bility.) We next construct the set
S
=
2(L+M)+1
p=1
UC
2πT
−T
+ c
p
,(7)
where
c
p
=
⎧
⎪
⎪
⎪
⎪
⎪
⎪
⎪
⎪
⎪
⎪
⎪
⎪
⎪
⎪
⎪
⎪
⎪
⎪
⎪
⎪
⎪
⎪
⎪
⎪
⎪
⎪
⎪
⎪
⎪
⎪
⎪
⎪
⎪
⎪
⎪
⎪
⎪
⎪
⎪
⎨
⎪
⎪
⎪
⎪
⎪
⎪
⎪
⎪
⎪
⎪
⎪
⎪
⎪
⎪
⎪
⎪
⎪
⎪
⎪
⎪
⎪
⎪
⎪
⎪
⎪
⎪
⎪
⎪
⎪
⎪
⎪
⎪
⎪
⎪
⎪
⎪
⎪
⎪
⎪
⎩
0,forp = 1,
⎡
⎢
⎣
2π(p − 1)
(2L +1)Δx
0
⎤
⎥
⎦
,forp = 2, , L +1,
⎡
⎢
⎣
2π(L +1− p)
(2L +1)Δx
0
⎤
⎥
⎦
,forp = L +2, ,2L +1,
⎡
⎢
⎣
0
2π(p
− 2L − 1)
(2M +1)Δt
⎤
⎥
⎦
,forp = 2L +2, ,
2L + M +1,
⎡
⎢
⎣
0
2π(2L + M +1
− p)
(2M +1)Δt
⎤
⎥
⎦
,forp = 2L + M +2, ,
2(L + M)+1.
(8)
This set is illustrated in Figure 9. We observe that the set in
Figure 9 is, in fact, a cross-section of the set in Figure 5 (at
ω
y
= 0). We are now ready to state our main technical result.
Theorem 1. Let I(z) be a signal bandlimited to the set S as
given in (7) and let this sig nal be sampled on Ψ as given in (4).
Nir Maor et al. 5
Then, I(z) canbeperfectlyreconstructedfromthesampleddata
{I(z)}
z∈Ψ
.
Proof. See Appendix B.
Theorem 1 establishes our key claim, namely, that per-
fect reconstruction is indeed possible using the proposed
nonuniform sampling pattern. We next give an explicit form
for the reconstruction.
Theorem 2. WithassumptionsasinTheorem 1,perfectsignal
reconstruction can be achieved using
I(z)
=
n∈Z
2
2(L+M)+1
q=1
I
Tn + z
q
ϕ
q
(z−Tn), (9)
where ϕ
q
(z) has the form
ϕ
1
(z)=
⎡
⎢
⎢
⎢
⎣
1
2L +1
+
1
2M +1
−1
+
1
2L +1
2sin
πLx
(2L +1)Δx
cos
π(L +1)x
(2L +1)Δx
sin
πx
(2L +1)Δx
+
1
2M +1
2sin
πMt
(2M +1)Δt
cos
π(M +1)t
(2M +1)Δt
sin
πt
(2M +1)Δt
⎤
⎥
⎥
⎥
⎦
×
sin
πx
(2L +1)Δx
πx
(2L +1)Δx
sin
πt
(2M +1)Δt
πt
(2M +1)Δt
,
ϕ
q
(z) =
⎧
⎪
⎪
⎪
⎪
⎪
⎪
⎪
⎪
⎪
⎪
⎪
⎪
⎪
⎪
⎪
⎪
⎪
⎪
⎪
⎪
⎪
⎪
⎪
⎪
⎪
⎪
⎪
⎨
⎪
⎪
⎪
⎪
⎪
⎪
⎪
⎪
⎪
⎪
⎪
⎪
⎪
⎪
⎪
⎪
⎪
⎪
⎪
⎪
⎪
⎪
⎪
⎪
⎪
⎪
⎪
⎩
sin
π
Δx
x − (q − 1)Δx
π
Δx
x − (q − 1)Δx
sin
πt
(2M +1)Δt
πt
(2M +1)Δt
,
for q
= 2, ,2L +1,
sin
πx
(2L+1)Δx
πx
(2L +1)Δx
sin
π
Δt
t−(q−2L−1)Δt
π
Δt
t − (q − 2L − 1)Δt
,
for q
= 2(L +1), ,2(L + M)+1.
(10)
Proof. See Appendix C.
ω
t
ω
x
π
Δt
π
Δx
−
π
Δx
−
π
Δt
Figure 9: The spectrum covering set S.
The reconstruction formula (9)canberewrittenas
I(z)
=
n∈Z
2
2(L+M)+1
q=1
I
q
(Tn)ϕ
q
(z−Tn)
=
2(L+M)+1
q=1
I
q
(z)
n∈Z
2
δ(z−Tn)
∗
ϕ
q
(z)
=
2(L+M)+1
q=1
I
d
q
(z) ∗ ϕ
q
(z),
(11)
where I
q
(z) = I(z + z
q
) is the original continuous signal
shifted by z
q
and I
d
q
(z) = I
q
(z)
n∈Z
2
δ(z−Tn)isits(im-
pulse) sampled version (on the lattice LAT (T)). We see that
the reconstruction can be viewed as having 2(L + M)+1
signals, each passing through a filter with impulse response
ϕ
q
(z). The outputs of these filters are then summed to pro-
duce the final result. A further embellishment is possible
on noting that, in practice, we are usually not interested
in achieving a continuous final result of the type described
above. Rather, we w ish to generate a high resolution, uni-
formly sampled video clip which can be fed into a digital high
resolution display device. Specifically, say that we are inter-
ested in obtaining samples on the lattice
{I(T
1
)}
m∈Z
2
,where
T
1
=
Δx 0
0 Δt
. (12)
Note that LAT (T)isastrictsubsetofLAT (T
1
). Thus,
our goal is to convert the nonuniformly sampled data to a
(high resolution) uniformly sampled data. This can be di-
rectly achieved by utilizing (11). Specifically, from (11), we
obtain
I
T
1
m
=
2(L+M)+1
q=1
k∈Z
2
I
q
T
1
k
ϕ
q
T
1
(m − k)
(13)
6 EURASIP Journal on Advances in Signal Processing
··· ··· ··· ··· ···
.
.
.
.
.
.
I
1
(Tn)
I
1L−1
(Tn)
I
2(L−1)
(Tn)
I
2(L−1)−1
(Tn)
↑R
↑R
↑R
↑R
ϕ
1
ϕ
2(L−1)
ϕ
2L−1
ϕ
2(L−N)−1
.
.
.
.
.
.
Figure 10: The reconstruction process.
Figure 11: Alternative spectral covering set.
which is the discrete equivalent of (11).
I
q
(T
1
k) denotes the
zero-padded (interpolated) version of I
q
(Tn).(Thisiseasily
seen since LAT (T)
⊂ LAT (T
1
).) This process is illustrated
in Figure 10.
Remark 1. The compression achieved by the use of the spe-
cific sampling patterns and spectral covering sets described
aboveisgivenby
α
=
2(L + M)+1
(2L + 1)(2M +1)
. (14)
Remark 2. Heuristically, we could achieve even greater com-
pression by using more detailed information about typical
video spectral “footprints.” Ongoing work is aimed at finding
nonuniform sampling patterns which apply to more general
spectral covering sets. Figure 11 illustrates a possible spectral
“footprint.”
Remark 3. As noted earlier, we have assumed in the above
development that a fixed time interval is used between all
frames. This was done for the ease of exposition. A paral-
lel derivation for the case when these intervals are not equal
(as in Figure 6) has been carried out and is presented in [5].
Indeed, this more general scheme was used in all our experi-
ments.
Figure 12: Frames from original clip.
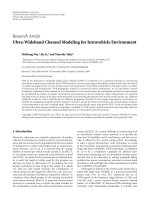
4. EXAMPLE
To illustrate the potential benefits of our approach we chose
a clip consisting of 320 by 240 pixels per frame at 30 frames
per second—Figure 12 shows six frames out of this clip. The
pixel rate of this clip is 2304000 pixels per second. We create
a nonuniformly sampled sequence by using the methods de-
scribed in Section 3 with L
= M = 2. The resulting compres-
sion ratio is (see (14)) 9/25. The reconstruction functions in
this case are
ϕ
1
(z) = 5
⎡
⎢
⎢
⎣
−
3+
2sin
2πx
5Δx
cos
3πx
5Δx
sin
πx
5Δx
+
2sin
2πt
5Δt
cos
3πt
5Δt
sin
πt
5Δt
⎤
⎥
⎥
⎦
×
sin
πx
5Δx
πx
Δx
sin
πt
5Δt
πt
Δt
,
ϕ
q
(z) =
sin
π
x − (q − 1)Δx
Δx
π
x − (q − 1)Δx
Δx
sin
πt
5Δt
πt
5Δt
,forq
= 2, 3, 4, 5,
ϕ
q
(z) =
sin
πx
5Δx
πx
5Δx
sin
π
t − (q − 5)Δt
Δt
π
t − (q − 5)Δt
Δt
,forq
= 6, 7, 8, 9.
(15)
Figures 13 and 14 show ϕ
1
(z)andϕ
5
(z). Using these
functions we have reconstructed the clip. Figure 15 shows
the reconstructed frames corresponding to the frames in
Figure 12. We observe that the reconstructed frames are al-
most identical (both spatially and temporally) to the frames
from the original clip.
Nir Maor et al. 7
−1
4
2
4
−2
1
0
−2
5
t
x
−4
2
4
Figure 13: ϕ
1
(z).
0.5
0
x
1
2
4
2
4
−2
−4
−2
−4
Figure 14: ϕ
5
(z).
To illustrate that our method offersadvantagesrelative
to other str ateg ies, we also tested uniform spatial decimation
achieved by removing , in all frames, 3 out of every 5 columns.
This results in a compression ratio of ∼0.4 (>9/25). While
the compression ratio is larger (less compression), the result-
ing clip is of significantly poorer quality as can be seen in
the frames of Figure 16. We also applied temporal decima-
tion by removing 3 out of every 5 frames resulting again in a
compression ratio of 0.4. Temporal interpolation was then
used to fill up the missing frames. The results are show n
in Figure 17. We note that the reconstructed motion differs
from the original one (see fourth and sixth frames from the
left).
5. CONCLUSIONS
This paper has addressed the problem of under utilization
of sensor capabilities in digital camcorders arising from con-
strained data read out rate. Accepting the data read out
rate as a hard constraint of a camcorder, it has been shown
that, by gener ating a nonuniformly sampled digital video se-
quence, it is possible to generate improved resolution video
clips with the same read out rate. The approach presented
here utilizes prior information regarding the “footprint” of
typical video clip spectra. Specifically, we have exploited the
observation that high spatial frequencies seldom occur si-
multaneously with high temporal frequencies. Reconstruc-
tion of an improved resolution (both spatial and temporal)
digital video clip from the nonuniform samples has been pre-
sented in a form of a filter bank.
Figure 15: Frames from reconstructed clip.
Figure 16: Frames from the spatially decimated clip.
Figure 17: Frames from the temporally decimated clip.
APPENDICES
A. MULTIDIMENSIONAL GSE
A.1. General
Consider a bandlimited signal f (z), z
∈ R
D
, and a sampling
lattice LAT (T). Assume that LAT (T) is not a Nyquist lat-
tice for f (z), namely, the signal cannot be reconstructed from
its samples on this lattice. Let UC (2πT
−T
) be a unit cell for
the reciprocal lattice LAT (2πT
−T
). Then, there always ex-
ists a set of points
{c
p
}
P
p
=1
⊂ LAT (2πT
−T
) such that
support
f (ω)
⊂
P
p=1
UC
2πT
−T
+ c
p
. (A. 16)
Suppose now that the signal is passed through a bank of shift-
invariant filters
{
h
q
(ω)}
Q
q
=1
and the filter outputs f
q
(z)are
then sampled on the given lattice to generate the data set
{ f
q
(Tn)}
n∈Z
D
, q=1, ,Q
. We then have the following result.
Theorem 3. The signal f (z),underassumption(A. 16),can
bereconstructedfromthedataset
{ f
q
(Tn)}
n∈Z
D
, q=1, ,Q
if and
only if the matrix
H (ω)
=
⎡
⎢
⎢
⎢
⎢
⎢
⎣
h
1
ω + c
1
h
2
ω + c
1
···
h
Q
ω + c
1
h
1
ω + c
2
h
2
ω + c
2
···
h
Q
ω + c
2
.
.
.
.
.
.
.
.
.
.
.
.
h
1
ω + c
P
h
2
ω + c
P
···
h
Q
ω + c
P
⎤
⎥
⎥
⎥
⎥
⎥
⎦
∈ C
P×Q
(A. 17)
has full row rank for all ω
∈ UC(2πT
−T
).Thereconstruction
formula is given by
f (z)
=
Q
q=1
n∈Z
D
f
q
(Tn)ϕ
q
(z−Tn), (A. 18)
8 EURASIP Journal on Advances in Signal Processing
where
ϕ
q
(z) =
|
det T|
(2π)
D
UC(2πT
−T
)
Φ
q
(ω, z)e
jω
T
z
dω (A. 19)
and where Φ
q
(ω, z) are the solutions of the following set of lin-
ear equations:
H (ω)
⎡
⎢
⎢
⎢
⎢
⎣
Φ
1
(ω, z)
Φ
2
(ω, z)
.
.
.
Φ
Q
(ω, z)
⎤
⎥
⎥
⎥
⎥
⎦
=
⎡
⎢
⎢
⎢
⎢
⎢
⎣
e
jc
T
1
z
e
jc
T
2
z
.
.
.
e
jc
T
P
z
⎤
⎥
⎥
⎥
⎥
⎥
⎦
. (A. 20)
A.2. Perfec t reconstruction from recurrent sampling
The above GSE result can be applied to reconstruction from
recurrent sampling. By recurrent sampling we refer to a sam-
pling pattern Ψ given by
Ψ
=
Q
q=1
LAT ( T)+z
q
, (A. 21)
where, w.l.o.g. we assume that
{z
q
}⊂UC(T). (Otherwise,
one can redefine them as z
q
− Tn
q
∈ UCT(T)andΨ will
remain the same.) The data set we have is
{ f (z)}
z∈Ψ
and our
goal is to perfectly reconstruct f (z).
Let us define
h
q
(ω) = e
jω
T
z
q
, then f
q
(z) = f (z + z
q
)and
f
q
(Tn)
n∈Z
D
, q=1, ,Q
=
f (z)
z∈Ψ
. (A. 22)
Thus, we can apply the GSE reconstruction. In the current
case
H (ω)
=
⎡
⎢
⎢
⎢
⎢
⎢
⎣
e
j(ω+c
1
)
T
z
1
e
j(ω+c
1
)
T
z
2
··· e
j(ω+c
1
)
T
z
Q
e
j(ω+c
2
)
T
z
1
e
j(ω+c
2
)
T
z
2
··· e
j(ω+c
2
)
T
z
Q
.
.
.
.
.
.
.
.
.
.
.
.
e
j(ω+c
P
)
T
z
1
e
j(ω+c
P
)
T
z
2
··· e
j(ω+c
P
)
T
z
Q
⎤
⎥
⎥
⎥
⎥
⎥
⎦
=
H · diag
e
jω
T
z
1
, , e
jω
T
z
Q
,
(A. 23)
where
H
=
⎡
⎢
⎢
⎢
⎢
⎢
⎣
e
jc
T
1
z
1
e
jc
T
1
z
2
··· e
jc
T
1
z
Q
e
jc
T
2
z
1
e
jc
T
2
z
2
··· e
jc
T
2
z
Q
.
.
.
.
.
.
.
.
.
.
.
.
e
jc
T
P
z
1
e
jc
T
P
z
2
··· e
jc
T
P
z
Q
⎤
⎥
⎥
⎥
⎥
⎥
⎦
∈ C
P×Q
. (A. 24)
Note that the matrix diag
{e
jω
T
z
1
, , e
jω
T
z
Q
} is always
nonsingular, hence, by Theorem 3, perfect reconstruction is
possible if and only if H has full row rank. Clearly, a necessary
condition is Q
≥ P. For simplicity, one often uses Q = P.
B. PROOF OF THEOREM 1
The sampling pattern described in (4)isclearlyarecurrent
sampling pattern. We can thus apply the result of Theorem 3.
As the discussion in Appendix A.2 concludes, all we need to
show is that the matrix H in (A. 24)isnonsingular.Wenote
thatherewehaveQ
= P = 2(L + M) + 1. By the definitions
of
{z
q
}
2(L+M)+1
q
=1
and {c
p
}
2(L+M)+1
p
=1
in (4)and(8), respectively,
we observe that the resulting matrix H can be written as
H
=
⎡
⎣
1 1
T
2(L+M)
1
2(L+M)
H
⎤
⎦
, (A. 25)
where 1
P
denotes a P-dimensional vector of ones and
H =
⎡
⎣
A 1
2L
1
T
2M
1
2M
1
T
2L
B
⎤
⎦
, (A. 26)
A
p,q
=
⎧
⎪
⎪
⎪
⎪
⎪
⎪
⎨
⎪
⎪
⎪
⎪
⎪
⎪
⎩
e
j(2π/(2L+1))qp
,
for p
= 1, 2, , L,
e
j(2π/(2L+1))q(L−p)
,
for p
= L +1,2, ,2L,
q
= 1, 2, ,2L
(A. 27)
B
p,q
=
⎧
⎪
⎪
⎪
⎪
⎪
⎪
⎨
⎪
⎪
⎪
⎪
⎪
⎪
⎩
e
j(2π/(2M+1))qp
,
for p
= 1, 2, , M,
e
j(2π/(2M+1))q(M−p)
,
for p
= M +1,2, ,2M,
q
= 1, 2, ,2M.
(A. 28)
From (A. 25) we can readily show that
H
−1
=
1+1
T
2(L+M)
H − 1
2(L+M)
1
T
2(L+M)
−1
1
2(L+M)
−
H − 1
2(L+M)
1
T
2(L+M)
−1
1
2(L+M)
− 1
T
2(L+M)
H − 1
2(L+M)
1
T
2(L+M)
−1
×
H − 1
2(L+M)
1
T
2(L+M)
−1
.
(A. 29)
Hence, H
−1
exists if and only if (
H −1
2(L+M)
1
T
2(L+M)
)
−1
exists.
Using (A. 26)wecanwrite(A. 27)and(A. 28)as
H − 1
2(L+M)
1
T
2(L+M)
−1
=
⎡
⎣
A − 1
2L
1
T
2L
−1
0
0
B − 1
2M
1
T
2M
−1
⎤
⎦
.
(A. 30)
Hence, we need to establish that (A
− 1
2L
1
T
2L
)
−1
and (B −
1
2M
1
T
2M
)
−1
exist. Using the definitions of A and B in (A. 27)
and (A. 28) we can readily show that
A
H
A = AA
H
= (2L +1)I
2L
− 1
2L
1
T
2L
,
B
H
B = BB
H
= (2m +1)I
2M
− 1
2M
1
T
2
,
(A. 31)
A1
2L
= A
H
1
2L
=−1
2L
,
B1
2M
= B
H
1
2M
=−1
2M
,
(A. 32)
Nir Maor et al. 9
where (·)
H
denotes the transpose conjugate of (·). Hence,
A
−1
=
1
2L +1
A − 1
2L
1
T
2L
,
B
−1
=
1
2M +1
B − 1
2M
1
T
2M
(A. 33)
so that
A − 1
2L
1
T
2L
−1
=
1
2L +1
A
H
,
B − 1
2M
1
T
2M
−1
=
1
2M +1
B
H
.
(A. 34)
This establishes that these inverses exist. Hence, the inverse
of H also exists. This completes the proof.
C. PROOF OF THEOREM 2
The proof follows from a straightforward application of the
GSE results of Theorem 3 to the case at hand.
We first combine (A. 29), (A. 30), (A. 32), and (A. 34)to
obtain
H
−1
=
⎡
⎢
⎢
⎢
⎢
⎢
⎢
⎢
⎢
⎣
1 −
2L
2L+!
−
2M
2M +1
1
2L +1
1
T
2L
1
2M +1
1
T
2M
1
2L +1
1
2L
1
2L +1
A
H
0
1
2M +1
1
2M
0
1
2M +1
B
H
⎤
⎥
⎥
⎥
⎥
⎥
⎥
⎥
⎥
⎦
.
(A. 35)
Denoting
γ
1
(z) =
⎡
⎢
⎢
⎢
⎢
⎢
⎢
⎣
e
jc
T
2
z
e
jc
T
3
z
.
.
.
e
jc
T
2L+1
z
⎤
⎥
⎥
⎥
⎥
⎥
⎥
⎦
, γ
2
(z) =
⎡
⎢
⎢
⎢
⎢
⎢
⎢
⎣
e
jc
T
2(L+1)
z
e
jc
T
3
z
.
.
.
e
jc
T
2(L+M)+1
z
⎤
⎥
⎥
⎥
⎥
⎥
⎥
⎦
(A. 36)
we can use (A. 20)and(A. 23)toobtain
⎡
⎢
⎢
⎢
⎢
⎢
⎣
Φ
1
(ω, z)
Φ
2
(ω, z)
.
.
.
Φ
2(L+M)+1
(ω, z)
⎤
⎥
⎥
⎥
⎥
⎥
⎦
=
diag
e
− jω
T
z
1
, , e
− jω
T
z
2(L+M)+1
·
H
−1
⎡
⎢
⎣
1
γ
1
(z)
γ
2
(z)
⎤
⎥
⎦
(A. 37)
so that by (A. 35),
⎡
⎢
⎢
⎢
⎢
⎢
⎢
⎢
⎢
⎢
⎢
⎢
⎢
⎢
⎣
Φ
1
(ω, z)
Φ
2
(ω, z)
.
.
.
Φ
2(L+M)+1
(ω, z)
⎤
⎥
⎥
⎥
⎥
⎥
⎥
⎥
⎥
⎥
⎥
⎥
⎥
⎥
⎦
=
⎡
⎢
⎢
⎢
⎢
⎢
⎢
⎢
⎢
⎢
⎣
e
− jω
T
z
1
1 −
2L
2L+!
−
2M
2M +1
+
1
2L +1
1
T
2L
γ
1
(z)+
1
2M +1
1
T
2M
γ
2
(z)
diag
e
− jω
T
z
2
, , e
− jω
T
z
2L+1
1
2L +1
1
2L
+
1
2L +1
A
H
γ
1
(z)
diag
e
− jω
T
z
2(L+1)
, , e
− jω
T
z
2(L+M)+1
1
2M +1
1
2M
+
1
2M +1
B
H
γ
2
(z)
⎤
⎥
⎥
⎥
⎥
⎥
⎥
⎥
⎥
⎥
⎦
.
(A. 38)
From (8)and(A. 36)wehave
1
T
2L
γ
1
(z) =
2L+1
p=2
e
jc
T
p
z
=
L
r=1
e
j(2πrx/((2L+1)Δx))
+ e
− j(2πrx/((2L+1)Δx))
=
2sin
πLx
(2L +1)Δx
cos
π(L +1)x
(2L +1)Δx
sin
πx
(2L +1)Δx
(A. 39)
and similarly
1
T
2M
γ
2
(z) =
2sin
πMT
(2M +1)Δt
cos
π(M +1)t
(2M +1)Δt
sin
πt
(2M +1)Δt
.
(A. 40)
Also, from (8), (A. 27), and (A. 36)weobtain,aftersomeal-
gebra,
A
H
γ
1
(z)
r
=
L
s=1
e
− j(2πrs/(2L+1))
e
j(2πsx/((2L+1)Δx))
+ e
j(2πrs/(2L+1))
e
− j(2πsx/((2L+1)Δx))
=
2sin
πL(x − rΔx)
(2L +1)Δx
cos
π(L +1)(x − rΔx)
(2L +1)Δx
sin
π(x − rΔx)
(2L +1)Δx
(A. 41)
for r
= 1, ,2L, and similarly, from (8), (A. 28), and (A. 36),
B
H
γ
2
(z)
r
=
2sin
πM(t − rΔt)
(2M +1)Δt
cos
π(M +1)(t − rΔt)
(2M +1)Δt
sin
π(t − rΔt)
(2M +1)Δt
(A. 42)
for r
= 1, ,2M.
10 EURASIP Journal on Advances in Signal Processing
Substituting (A. 39)–(A. 42) into (A. 38)weobtain
Φ
q
(ω, z)
=
⎧
⎪
⎪
⎪
⎪
⎪
⎪
⎪
⎪
⎪
⎪
⎪
⎪
⎪
⎪
⎪
⎪
⎪
⎪
⎪
⎪
⎪
⎪
⎪
⎪
⎪
⎪
⎪
⎪
⎪
⎪
⎪
⎪
⎪
⎪
⎪
⎪
⎪
⎪
⎪
⎪
⎪
⎪
⎪
⎪
⎪
⎪
⎪
⎪
⎪
⎪
⎪
⎪
⎪
⎪
⎪
⎪
⎪
⎪
⎪
⎪
⎪
⎪
⎪
⎪
⎪
⎪
⎪
⎪
⎪
⎪
⎪
⎪
⎪
⎪
⎪
⎪
⎪
⎪
⎪
⎪
⎪
⎪
⎪
⎪
⎪
⎪
⎪
⎪
⎪
⎪
⎨
⎪
⎪
⎪
⎪
⎪
⎪
⎪
⎪
⎪
⎪
⎪
⎪
⎪
⎪
⎪
⎪
⎪
⎪
⎪
⎪
⎪
⎪
⎪
⎪
⎪
⎪
⎪
⎪
⎪
⎪
⎪
⎪
⎪
⎪
⎪
⎪
⎪
⎪
⎪
⎪
⎪
⎪
⎪
⎪
⎪
⎪
⎪
⎪
⎪
⎪
⎪
⎪
⎪
⎪
⎪
⎪
⎪
⎪
⎪
⎪
⎪
⎪
⎪
⎪
⎪
⎪
⎪
⎪
⎪
⎪
⎪
⎪
⎪
⎪
⎪
⎪
⎪
⎪
⎪
⎪
⎪
⎪
⎪
⎪
⎪
⎪
⎪
⎪
⎪
⎪
⎩
1 −
2L
2L+!
−
2M
2M +1
+
1
2L +1
×
2sin
πLx
(2L +1)Δx
cos
π(L +1)x
(2L +1)Δx
sin
πx
(2L +1)Δx
+
1
2M +1
2sin
πMT
(2M +1)Δt
cos
π(M +1)t
(2M +1)Δt
sin
πt
(2M +1)Δt
,
for q
= 1,
1
2L +1
e
− j(q−1)Δxω
x
×
⎛
⎜
⎜
⎜
⎝
1+
2sin
πL
x − (q − 1)Δx
(2L +1)Δx
sin
π
x − (q − 1)Δx
(2L +1)Δx
×
cos
π(L +1)
x − (q − 1)Δx
(2L +1)Δx
⎞
⎟
⎟
⎟
⎠
,
for q
= 2, ,2L +1,
1
2M +1
e
− j(q−2L−1)Δtω
t
×
⎛
⎜
⎜
⎜
⎝
1+
2sin
πM
t − (q − 2L − 1)Δt
(2M +1)Δt
sin
π
t − (q − 2L − 1)Δt
(2M +1)Δt
×
cos
π(M +1)
t − (q − 2L − 1)Δt
(2M +1)Δt
⎞
⎟
⎟
⎟
⎠
,
for q
= 2(L +1), ,2(L + M)+1.
(A. 43)
Substituting (2), (6), and (A. 43) into (A. 19) and, after some
further algebra, we obtain (10). This completes the proof.
REFERENCES
[1] A. Feuer and N. Maor, “Acquisition of image sequences with
enhanced resolution,” U.S.A Patent (pending), 2005.
[2] E. Shechtman, Y. Caspi, and M. Irani, “Increasing space-time
resolution in video,” in Proceedings of the 7th European Con-
ference on Computer Vision (ECCV ’02), vol. 1, pp. 753–768,
Copenhagen, Denmark, May 2002.
[3] K. F. Cheung, “A multi-dimensional extension of Papoulis’
generalized sampling expansion with application in minimum
density sampling,” in Advanced Topics in Shannon Sampling and
Interpolation Theory, R. J. Marks II, Ed., pp. 86–119, Springer,
New York, NY, USA, 1993.
[4]H.StarkandY.Yang,Vector Space Projections, John Wiley &
Sons, New York, NY, USA, 1998.
[5] N. Maor, “Compression at the source,” M .S. thesis, Department
of Electr ical Engineering, Technion, Haifa, Israel, 2006.
[6] E. Dubois, “The sampling and reconstruction of time-varying
imagery with application in video systems,” Proceedings of the
IEEE, vol. 73, no. 4, pp. 502–522, 1985.
[7] A. Feuer and G. C. Goodwin, “Reconstruction of multidimen-
sional bandlimited signals from nonuniform and generalized
samples,” IEEE Transactions on Signal Processing, vol. 53, no. 11,
pp. 4273–4282, 2005.
[8] A. Papoulis, “Generalized sampling expansion,” IEEE Transac-
tions on Circuits and Systems, vol. 24, no. 11, pp. 652–654, 1977.
[9] A. Feuer, “On the necessity of Papoulis’ result for multi-
dimensional GSE,” IEEE Signal Processing Letters, vol. 11, no. 4,
pp. 420–422, 2004.
Nir Maor received his B.S. degree from the
Technion-Israel Institute of Technology, in
1998, in electrical engineering. He is at the
final stages of studies toward the M.S. de-
gree in electrical engineering in the Depart-
ment of Electrical Engineering, Technion-
Israel Institute of Technology. Since 1998
he has been with the Zoran Microelectron-
ics Cooperation, Haifa, Israel, where he has
been working on the IC design for digital
cameras. He has ten years of experience in SoC architecture and
design, and in a wide range of other digital camera aspects. He de-
signed, developed, and implemented the infrastructure of the digi-
tal camera products. In particular, his specialty includes the aspects
of image acquisition and digital processing together with a wide
range of logic design aspects. While being with Zoran, he estab-
lished a worldwide application support team. He took a major part
in the definition of the HW architecture, development, and imple-
mentation of the image processing algorithms and other HW ac-
celerators. Later on, he leads the SW group, Verification group, and
the VLSI group of the digital camera product line. At the present,
he is managing a digital camera project.
Arie Feuer has been with the Electrical
Engineering Department at the Technion-
Israel Institute of Technology since 1983
where he is currently a Professor and Head
of the Control and Robotics Lab. He re-
ceived his B.S. and M.S. degrees from the
Technion in 1967 and 1973, respectively,
and his Ph.D. degree from Yale University in
1978. From 1967 to 1970 he was in industry
working in automation design and between
1978 and 1983 with Bell Labs in Holmdel. Between the years 1994
and 2002 he served as the President of the Israel Association of Au-
tomatic Control and was a member of the IFAC Council during the
years 2002–2005. Arie Feuer is a Fellow of the IEEE. In the last 17
years he has been regularly visiting the Electrical Engineering and
Computer Science Department at the University of Newcastle. His
current research interests include: (1) resolution enhancement of
digital images and videos, (2) sampling and combined represen-
tations of signals and images, and (3) adaptive systems in signal
processing and control.
Nir Maor et al. 11
Graham C. Goodwin obtained his B.S.
(physics), B.E (electrical engineering), and
Ph.D. degrees from the University of New
South Wales. He is currently Professor of
Electrical Engineering at the University of
Newcastle, Australia and holds honorary
Doctorates from Lund Institute of Technol-
ogy, Sweden and the Technion Israel. He is
the coauthor of eight books, four edited vol-
umes, and many technical papers. Graham
is the recipient of Control Systems Society 1999 Hendrik Bode Lec-
ture Prize, a Best Paper award by IEEE Transaction on Automatic
Control, a Best Paper award by Asian Journal of Control, and two
Best Engineering Text Book awards from the International Federa-
tion of Automatic Control. He is a Fellow of IEEE; an honorary Fel-
low of Institute of Engineers, Australia; a Fellow of the Australian
Academy of Science; a Fellow of the Australian Academy of Tech-
nology, Science, and Engineering; a Member of the International
Statistical Institute; a Fellow of the Royal Society, London, and a
foreign Member of the Royal Swedish Academy of Sciences.