Báo cáo hóa học: " Research Article Robust Background Subtraction with Shadow and Highlight Removal for Indoor Surveillance Jwu-Sheng Hu and Tzung-Min Su" pot
Bạn đang xem bản rút gọn của tài liệu. Xem và tải ngay bản đầy đủ của tài liệu tại đây (3.61 MB, 14 trang )
Hindawi Publishing Corporation
EURASIP Journal on Advances in Signal Processing
Volume 2007, Article ID 82931, 14 pages
doi:10.1155/2007/82931
Research Article
Robust Background Subtraction with Shadow and
Highlight Removal for Indoor Surveillance
Jwu-Sheng Hu and Tzung-Min Su
Department of Electrical and Control Engineering, National Chiao-Tung University, Hsinchu 300, Taiwan
Received 1 March 2006; Revised 12 S eptember 2006; Accepted 29 October 2006
Recommended by Francesco G. B. De Natale
This work describes a robust background subtraction scheme involving shadow and highlig ht removal for indoor environmen-
tal surveillance. Foreground regions can be precisely extracted by the proposed scheme despite illumination variations and dy-
namic background. The Gaussian mixture model (GMM) is applied to construct a color-based probabilistic background model
(CBM). Based on CBM, the short-term color-based background model (STCBM) and the long-term color-based background
model (LTCBM) can be extracted and applied to build the gradient-based version of the probabilistic background model (GBM).
Furthermore, a new dynamic cone-shape boundary in the RGB color space, called a cone-shape illumination model (CSIM), is
proposed to distinguish pixels among shadow, highlight, and foreground. A novel scheme combining the CBM, GBM, and CSIM
is proposed to determine the background which can be used to detect abnormal conditions. The effectiveness of the proposed
method is demonstrated via experiments with several video clips collected in a complex indoor environment.
Copyright © 2007 J S. Hu and T M. Su. This is an open access article distributed under the Creative Commons Attribution
License, which permits unrestricted use, distribution, and reproduction in any medium, provided the original work is properly
cited.
1. INTRODUCTION
Image background subtraction is an essential step in many
vision-based home-care applications, especially in the field
of monitoring and surveillance. If foreground objects can
be precisely extracted through background subtraction, the
computing time of the following vision algorithms will be
reduced due to limited searching regions and the efficiency
becomes better because of neglecting noises outside the fore-
ground regions.
A reference image is generally used to perform back-
ground subtraction. The simplest means of obtaining a ref-
erence image is by averaging a period of frames [1]. How-
ever, it is not suitable to apply time averaging on the home-
care applications because the foreground objects (especially
for the elderly people or children) usually move slowly and
the household scene changes constantly due to light varia-
tions from day to night, switches of fluorescent lamps and
furniture movements, and so forth. In short, the determin-
istic methods such as the time averaging have been found to
have limited success in pr actice. For indoor environments, a
good background model must also handle the effects of illu-
mination variation, and the variation from background and
shadow detection. Furthermore, if the background model
cannot handle the fast or slow variations from sunlight or
fluorescent lamps, the entire image will be regarded as fore-
ground. That is, a single model cannot represent the distri-
bution of pixels with twinkling values. Therefore, to describe
a background pixel by a bimodel instead of a single model is
necessary in home-care applications in the real world.
Two approaches were generally adopted to build up a bi-
model of background pixel. The first approach is termed the
parametr ic method, and uses single Gaussian distribution
[2]ormixturesofGaussian[3] to model the background im-
age. Attempts were made to improve the GMM methods to
effectively design the background model, for example, using
an online updated algorithm of GMM [4] and the Kalman
filter to track the variation of illumination in the background
pixel [5]. The second approach is cal l ed the nonparametric
method, and uses the kernel function to estimate the density
function of background images [6].
Another important consideration is the shadows and
highlights. Numerous recent studies have attempted to de-
tect the shadows and highlights. Stockham [7] proposed that
a pixel contains both an intensit y value and a reflection fac-
tor. If a pixel is termed the shadow, then a decadent factor is
implied on that pixel. To remove the shadow, the decadent
factor should be estimated to calculate the real pixel value.
2 EURASIP Journal on Advances in Signal Processing
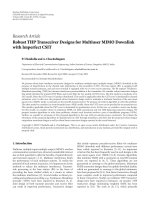
Model update
Model update
Cone-shape
illumination model
(CSIM)
Input image
Output image
Shadow and highlight
removal
Hierarchical
background subtraction
Gradient-based
background subtraction
Selection rule
Gradient-based
background model
(GBM)
Color-based background model
(CBM)
Short-term color-based
background model
(STCBM)
Long-term color-based
background model
(LTCBM)
Color-based
background
subtraction
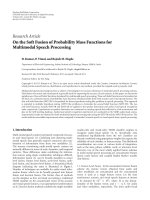
Figure 1: Block diagram showing the proposed scheme for background subtraction with shadow removal.
Rosin and Ellis [8] proposed that shadow is equivalent to a
semitransparent region, and uses two properties for shadow
detection. Moreover, Elgammal et al. [9] tried to convert the
RGB color space to the rgb color space (chromaticity coordi-
nate). Because illumination change is insensitive in the chro-
maticity coordinate, shadows are not considered the fore-
ground. However, lightness information is lost in the rgb
color space. To overcome this problem, a measure of light-
ness is used at each pixel [9]. However, the static thresholds
are unsuitable for dynamic environment.
Indoor surveillance applications require solving environ-
mental changes and shadow and highlight effects. Despite the
existence of abundance of research on individual techniques,
as described above, few efforts have been made to investigate
the integration of environmental changes and shadow and
highlight effects. The contribution of this work is the scheme
to combine the color-based background model (CBM), the
gradient-based background model (GBM), and the cone-
shape il lumination model (CSIM). In CSIM, a new dynamic
cone-shape boundary in the RGB color space is proposed
for efficiently distinguishing a pixel from the foreground,
shadow, and highlight. A selection rule combined with the
short-term color-based background model (STCBM) and
long-term color-based background model (LTCBM) is also
proposed to determine the para meters of GBM and CSIM.
Figure 1 illustrates the block diagram of the overall scheme.
The remainder of this paper is organized as follows.
Section 2 describes the statistical learning method used in
the probabilistic modeling and defines STCBM and LTCBM.
Section 3 then proposes CSIM using STCBM and LTCBM
to classify shadows and highlights efficiently. A hierarchi-
cal background subtraction framework that combined with
color-based subtraction, gradient-based subtraction, and
shadow and highlight removal was then described to extract
the real foreground of an image. In Section 4, experimental
results are presented to demonstrate the performance of the
proposed method in complex indoor environments. Finally,
Section 5 presents discussions and conclusions.
2. BACKGROUND MODELING
Our previous investigation [10] studied a CBM to record the
activity history of a pixel via GMM. However, the foreground
regions generally suffer from rapid intensity changes and re-
quire a period of time to recover themselves when objects
leave the background. In this work, STCBM and LTCBM are
defined and applied to improve the flexibility of the gradient-
based subtraction that proposed by Javed et al. [11].The fea-
tures of images used in this work include pixel color and
gradient information. This study assumes that the density
functions of the color features and gradient features are both
Gaussian distributed.
2.1. Color-based background modeling
First, each pixel x is defined as a 3-dimensional vector
(R, G, B)attimet. N Gaussian distributions are used to con-
struct the GMM of each pixel, which is described as follows:
f
x | λ
=
N
i=1
w
i
1
(2π)
d
i
exp
−
1
2
x−μ
i
T
−1
i
x−μ
i
,
(1)
where λ represents the parameters of GMM,
λ
=
w
i
, μ
i
,
i
, i = 1, 2, , N,
N
i=1
w
i
= 1. (2)
Suppose X
={x
1
, x
2
, , x
m
} is defined as a training fea-
ture vector containing m pixel values collected from a pixel
among a period of m image frames. The next step is calculat-
ing the parameter λ of GMM of each pixel so that the GMM
can match the distribution of X with minimal errors. A com-
mon method for calculating λ is the maximum likelihood
(ML) estimation. ML estimation aims to find model param-
eters by maximizing the GMM likelihood function. ML pa-
rameters can be obtained iteratively using the expectation
maximization (EM) algorithm and the maximum likelihood
estimation of λ is defined as follows:
λ
ML
= arg max
λ
m
j=1
log f
x
j
| λ
. (3)
J S. Hu a nd T M. Su 3
The EM algorithm involves two steps; the parameters of
GMM can be derived by iteratively using the expectation step
equation and maximum step equation, as follows:
Expectation step (E step):
β
ji
=
w
i
f
x
j
| μ
i
,
i
N
k=1
a
k
f
x
j
| μ
k
,
k
, i = 1, , N, j = 1, , m,
(4)
β
ji
denotes the posterior probability that the feature vector
x
j
belongs to the ith Gaussian component distribution.
Maximum step (M step):
w
i
=
1
N
m
j=1
β
ji
,
μ
i
=
m
j=1
β
ji
x
j
m
j
=1
β
ji
,
i
=
m
j
=1
β
ji
x
j
− μ
i
x
j
− μ
i
T
m
j
=1
β
ji
.
(5)
The termination criteria of the EM algorithm are as follows:
(a) the increment between the new log-likelihood value
and the last log-likelihood value is below a minimum
increment threshold;
(b) The iterative count exceeds a maximum iterative count
threshold.
Suppose an image contains total S
= W ×H pixels, where
W means the image width and H means the image height
and then there are total S GMMs should be calculated by the
EM algorithm with the collected training feature vector of
each pixel.
Moreover, this study uses the K-means algorithm [12],
which is an unsupervised data clustering used before the EM
algorithm iterations to accelerate the convergence. First, N
random values are chosen from X and assigned as the center
of each class. Then the following steps are applied to cluster
the m values of the training feature vector X.
(a) Calculate the 1-norm distances between the m values
and the N center values. Each value of X is classified to the
class which has the minimum distance with it.
(b) After clustering all the values of X,recalculateeach
class center by calculating the mean of the values among each
class.
(c) Calculate the 1-norm distances between the m values
and the N new center values. Each value of X is classified to
the class which has the minimum distance with it. If the new
clustering result is the same as the clustering result before re-
calculating each class center, then stop, otherwise return to
previous step to calculate the N new center values.
After applying K-means algorithm to cluster the values
of X, the mean of each class is assigned as the initial value
of μ
i
, the maximum distance among the points of each class
is assigned as the initial value of
i
, and the value of w
i
is
initialized as 1/N.
2.2. Model maintenance of LTCBM and STCBM
According to the above section, an initial color-based proba-
bilistic background model is created using the t raining fea-
ture vector set X with N Gaussian distributions and N is
usually defined as 3 to 5 based on the observation over a
short period of time m. However, when the background
changes are recorded over time, it is possible that more dif-
ferent distributions from the original N distributions are ob-
served. If the GMM of each pixel contains only N Gaussian
distributions, only N background distributions are reserved
and other collected background information is lost and it is
not flexible to model the background with only N Gaussian
distributions.
To maintain the representative background model and
improve the flexibility of the background model simultane-
ously, an initial LTCBM is defined as the combination of the
initial color-based probabilistic background model and extra
N new Gaussian distributions (total 2N distributions), an ar-
rangement inspired by the work of [3]. Kaew et al. [3]pro-
posed a method of sorting the Gaussian distributions based
on the fitness value w
i
/σ
i
(
i
= σ
2
i
I), and extracted a repre-
sentative model with a threshold value B
0
.
After sorting the first N Gaussian distributions with fit-
ness value, b (b
≤ N) Gaussian distributions are extracted
with the following criterion:
B
= arg min
b
b
j=1
w
j
>B
0
. (6)
The first b Gaussian dist ributions are defined as the
elected color-based background model (ECBM) to be the cri-
terion to determine the background. Meanwhile, the remain-
ders (2N
− b) of the Gaussian distributions are defined as the
candidate color-based backg round model (CCBM) for deal-
ing with the background changes. Finally, LTCBM is defined
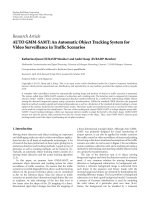
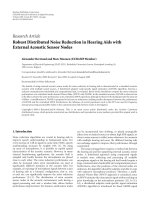
using the combination of the ECBM and CCBM. Figure 2
shows the block diagram to illustrate the process of building
the initial LTCBM, ECBM, and CCBM.
The Gaussian distributions of ECBM mean the character-
istic distributions of “background.” Therefore, if a new pixel
value belongs to any of the Gaussian distributions of ECBM,
the new pixel is regarded as “a pixel contains the property of
background” and the new pixel is classified as “background.”
In this work, a new pixel value is considered as background
when it belongs to any Gaussian distribution in ECBM and
has a probability n ot exceeding 2.5 standard deviations away
from the corresponding distribution. If none of the b Gaus-
sian distributions match the new pixel value, a new test is
conducted by checking the new pixel value against the Gaus-
sian distributions in CCBM. The parameters of the Gaussian
4 EURASIP Journal on Advances in Signal Processing
Training vector set X
EM algorithm Match EM stopping rules ?
No
Yes
The initial color-based
probabilistic background model
Extra N Gaussian distributions
The first b Gaussian
distributions are defined as
ECBM
The remainders (2N
b)
Gaussian distributions are
defined as CCBM
Initial long-term
color-based
background model
(initial LTCBM)
Sorting the 2N
Gaussian distributions
with fitness value
Figure 2: Block diagram showing the process of building the initial LTCBM, ECBM and CCBM.
distributions are updated via the following equations:
w
t+1
i
= (1 − α)w
t
i
+ α
p
w
t
i
| X
t+1
i
,
m
t+1
i
= (1 − ρ)m
t
i
+ ρX
t+1
i
,
t+1
i
= (1 − ρ)
t
i
+ρ
X
t+1
i
− m
t+1
i
T
X
t+1
i
− m
t+1
i
,
ρ
= αg
X
t+1
i
| m
t
i
,
t
i
,
(7)
ρ and α are termed the learning rates and determine the up-
date speed of LTCBM. Moreover,
p(w
t
i
| X
t+1
i
) results from
background subtraction which is set to 1 if a new pixel value
belongs to the ith Gaussian distribution. If a new incoming
pixel value does not belong to any of the Gaussian distri-
butions in CBM and the number of Gaussian components
in CCBM is below (2N
− b), a new Gaussian distribution
is added to reserve the new background information with
three parameters: the current pixel value as the mean, a large
predefined value as the initial variance, and a low predefined
value as the weight. Otherwise, the (2N
− b)th Gaussian dis-
tribution in CCBM is replaced by the new one. After updat-
ing the parameters of the Gaussian components, all Gaussian
distributions in CBM are resorted by recalculating the fitness
values.
Unlike LTCBM, STCBM is defined to record the back-
ground changes during a short period. Suppose B
1
frames
are collected during a short period B
1
and then B
1
new in-
coming pixels for each pixel are collected and defined as a
test pixel set P
={p
1
, p
2
, , p
q
, , p
B
1
},wherep
q
means
the new incoming pixel at time q. A test pixel set P is defined
and used for calculating the STCBM and a result set S is then
defined and calculated by comparing P with LTCBM and is
described as (8), where I
q
means the result after background
subtraction, which means the index of Gaussian distribution
of the initial LTCBM, R
q
means the index of resorting re-
sult for each Gaussian distribution after each update, and F
q
means the reset flag of each Gaussian distribution,
S
=
S
1
, S
2
, , S
q
, , S
B
1
, S
q
=
I
q
, R
q
(i), F
q
(i)
,
where 1
≤ I
q
≤ 2N,1≤ R
q
(i) ≤ 2N,
F
q
(i) ∈{0, 1},1≤ i ≤ 2N
.
(8)
The histog ram of CG is then given using the following
equation:
H
CG
(k) =
k
δ
k−
I
q
+R
q
I
q
+F
q
·
q
δ
k−
I
q
+R
q
I
q
B
1
,
1
≤ k ≤ 2N,1≤ q ≤ B
1
,1≤ q
<q.
(9)
In brief, four Gaussian distr ibutions are used to explain
how (8)-(9) work and the corresponding example is listed
in Ta ble 1. At first, the original CBM contains four Gaussian
distributions (2N
= 4), and the index of Gaussian distribu-
tion in the initial CBM is fixed (1, 2, 3, 4). At the first time,
a new incoming pixel which belongs to the second Gaussian
distribution compares with the CBM, so the result of back-
ground subtra ction is I
q
= 2. Moreover, the CBM is updated
with (7) and the index of Gaussian distribution in CBM is
changed. When the order of the first and second Gaussian
distributions is changed, R
q
(i) records the change states; for
example, R
q
(1) = 1 means the first Gaussian distribution has
moved forward to the second one, and R
q
(2) =−1means
the second Gaussian distribution has moved backward to the
first one. At the second time, a new incoming pixel which
belongs to the second Gaussian distribution based on the
initial CBM is classified as the first Gaussian distribution
(I
q
= 1) based on the latest order of CBM. However, the CG
histogram can be calculated according to the original index
of the initial CBM with the latest order of CBM and R
q
(i),
such that H
CG
(I
q
+ F
q
= 2) will be accumulated with one.
Moreover, R
q
(i) changes while the order of Gaussian distri-
butions changes. For example, at the fifth time in Ta ble 1,
the order of CBM changes from (2, 1, 3,4) to (1, 2, 3, 4), and
then R
q
(1) = 1 − 1 = 0 means the first Gaussian distribution
J S. Hu a nd T M. Su 5
Table 1: The example to calculate CG histogram.
Time (q)
Index of initial
CBM
1234Time (q)
Index of initial
CBM
1234
1
Index of CCBM
at time q
1234
4
Index of CCBM
at time q
2134
p
q
— ∗ —— p
q
∗ ———
I
q
2 I
q
2
R
q
0000 R
q
1 −100
F
q
0000 F
q
0000
CG 0100 CG 2200
2
Index of CCBM
at time q
2134
5
Index of CCBM
at time q
1234
p
q
— ∗ —— p
q
∗ ———
I
q
1 I
q
1
R
q
1 −100 R
q
0000
F
q
0000 F
q
0000
CG 0200 CG 3200
3
Index of CCBM
at time q
2134
6
Index of CCBM
at time q
1234
p
q
∗ ——— p
q
—— ∗ —
I
q
2 I
q
3
R
q
1 −100 R
q
0000
F
q
0000 F
q
0000
CG 1200 CG 3210
Tes t p i xe l P
q
No
Yes
Color-based background
subtraction
The result structure S
q
of the
background subtraction
Record S
q
into the
result structure S
q
= B
1
?CalculateH
CG
LTCB M
Resorting the Gaussian
distributions of the LTCBM
q = q +1
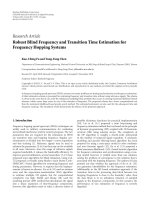
Figure 3: Block diagram showing the process to calculate H
CG
(the histogram of I
q
).
of initial CBM has moved back to the first one of the latest
CBM, and R
q
(2) =−1+1= 0 means the second Gaussian
distribution has moved back to the second one of the latest
CBM.
If a new incoming pixel p
q
matches the ith Gaussian dis-
tribution that has the least fitness value, the ith Gaussian dis-
tribution is replaced with a new one and the flag F
q
will be set
to1toresettheaccumulatedvalueofH
CG
(i). Figure 3 shows
the block diagram about the process of calculating H
CG
.
After matching all test pixels to the corresponding Gaus-
sian distribution, the result set S can be used to calculating
H
CG
using I
q
and F
q
. With the reset flag F
q
,STCBMcanbe
built up rapidly based on a simple idea, threshold on the oc-
curring frequency of Gaussian distribution. That is to say, the
short-term tendency of background changes is apparent if
an element of H
CG
(k) is above a threshold value B
2
during
aperiodofframesB
1
. In this work, B
1
is assigned a value
of 300 frames and B
2
is set to be 0.8. Therefore, the repre-
sentative background component in the short-term tendency
can be determined to be k if the value of H
CG
(k) exceeds
0.8, otherwise, STCBM provides no further information on
background model selection.
2.3. Gradient-based background modeling
Javed et al. [11] developed a hierarchical approach that com-
bines color and gradient information to solve the prob-
lem about rapid intensity changes. Javed et al. [11]adopted
the kth, highest weighted Gaussian component of GMM at
each pixel to obtain the gradient information to build the
6 EURASIP Journal on Advances in Signal Processing
gradient-based background model. The choice of k in [11]
is similar to selecting k based only on ECBM defined in
this work. However, choosing the highest weighted Gaussian
component of GMM leads to the loss of the short term ten-
dencies of background changes. Whenever a new Gaussian
distribution is added into the background model, it is not
selected owing to its low weighting value for a long period
of time. Consequently, the accuracy of the gradient-based
background model is reduced for that the gradient informa-
tion is not suitable for representing the current gradient in-
formation.
To solve this problem, both STCBM and LTCBM are con-
sidered in selecting the value of k for developing a more ro-
bust gradient-based background model and maintaining the
sensitivity to short-term changes. When STCBM provides a
representative background component (says the k
S
th bin in
STCBM), k is set to k
S
rather than the highest weighted Gaus-
sian distribution.
Let x
t
i, j
= [R, G, B] be the latest color value that matched
the k
S
th distribution of LTCBM at pixel location (i, j), then
the gray value of x
t
i, j
is applied to calculate the gradient-based
background subtraction. Suppose the gray value of x
t
i, j
is cal-
culated as (10), then g
t
i, j
will be dist ributed as (11)basedon
independence among RGB color channels,
g
t
i, j
= αR + βG + γB, (10)
g
t
i, j
∼ N
m
t
i, j
,
σ
t
i, j
2
, (11)
where
m
t
i, j
= αμ
t,k
s
,R
i, j
+ βμ
t,k
s
,G
i, j
+ γμ
t,k
s
,B
i, j
,
σ
t
i, j
=
α
2
σ
t,k
s
,R
i, j
2
+ β
2
σ
t,k
s
,G
i, j
2
+ γ
2
σ
t,k
s
,B
i, j
2
.
(12)
After that, the gradient along the x axis and y axis can
be defined as f
x
= g
t
i+1, j
− g
t
i, j
and f
y
= g
t
i, j+1
− g
t
i, j
. From the
work of [11], f
x
and f
y
have the distributions defined in (13),
f
x
∼ N
m
f
x
,
σ
f
x
2
,
f
y
∼ N
m
f
y
,
σ
f
y
2
,
(13)
where
m
f
x
= m
t
i+1, j
− m
t
i, j
,
m
f
y
= m
t
i, j+1
− m
t
i, j
,
σ
f
x
=
σ
t
i+1, j
2
+
σ
t
i, j
2
,
σ
f
y
=
σ
t
i, j+1
2
+
σ
t
i, j
2
.
(14)
Suppose Δ
m
=
f
2
x
+ f
2
y
is defined as the magnitude of
the gradient for a pixel, Δ
d
=
tan
−1
( f
x
/f
y
)isdefinedasits
direction (the angle with respect to the horizontal axis), and
Δ
= [Δ
m
, Δ
d
] is defined as the feature vector for modeling
the gradient-based background model. The gradient-based
background model based on feature vector Δ
= [Δ
m
, Δ
d
]can
be defined as (15),
F
k
Δ
m
, Δ
d
=
Δ
m
2
σ
k
f
x
σ
k
f
y
1 − ρ
2
exp
−
z
2
1 − ρ
2
>T
g
,
(15)
where
z
=
Δ
m
cos Δ
d
− μ
f
x
σ
f
x
2
− 2ρ
Δ
m
cos Δ
d
− μ
f
x
σ
f
x
×
Δ
m
sin Δ
d
− μ
f
y
σ
f
y
+
Δ
m
sin Δ
d
− μ
f
y
σ
f
y
2
,
ρ
=
σ
t
i, j
2
σ
f
x
σ
f
y
.
(16)
3. BACKGROUND SUBTRACTION WITH
SHADOW REMOVAL
This section describes shadow and highlight removal, and
proposes a framework that combines CBM, GBM, and CSIM
to improve background subtraction efficiency.
3.1. Shadow and highlight removal
Besides foreground and background, shadows and highlights
are two important phenomena that should be considered in
most cases. Shadows and highlights result from changes in il-
lumination. Compared with the original pixel value, shadow
has similar chromaticity but lower brightness, and highlight
has similar chromaticity but higher br ightness. The regions
influenced by illumination changes are classified as the fore-
ground if shadow and highlight removal is not performed
after background subtraction.
Hoprasert et al. [13] proposed a method of detecting
highlight and shadow by gathering statistics from N color
background images. Brightness and chromaticity distortion
are used with four threshold values to classify pixels into four
classes. The method that used the mean value as the refer-
ence image in [13] is not suitable for dynamic background.
Furthermore, the threshold values are estimated based on the
histogram of brightness distortion and chromaticity distor-
tion with a given detection rate, and are applied to all pixels
regardless of the pixel values. Therefore, it is possible to clas-
sify the darker pixel value as shadow. Furthermore, it cannot
record the history of background information.
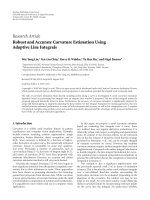
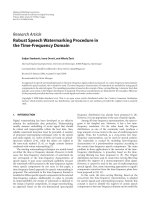
This paper proposes a 3D cone model that is similar to
the pillar model proposed by Hoprasert et al. [13], and com-
bines LTCBM and STCBM to solve the above problems. A
cone model is proposed with the efficiency in deciding the
parameters of 3D cone model according to the proposed
LTCBM and STCBM. In the RGB space, a Gaussian distri-
bution of the LTCBM becomes an ellipsoid whose center is
the mean of the Gaussian component, and the length of each
principle axis equals 2.5 standard deviations of the Gaussian
component. A new pixel I(R, G, B) is considered to belong
J S. Hu a nd T M. Su 7
B
O
G
R
I
Foreground
Highlight
Shadow
Background
Figure 4: The proposed 3D cone model in the RGB color space.
τ
low
m =
I
G
I
R
G
R
(μ
R
, μ
G
)
τ
high
m
1
m
2
a
b
Figure 5: 2D projection of the 3D cone model from RGB space onto
the RG space.
to background if it is located inside the ellipsoid. The chro-
maticities of the pixels located outside the ellipsoid but inside
the cone (formed by the ellipsoid and the origin) resemble
the chromaticity of the background. The brightness differ-
ence is then applied to classify the pixel as either highlight or
shadow. Figure 4 illustrates the 3D cone model in the RGB
color space.
The threshold values α
low
and α
high
are applied to avoid
classifying the darker pixel value as shadow or the brighter
value as highlight, and can be selected based on the stan-
dard deviation of the corresponding Gaussian distribution
in CBM. Because the standard deviations of the R, G,andB
color axes are different, the angles between the curved sur-
face and the ellipsoid center are also different. It is difficult
to classify the pixel using the angles in the 3D space. The 3D
cone is projected onto the 2D space to classify a pixel using
the slope and the point of tangency. Figure 5 illustrates the
projection of the 3D cone model onto the RG 2D space.
Let a and b denote the lengths of major and minor axis of
the ellipse, where a
= 2.5∗ σ
R
and b = 2.5∗ σ
G
.Thecenterof
the ellipse is (μ
R
, μ
G
), and the elliptical equation is descr ibed
as (17),
R − μ
R
2
a
2
+
G − μ
G
2
b
2
= 1. (17)
The line G
= mR is assumed to be the tangent line of the
ellipse with the slope m.Equation(11) can then be solved
using the line equation G
= mR with (18),
m
1,2
=
−
2μ
R
μ
G
±
a
2
− μ
2
R
2
− 4
2μ
R
μ
G
b
2
− μ
2
G
2
a
2
− μ
2
R
.
(18)
A matching result set is given by F
b
={f
bi
, i = 1, 2, 3},
where f
bi
is the matching result of a specific 2D space. A pixel
vector I
= [I
R
, I
G
, I
B
] is then projected onto the 2D spaces
of R-G, G-B,andB-R. The pixel matching result is set to 1
when the slope of the projected pixel vector is between m
1
and m
2
. Meanwhile, if the background mean vector is E =
[μ
R
, μ
G
, μ
B
], the brightness distortion α
b
can be calculated via
(19),
α
b
=
I co s(θ)
E
, (19)
where
θ
=
θ
I
− θ
E
=
tan
−1
⎛
⎝
I
G
I
2
R
+ I
2
B
⎞
⎠
−
tan
−1
⎛
⎝
μ
G
μ
2
R
+ μ
2
B
⎞
⎠
.
(20)
The image pixel is classified as highlight, shadow, or fore-
ground using the matching result set F
b
, the brightness dis-
tortion α
b
and (21),
C(i)
=
⎧
⎪
⎪
⎪
⎨
⎪
⎪
⎪
⎩
Shadow,
F
b
= 3, τ
low
<α
b
< 1, else,
Highlight,
F
b
= 3, 1 <α
b
<τ
high
, else,
Foreground, otherwise.
(21)
When a pixel is a large standard deviation away from a
Gaussian distribution, the Gaussian distribution probability
of the pixel approximately equals to zero. It also means the
pixel does not belong to the Gaussian distribution. By using
the simple concept, τ
high
and τ
low
can be chosen using N
G
standard deviation of the corresponding Gaussian distribu-
tion in CBM and are described as (22),
τ
high
= 1+
S·cos θ
τ
E
,
τ
low
= 1 −
S·cos θ
τ
E
,
(22)
where
E=
μ
R
2
+
μ
G
2
+
μ
B
2
,
S=
N
G
· σ
R
2
+
N
G
· σ
G
2
+
N
G
· σ
B
2
,
θ
τ
=
θ
E
− θ
S
=
tan
−1
⎛
⎝
μ
G
μ
2
R
+ μ
2
B
⎞
⎠
−
tan
−1
⎛
⎝
σ
G
σ
2
R
+ σ
2
B
⎞
⎠
.
(23)
8 EURASIP Journal on Advances in Signal Processing
3.2. Background subtraction
A hierarchical approach combining color-based backg round
subtract ion and g radient-based background subtraction has
been proposed by Javed et al. [11]. This work proposes a
similar method for extracting the foreground pixels. Given
anewimageframeI, the color-based background model
is set to LTCBM and STCBM, and gradient-based model
is F
k
(Δ
m
, Δ
d
). C(I) is defined as the result of color-based
background subtraction using CBM. G(I)isdefinedasthe
result of gradient-based background subtraction. C(I)and
G(I) can be extracted by testing ever y pixel of frame I us-
ing the LTCBM and F
k
(Δ
m
, Δ
d
). Moreover, C(I)andG(I)
are both defined as a binary image, where 1 represents the
foreground pixel and 0 represents the background pixel. The
foreground pixels labeled in C(I) are further classified as
shadow, highlight, and foreground by using the proposed
3D cone model. C(I) can then be obtained from C(I)after
transfer ring the foreground pixels which have been labeled as
shadow and highlight in C(I) into the background pixel. The
difference between Javed et al. [11] and the proposed method
is that a pixel classifying procedure using CSIM is applied
before using the connected component algorithm to group
all the foreground pixels in C(I). The robustness of back-
ground subtraction is enhanced due to the better accuracy in
|∂R
a
|. Moreover, the foreground pixels can be extracted us-
ing (24),
(i, j)∈∂R
a
∇I(i, j)G(i, j)
∂R
a
≥
P
B
, (24)
where
∇I denotes the edges of image I and ∂R
a
represents
the number of boundary pixels of region R
a
.
4. EXPERIMENTAL RESULTS
The video data for experiments was obtained using a SONY
DVI-D30 PTZ camera in an indoor environment. Morpho-
logical filter was applied to remove noise and the camera con-
trols were set to automatic mode. The same threshold val-
ueswereusedforallexperiments.Thevaluesoftheimpor-
tant threshold values were N
G
= 15, α = 0.002, P
B
= 0.1,
B
0
= 0.7, B
1
= 300, and B
2
= 0.8. Meanwhile, the com-
putational speed was around five frames per second on a P4
2.8 GHz PC, while the video had a frame size of 320
× 240.
4.1. Experiments for local illumination changes
The first experiment was performed to test the robust-
ness of the proposed method about the local illumination
changes. Local illumination changes resulting from desk
lights occur constantly in indoor environments. Desk lights
are usually white or yellow. Two video clips containing sev-
eral changes of desk light are collected to simulate local
illumination changes. Figure 6(a) shows 15 representative
samples of the first one video clip. Meanwhile, Figure 6(b)
shows the classified result of the foreground pixel using the
proposed method, CBM and CSIM, where red indicates
shadow, green indicates highlight, and blue indicates fore-
ground. Figure 6(c) displays the result of the final back-
ground subtraction to demonstrate the robustness of the
proposed method, where the white and black color repre-
sents the foreground and background pixels, respectively.
Theimagesequencescomprisedifferent levels of illumina-
tion changes. The desk light was turned on at the 476th frame
and its brightness increased until the 1000th frame. The over-
all picture becomes the foreground regions of the corre-
sponding frames in Figure 6(b) owing to the lack of such in-
formation in CBM. However, the final result of background
subtract ion of the corresponding frames in Figure 6(c) is still
good owing to the proposed scheme combining CBM, CSIM,
and GBM. The desk light was then turned off at the 1030th
frame and became darker until the 1300th fr a me. The orig-
inal Gaussian distribution in the ECBM became the com-
ponent in CCBM, and a new representative Gaussian distri-
bution in ECBM is constructed for that a new background
information is involved from the new collected frames be-
tween the 476th and the 1000th fra me are more than the
initial collected 300 frames. Consequently, the 1300th frame
in Figure 6(b) has many foreground regions. However, the
final result of the 1300th frame is still good. The illumina-
tion changes are al l modeled into LTCBM when the back-
ground model records the background changes. The area
of the red, blue, and green regions reduces after the 1300th
frame.
Table 2 compares the proposed scheme with the method
proposed by Hoprasert et al. [13]. Comparison criteria are
identified by labeling the foreground regions of a frame man-
ually. CSIM can be constructed based on the appropriate rep-
resentative Gaussian distribution chosen from LTCBM and
STCBM. The ability to handle illumination variation and the
accuracy of the background subtraction are improved and
the results are shown in Ta ble 2 .
Figure 7(a) shows a similar image sequence to that on
Figure 6(a). The two sequences differ only in the color of
the desk light. The desk light was tur ned on at the 660th
frame and the same brightness was maintained until the
950th frame. The desk light was then turned off at the 1006th
frame and turned on again at the 1180th frame. The results
of shadows and highlights removal are shown in Figure 7(b)
and the results of final background subtraction a re shown
in Figure 7(c). The results of background subtraction in
Figure 7 and the comparison result in Table 3 are shown to
demonstrate the robustness of the proposed scheme.
4.2. Experiments for global illumination changes
The second experiment was perfor med to test the robust-
ness of the proposed method in terms of global illumina-
tion changes. The image sequences consist of illumination
changes where a fluorescent lamp was turned on at the 381th
frame and more lamps were turned on at the 430th frame.
The illumination changes are then modeled into LTCBM
when the proposed background model recorded the back-
ground changes. Notably the area of the red, blue, and green
regions decreases at the 580th frame. When the third daylight
lamp is switched on in the 650th frame, it is clear that fewer
J S. Hu a nd T M. Su 9
Background 476 480 500 580 650 750 900
1000 1030 1120 1150 1300 1330 1400 1600
(a)
Background 476 480 500 580 650 750 900
1000 1030 1120 1150 1300 1330 1400 1600
(b)
Background 476 480 500 580 650 750 900
1000 1030 1120 1150 1300 1330 1400 1600
(c)
Figure 6: The results of illumination changes with a yellow desk light, the number below the picture is the index of frame, (a) original images,
(b) the results of pixel classification, where red indicates the shadow, green indicates the highlight, and blue indicates the foreground, (c)
the results of background subtraction with shadow removal using the proposed method, where dark indicates the background and white
indicates the foreground.
Table 2: The robustness test between the proposed method and that proposed by Hoprasert et al. [13] via local illumination changes with a
yellow desk light.
Frame 476 480 500 580 650
Proposed (%
∗
)Hoprasertetal.[13](%
∗
) 100.00 94.05 99.84 36.40 99.93 22.50 99.91 15.38 83.96 23.42
Frame 750 900 1000 1030 1120
Proposed (%
∗
)Hoprasertetal.[13](%
∗
) 91.50 31.51 93.10 30.91 95.44 34.26 97.75 38.28 99.15 32.90
Frame 1150 1300 1330 1400 1600
Proposed (%
∗
)Hoprasertetal.[13](%
∗
) 93.79 50.72 99.95 99.84 93.31 92.40 96.22 13.03 99.30 34.66
∗
The value in the table means the recognition rate that correct background pixels in a frame divide total pixels in a frame (%).
blue regions appear at the 845th frame owing to illumination
changes having been modeled in the LTCBM. However, the
final results of background subtraction shown in Figure 8(c)
are all better than those of pure color-based background
subtraction shown in Figure 8(b). Table 4 shows the com-
parison results between the proposed scheme and that pro-
posed by Hoprasert et al. [13]. The comparison demonstrates
that the proposed scheme is robust to global illumination
changes.
4.3. Experiments for foreground detection
In the third experiment (Figure 9), a person goes into the
monitoring area, and the foreground region can be effectively
extracted regardless of the influence of shadow and highlight
in the indoor environment. Owing to the captured video
clip having little illumination variation and dynamic back-
ground variation, the comparison of the recognition rate of
final background subtraction between the proposed method
10 EURASIP Journal on Advances in Signal Processing
Background 660 665 670 860 950 1006 1020
1150 1180 1250 1300 1375 1377 1380 1445
(a)
Background 660 665 670 860 950 1006 1020
1150 1180 1250 1300 1375 1377 1380 1445
(b)
Background 660 665 670 860 950 1006 1020
1150 1180 1250 1300 1375 1377 1380 1445
(c)
Figure 7: The results of illumination changes with w hite desk light, the number below the picture is the index of frame, (a) original images,
where red indicates the shadow, green indicates the highlight, and blue indicates the foreground, (b) the results of pixel classification, (c)
the results of background subtraction with shadow removal using our proposed method, where dark indicates the background and white
indicates the foreground.
Table 3: The robustness test between the proposed method and that proposed by Hoprasert et al. [13] via local illumination changes with a
white desk light.
Frame 660 665 670 860 950
Proposed (%
∗
)Hoprasertetal.[13](%
∗
) 99.02 99.48 97.93 79.81 95.92 92.22 96.73 93.81 97.44 94.46
Frame — 1020 1150 1180 1250
Proposed (%
∗
)Hoprasertetal.[13](%
∗
) 98.12 95.65 99.94 98.85 99.78 99.68 98.94 99.08 97.28 93.81
Frame — 1375 1377 1380 1445
Proposed (%
∗
)Hoprasertetal.[13](%
∗
) 97.49 95.26 97.73 87.50 98.83 98.92 99.73 99.32 100.00 99.71
∗
The value in the table means the recognition rate that correct background pixels in a frame divide total pixels in a frame (%).
and that of Hoprasert et al. [13] reveals that both methods
are about the same, a s listed in Ta ble 5.
4.4. Experiments for dynamic background
In the fourth experiment (Figure 10), image sequences con-
sist of swaying clothes hung on a frame. The proposed
method gradually recognizes the clothes as background ow-
ing to the ability of LTCBM to record the history of back-
ground changes. In situations involving large variation of
dynamic background, a representative initial color-based
background model can be established by using more train-
ing frames to handle the variations.
4.5. Experiments for short-term color-based
background model
The final experiment (Figure 11) shows the advantage of
adding STCBM. A doll is placed on the desk at the 360th
frame. Initially, it is regarded as foreground, and at the 560th
J S. Hu a nd T M. Su 11
Background 381 385 405 430 560 565 570
580 650 700 845 910 1000 1050 1110
(a)
Background 381 385 405 430 560 565 570
580 650 700 845 910 1000 1050 1110
(b)
Background 381 385 405 430 560 565 570
580 650 700 845 910 1000 1050 1110
(c)
Figure 8: The results of global illumination changes with fluorescent lamps, the number below the picture is the index of frame, (a) original
images, (b) the results of pixel classification, where red indicates the shadow, green indicates the highlight, and blue indicates the foreground,
(c) the results of background subtraction with shadow removal using our proposed method, where dark indicates the background and white
indicates the foreground.
Table 4: The comparison between the proposed method and that proposed by Hoprasert et al. [13] via global illumination changes with
fluorescent lamps.
Frame 381 (1
∗∗
) 385 (1
∗∗
) 405 (1
∗∗
) 430 (2
∗∗
) 560 (2
∗∗
)
Proposed (%
∗
)Hoprasertetal.[13](%
∗
) 98.24 93.54 88.35 82.14 83.85 78.24 56.50 68.42 66.85 69.82
Frame 565 (2
∗∗
) 570 (2
∗∗
) 580 (2
∗∗
) 650 (3
∗∗
) 700 (3
∗∗
)
Proposed (%
∗
)Hoprasertetal.[13](%
∗
) 79.87 69.30 96.88 69.69 99.08 69.55 99.23 45.62 99.49 46.22
Frame 845 (3
∗∗
) 910 (3
∗∗
) 1000 (3
∗∗
) 1050 (3
∗∗
) 1110 (3v)
Proposed (%
∗
)Hoprasertetal.[13](%
∗
) 99.56 46.18 99.39 53.58 99.85 57.87 99.93 60.83 99.64 60.32
∗
The value in the table means the recognition rate that correct background pixels in a frame divide total pixels in a frame (%).
∗∗
The number inside the parentheses indicates the number of fluorescent lamps that have turned on.
frame, the foreground region becomes background owing to
the LTCBM. However, the Gaussian component belonging
to the doll still does not have the highest weighting. With-
out adding STCBM, when a hand is placed above the doll at
the 590th frame, the foreground regions at the 670th frame
remain the same as those at the 590th frame, as shown in
Figure 11(b). The foreground regions under our hand be-
come shadows at the 670th fr ame in Figure 11(c) for that
shadows and highlights removal works well using a repre-
sentative Gaussian component based on STCBM. This ex-
periment demonstrates the efficiency of STCBM that a rep-
resentative Gaussian component of CBM can be selected by
giving consideration to long-term tendency and short-term
tendency. Besides, the advantage of STCBM helps to reduce
the computing time used in GBM and increase the recogni-
tion rate of foreground detection.
12 EURASIP Journal on Advances in Signal Processing
Background
380 450 530 590 620
680 700 735 755 840
(a)
Background
380 450 530 590 620
680 700 735 755 840
(b)
Background
380 450 530 590 620
680 700 735 755 840
(c)
Figure 9: The results of foreground detection, (a) original images, (b) the results of pixel classification, where the red color indicates the
shadow, green indicates the highlight, and blue indicates the foreground, (c) the results of background subtraction with shadow removal
using our proposed method, where dark indicates the background and white indicates the foreground.
Table 5: The comparison between the proposed method and that proposed by Hopraser t et al. [13] via foreground detection.
Frame 380 450 530 590 620
Proposed (%
∗
)Hoprasertetal.[13](%
∗
) 90.45 89.18 86.50 85.80 89.38 88.87 88.45 87.72 88.67 88.76
Frame 680 700 735 755 840
Proposed (%
∗
)Hoprasertetal.[13](%
∗
) 91.07 90.62 85.63 85.15 82.76 80.71 92.44 92.46 100.00 99.61
∗
The value in the table means the recognition rate that correct background pixels in a frame divide total pixels in a frame (%).
5. CONCLUSIONS
This work addressed the problem of subtracting the back-
ground from an input image using three models, namely,
the color-based background model (CBM), gradient-based
background model (GBM), and cone-shape illumination
model (CSIM). In the CBM, the elected color-based back-
ground model (ECBM), and candidate color-based model
(CCBM) are defined to increase the ability of recording a
long period of background changes. Short-term color-based
background model (STCBM) and long-term color-based
background model (LTCBM) are defined to improve the
flexibility and robustness of the gradient-based background
subtract ion. Most important, CSIM is proposed to extract
the shadow, and highlight in this paper with a 3D cone-shape
boundary and combined with CBM in the RGB color space.
The threshold values τ
high
and τ
low
of CSIM can be calculated
automatically using the standard deviation of the Gaussian
distribution selected using STCBM and LTCBM. The pro-
posed 3D cone model is compared with the nonparamet-
ric model in a complex indoor environment. The experi-
mental results show the effectiveness of the proposed scheme
for background subtraction with shadow and highlight
removal.
J S. Hu a nd T M. Su 13
Background 500 540 580 620 660 700 740
780 820 860 900 940 980 1020 1060
(a)
Background 500 540 580 620 660 700 740
780 820 860 900 940 980 1020 1060
(b)
Background 500 540 580 620 660 700 740
780 820 860 900 940 980 1020 1060
(c)
Figure 10: The results of background subtraction about dynamic background, (a) original images, (b) the results of pixel classification, where
red color indicates the shadow, green indicates the highlight, and blue indicates the foreground, (c) the results of background subtraction
with shadow removal using our proposed method, where dark indicates the background and white indicates the foreground.
301 360 560 590 670 740
(a)
301 360 560 590 670 740
(b)
301 360 560 590 670 740
(c)
Figure 11: The results of the advantage of STCBM, where the red color means the shadow, the green color means the highlight, and the blue
color means the foreground, (a) original images, (b) the results of background subtraction without STCBM, (c) the results of b ackground
subtraction with STCBM, where red indicates the shadow, green indicates the highlight, and blue indicates the foreground.
14 EURASIP Journal on Advances in Signal Processing
ACKNOWLEDGMENTS
This work was supported by National Science Council of the
ROC under Grant no. NSC93-2218-E009064 and MOE ATU
Program under the account number 95W803E.
REFERENCES
[1] N. Friedman and S. Russell, “Image segmentation in video se-
quences: a probabilistic approach,” in Proceedings of the 13th
Conference Uncertainty in Artificial Intelligence (UAI ’97),pp.
175–181, Providence, RI, USA, August 1997.
[2] C. R. Wren, A. Azarbayejani, T. Darrell, and A. P. Pentland,
“Pfinder: real-time tracking of the human body,” IEEE Trans-
actions on Pattern Analysis and Machine Intelligence, vol. 19,
no. 7, pp. 780–785, 1997.
[3] P. Kaew, P. Trakul, and R. Bowden, “An improved adap-
tive background mixture model for real-time tracking with
shadow detection,” in Proceedings of the 2nd European Work-
shop on Advanced Video-Based Surveillance Systems, Kingston,
UK, September 2001.
[4] C. StaufferandW.E.L.Grimson,“Adaptivebackgroundmix-
ture models for real-time tracking,” in Proceedings of the IEEE
Computer Society Conference on Computer Vision and Pattern
Recognition, vol. 2, pp. 246–252, Fort Collins, Colo, USA, June
1999.
[5] D. Koller, J. Weber, T. Huang, et al., “Towards robust auto-
matic traffic scene analysis in real-time,” in Proceedings of the
33rd IEEE Conference on Decision and Control, vol. 4, pp. 3776–
3781, Lake Buena Vista, Fla, USA, December 1994.
[6]A.Elgammal,R.Duraiswami,D.Harwood,andL.S.Davis,
“Background and foreground modeling using nonparametric
kernel density estimation for visual surveillance,” Proceedings
of the IEEE, vol. 90, no. 7, pp. 1151–1163, 2002.
[7] T. G. Stockham Jr., “Image processing in the context of a visual
model,” Proceedings of the IEEE, vol. 60, no. 7, pp. 828–842,
1972.
[8] P.L.RosinandT.Ellis,“Imagedifference threshold strategies
and shadow detection,” in Proceedings of the 6th British Ma-
chine Vision Conference, pp. 347–356, Birmingham, Ala, USA,
September 1995.
[9] A. Elgammal, D. Harwood, and L. S. Davis, “Non-parametric
Model for Background Subtraction,” in Proceedings of the
6th European Conference on Computer Vision, pp. 751–767,
Dublin, Ireland, June 2000.
[10] T M. Su and J S. Hu, “Background removal in vision servo
system using Gaussian mixture model framework,” in Pro ceed-
ing of IEEE International Conference on Networking, Sensing
and Control, vol. 1, pp. 70–75, Taipei, Taiwan, March 2004.
[11] O. Javed, K. Shafique, and M. Shah, “A hierarchical approach
to robust background subtraction using color and gradient in-
formation,” in Proceedings of IEEE Workshop on Motion and
Video Computing (MOTION ’02), pp. 22–27, Orlando, Fla,
USA, December 2002.
[12] J. B. MacQueen, “Some methods for classification and analysis
of multivariate observations,” in Proceedings of the 5th Berkeley
Symposium on Mathematical Statistics and Probability, vol. 1,
pp. 281–297, Berkeley, Calif, USA, 1967.
[13] T. Hoprasert, D. Harwood, and L. S. Davis, “A statistical
approach for real-time robust background subtraction and
shadow detection,” in Proceedings of the 7th IEEE Interna-
tional Conference on Computer Vision, Frame Rate Workshop
(ICCV ’99), pp. 1–19, Kerkyra, Greece, September 1999.
Jwu-Sheng Hu received the B.S. degree
from the Department of Mechanical En-
gineering, National Taiwan University, Tai-
wan, in 1984, and the M.S. and Ph.D. de-
grees from the Department of Mechani-
cal Engineering, University of California at
Berkeley, in 1988 and 1990, respectively. He
is currently a Professor i n the Department
of Electrical and Control Engineering, Na-
tional Chiao-Tung University, Taiwan. His
current research interests include microphone array signal process-
ing, active noise control, intelligent mobile robots, embedded sys-
tems and applications.
Tzung-Min Su was born in 1978. He re-
ceived the B.S. degree in electrical and con-
trol engineering from National Chiao-Tung
University, Taiwan, in 2000. He is currently
a P h.D. candidate in Department of Elec-
trical and Control Engineering at National
Chiao-Tung University, Taiwan. He is the
Championship of TI DSP S olutions Design
Challenge in 2000 and of the national com-
petition held by Ministry of Education Ad-
visor Office in 2001. His research interests include background sub-
traction, 3D object recognition, home-care surveillance, and mo-
bile robot localization.