POWER QUALITY HARMONICS ANALYSIS AND REAL MEASUREMENTS DATA doc
Bạn đang xem bản rút gọn của tài liệu. Xem và tải ngay bản đầy đủ của tài liệu tại đây (10.78 MB, 290 trang )
POWER QUALITY
HARMONICS ANALYSIS
AND REAL
MEASUREMENTS DATA
Edited by Gregorio Romero Rey
and Luisa Martinez Muneta
Power Quality Harmonics Analysis and Real Measurements Data
Edited by Gregorio Romero Rey and Luisa Martinez Muneta
Published by InTech
Janeza Trdine 9, 51000 Rijeka, Croatia
Copyright © 2011 InTech
All chapters are Open Access distributed under the Creative Commons Attribution 3.0
license, which allows users to download, copy and build upon published articles even for
commercial purposes, as long as the author and publisher are properly credited, which
ensures maximum dissemination and a wider impact of our publications. After this work
has been published by InTech, authors have the right to republish it, in whole or part, in
any publication of which they are the author, and to make other personal use of the
work. Any republication, referencing or personal use of the work must explicitly identify
the original source.
As for readers, this license allows users to download, copy and build upon published
chapters even for commercial purposes, as long as the author and publisher are properly
credited, which ensures maximum dissemination and a wider impact of our publications.
Notice
Statements and opinions expressed in the chapters are these of the individual contributors
and not necessarily those of the editors or publisher. No responsibility is accepted for the
accuracy of information contained in the published chapters. The publisher assumes no
responsibility for any damage or injury to persons or property arising out of the use of any
materials, instructions, methods or ideas contained in the book.
Publishing Process Manager Sandra Bakic
Technical Editor Teodora Smiljanic
Cover Designer InTech Design Team
Image Copyright STILLFX, 2010. Used under license from Shutterstock.com
First published November, 2011
Printed in Croatia
A free online edition of this book is available at www.intechopen.com
Additional hard copies can be obtained from
Power Quality Harmonics Analysis and Real Measurements Data, Edited by Gregorio
Romero Rey and Luisa Martinez Muneta
p. cm.
ISBN 978-953-307-335-4
free online editions of InTech
Books and Journals can be found at
www.intechopen.com
Contents
Preface IX
Part 1 Measurements 1
Chapter 1 Electric Power Systems Harmonics
- Identification and Measurements 3
Soliman Abdelhady Soliman
and Ahmad Mohammad Alkandari
Chapter 2 On the Reliability of Real Measurement Data
for Assessing Power Quality Disturbances 69
Alexandre Brandao Nassif
Chapter 3 Voltage Harmonics Measuring Issues
in Medium Voltage Systems 89
Jarosław Łuszcz
Part 2 Converters 109
Chapter 4 Study of LCC Resonant Transistor DC / DC
Converter with Capacitive Output Filter 111
Nikolay Bankov, Aleksandar Vuchev and Georgi Terziyski
Chapter 5 Thermal Analysis of Power
Semiconductor Converters 131
Adrian Plesca
Part 3 Harmonic Distortion 151
Chapter 6 Improve Power Quality with High Power UPQC 153
Qing Fu, Guilong Ma and Shuhua Chen
Chapter 7 Characterization of Harmonic Resonances
in the Presence of the Steinmetz Circuit
in Power Systems 171
Luis Sainz, Eduardo Caro and Sara Riera
VI Contents
Chapter 8 Stochastic Analysis of the Effect
of Using Harmonic Generators in Power Systems 195
Mohsen Abbas Pour Seyyedi and Amir Hossein Jahanikia
Part 4 Industrial Environments 209
Chapter 9 Harmonics Effect in Industrial
and University Environments 211
M.H. Shwehdi
Chapter 10 Power Quality Problems Generated by Line
Frequency Coreless Induction Furnaces 235
Angela Iagăr
Chapter 11 Harmonic Distortion in Renewable Energy Systems:
Capacitive Couplings 261
Miguel García-Gracia, Nabil El Halabi,
Adrián Alonso and M.Paz Comech
Preface
Nowadays, the rapid growth of power electronics in industry and the presence of
products based on electronic components in enterprises, institutions, shops, small
businesses, residences, etc. and transport systems has been welcomed by the people
who already use it due to its increased productivity within all areas. The problem of
this increasing use of power electronics equipment is the important distortions
originated; the perfect AC power systems are a pure sinusoidal wave, both voltage
and current, but the ever-increasing existence of non-linear loads modify the
characteristics of voltage and current from the ideal sinusoidal wave. This deviation
from the ideal wave is reflected by the harmonics and, although its effects vary
depending on the type of load, it affects the efficiency of an electrical system and can
cause considerable damage to the systems and infrastructures. Logic and electronic
control circuits, among others, may be affected if the supply voltage has distortions,
leading to, for example, damage in the consumer equipment, and noise in the different
installations or unsafe working conditions. In other cases the harmonic current passes
through transmission lines and causes harmonic voltage on the loads connected at the
end of the line, but this will be dealt with in another book.
Ensuring optimal power quality after a good design and devices means productivity,
efficiency, competitiveness and profitability. Nevertheless, nobody can assure the
optimal power quality when there is a good design if the correct testing and working
process from the obtained data is not properly assured at every instant; this entails
processing the real data correctly. To ensure a precise measurement of the electrical
power quantities, different processing techniques are necessary. The possibilities range
from the design of the overall system to the testing and training of devices, checking
the influence of the final design and behaviour laws in a virtual environment similar to
the real one. One properly designed simulator would allow for checking the technical
specifications in order to find contradictions that may be introduced during the design
of the system, and their subsequent correction.
In the following chapters the reader will be introduced to the harmonics analysis from
the real measurement data and to the study of different industrial environments and
electronic devices. The book is divided into four sections: measurements, converters,
harmonic distortion, and industrial environments; a brief discussion of each chapter is
as follows.
X Preface
Chapter 1 discusses the sources of harmonics and the problems caused to the power
systems, and also model the voltage and current signal to account for the harmonics
components when the signal is a non-sinusoidal signal. Additionally, it estimates the
parameters of this signal in order to suppress the harmonics or eliminate some of
them, and identifies and measures the sub-harmonics. Finally, it models the harmonic
signals as fuzzy signals, identifying the parameters by using static and dynamic
algorithms. Chapter 2 encompasses the poor reliability of the real measured data used
for several applications dealing with power quality disturbances, and proposes a set of
reliability criteria to determine the data quality, which can be directly applied to
recorded data and used to determine which data are to be used for further processing,
and which data should be discarded. Chapter 3 presents the problems of voltage
transformers and voltage harmonic transfer accuracy, which are usually used for
power quality monitoring in medium and high voltage grids. Additionally, a
simplified lumped parameters circuit model of the voltage transformer is proposed
and verified by simulation and experimental research.
In Chapter 4 a transistor LCC resonant DC/DC converter of electrical energy is
studied, working at frequencies higher than the resonant one. It is analyzed due to the
possible operating modes of the converter with accounting the influence of the
damping capacitors and the parameters of the matching transformer, drawing the
boundary curves between the different operating modes of the converter in the plane
of the output characteristics, as well as outlining the area of natural commutation of
the controllable switches. Finally, a laboratory prototype of the converter under
consideration is built after suggesting a methodology for designing it. Chapter 5
investigates the thermal behaviour of the power semiconductor as a component part of
the power converter (rectifier or inverter), and not as an isolated part, from different
structures of power rectifiers. To do this, the parametric simulations for the transient
thermal conditions of some typical power rectifiers are presented and the 3D thermal
modelling and simulations of a power device as main component of power converters
are described too.
Chapter 6 discusses the principle and control method of a Unified Power Quality
Conditioner (UPQC), mainly used in low-voltage low-capacity applications and effective
in reducing both harmonic voltage and harmonic current, but applied in this case to high
power nonlinear loads. In this UPQC, a shunt Active Power Filter (APF) is connected to
a series LC resonance circuit in grid fundamental frequency so as to make a shunt APF in
lower voltage and lower power, and uses a hybrid APF which includes a Passive Power
Filter (PPF). Chapter 7 summarizes the research of parallel and series resonances and
unifies the study providing a similar expression to the series resonance case, but
substantially improved for the parallel resonance case, and unique to their location. It is
completed with the analysis of the impact of the Steinmetz circuit inductor resistance on
the resonance and a sensitivity analysis of all variables involved in the location of the
parallel and series resonance. Finally, the chapter ends with several experimental tests to
validate the proposed expression and several examples of its application. Chapter 8
Preface XI
presents a generic stochastic analysis to model the effect of nonlinear electronic devices
in power distribution systems by using circuit models comprising several passive
current sources for the electronic devices. The chapter also analyzes different
combinations of loads and transmission lines and results in a method for performing the
primary estimations for the planning and dimensioning of power systems with the
flexibility of being able to choose the numbers of different devices.
Chapter 9 discuses the importance of harmonic measurements and how this affects
and causes problems if higher Total Harmonic Distortion (THD) levels are detected
and also how to sort out the order of harmonic from such harmonics emitting devices.
Different harmonics and effects will be shown in the chapter on a real practical
investigation in harmonics produced in an industrial plant with an arc furnace, mainly
used in steel production for the recycling of scrap, as well as in the university due to
the increasing numbers of personal computers, providing different environments.
Chapter 10 studies the power quality problems caused by the operation of line
frequency coreless induction furnaces, which introduces imbalances that lead to
increasing power and active energy losses in the network. The literature does not offer
detailed information regarding the harmonic distortion in the case of these furnaces
and important conclusions are obtained, such as the introduction of harmonic filters in
the primary of the furnace transformer to solve the power interface problems or the
addition of a load balancing system at the connection point of the furnace to the power
supply network to eliminate the imbalance. Finally, in Chapter 11 a Distributed
Generation (DG) installation is modelled detailing the capacitive coupling of the
electric circuit with the grounding system. The capacitive grounding models for Solar
Photovoltaic (PV) installations and wind farms are detailed, which allows analyzing
the current distortion, ground losses and Ground Potential Rise (GPR) due to the
capacitive coupling. The combined effect of the different distributed generation
sources connected to the same electric network has been simulated to minimize the
capacitive ground current in these installations for meeting typical power quality
regulations concerning harmonic distortion and safety conditions.
We hope that after reading the different sections of this book we will have succeeded
in bringing across what the scientific community is doing in the field of Power Quality
and that it will have been to your interest and liking.
Lastly, we would like to thank all the authors for their excellent contributions in the
different areas of Power Quality.
Dr. Gregorio Romero Rey
Dra. Mª Luisa Martinez Muneta
Universidad Politécnica de Madrid
Spain
Part 1
Measurements
1
Electric Power Systems Harmonics -
Identification and Measurements
Soliman Abdelhady Soliman
1
and Ahmad Mohammad Alkandari
2
1
Misr University for Science and Technology,
2
College of Technological Studies,
1
Egypt
2
Kuwait
1. Introduction
The presence of non-linear loads and the increasing number of distributed generation power
systems (DGPS) in electrical grids contribute to change the characteristics of voltage and
current waveforms in power systems, which differ from pure sinusoidal constant amplitude
signals. Under these conditions advanced signal processing techniques are required for
accurate measurement of electrical power quantities. The impact of non-linear loads in
electrical power systems has been increasing during the last decades. Such electrical loads,
which introduce non-sinusoidal current consumption patterns (current harmonics), can be
found in rectification front-ends in motor drives, electronic ballasts for discharge lamps,
personal computers or electrical appliances. Harmonics in power systems mean the
existence of signals, superimposed on the fundamental signal, whose frequencies are integer
numbers of the fundamental frequency. The electric utility companies should supply their
customers with a supply having a constant frequency equal to the fundamental frequency,
50/60 Hz, and having a constant magnitude. The presence of harmonics in the voltage or
current waveform leads to a distorted signal for voltage or current, and the signal becomes
non-sinusoidal signal which it should not be. Thus the study of power system harmonics is
an important subject for power engineers.
The power system harmonics problem is not a new problem; it has been noticed since the
establishment of the ac generators, where distorted voltage and current waveforms were
observed in the thirtieth of 20
th
century [2].
Concern for waveform distortion should be shared by all electrical engineers in order to
establish the right balance between exercising control by distortion and keeping distortion
under control. There is a need for early co-ordination of decisions between the interested
parties, in order to achieve acceptable economical solutions and should be discussed
between manufacturers, power supply and communication authorities [1].
Electricity supply authorities normally abrogate responsibility on harmonic matters by
introducing standards or recommendations for the limitation of voltage harmonic levels at
the points of common coupling between consumers.
Power Quality Harmonics Analysis and Real Measurements Data
4
2. Sources and problems of harmonics [2]
Harmonic sources are divided into two categories:
1. Established and known
2. New and Future
A review of the literature indicates that the known sources of harmonics include:
1. Tooth ripple or ripples in the voltage waveform of rotating machines.
2. Variations in air-gap reluctance over synchronous machine pole pitch.
3. Flux distortion in the synchronous machine from sudden load changes.
4. Non-sinusoidal distribution of the flux in the air gap of synchronous machines.
5. Transformer magnetizing currents.
6. Network nonlinearities from loads such as rectifiers, inverters, welders, arc furnaces,
voltage controllers, frequency converters, etc.
While the established sources of harmonics are still present on the system, the power
network is also subjected to new harmonic sources:
1. Energy conservation measures, such as those for improved motor efficiency and load
matching, which employ power semiconductor devices and switching for their
operation. These devices often produce irregular voltage and current waveforms that
are rich in harmonics.
2. Motor control devices such as speed controls for traction.
3. High-voltage direct-current power conversion and transmission.
4. Interconnection of wind and solar power converters with distribution systems.
5. Static var compensators which have largely replaced synchronous condensors as
continuously variable-var sources.
6. The development and potentially wide use of electric vehicles that require a significant
amount of power rectification for battery charging.
7. The potential use of direct energy conversion devices, such as magneto-hydrodynamics,
storage batteries, and fuel cells that require dc/ac power converters.
8. Cyclo-converters used for low-speed high-torque machines.
9. Pulse-burst-modulated heating elements for large furnaces.
Today’s power system harmonic problems can be traced to a number of factors:
1. The substantial increase of nonlinear loads resulting from new technologies such as
silicon-controlled rectifiers (SCRs), power transistors, and microprocessor controls
which create load-generated harmonics throughout the system.
2. A change in equipment design philosophy. In the past, equipment designs tended to be
under-rated or over-designed. Now, in order to be competitive, power devices and
equipment are more critically designed and, in the case of iron-core devices, their
operating points are more into nonlinear regions. Operation in these regions results in a
sharp rise in harmonics.
The most damaging frequencies to power devices and machines appear to be the lower –
below 5-kHz – frequency range. In years past, the magnitudes and sources of these lower-
frequency harmonics were limited and, inmost cases, power systems could tolerate them.
The increase in power loss due to harmonics was also neglected because energy costs were
low. These conditions no longer apply, and concern for harmonics is now becoming
widespread among utilities.
For more Than 100 years, harmonics have been reported to cause operational problems to
the power systems. Some of the major effects include:
Electric Power Systems Harmonics - Identification and Measurements
5
1. Capacitor bank failure from dielectric breakdown or reactive power overload.
2. Interference with ripple control and power line carrier systems, causing mis-operation
of systems which accomplish remote switching, load control, and metering.
3. Excessive losses in – and heating of – induction and synchronous machines.
4. Over voltages and excessive currents on the system from resonance to harmonic
voltages or currents on the network.
5. Dielectric breakdown of insulated cables resulting from harmonic over voltages on the
system.
6. Inductive interference with telecommunications systems.
7. Errors in induction kWh meters.
8. Signal interference and relay malfunction, particularly in solid-state and
microprocessor-controlled systems.
9. Interference with large motor controllers and power plant excitation systems. (Reported
to cause motor problems as well as non-uniform output.)
10. Mechanical oscillations of induction and synchronous machines.
11. Unstable operation of firing circuits based on zero voltage crossing detection or
latching.
These effects depend, of course, on the harmonic source, its location on the power system,
and the network characteristics that promote propagation of harmonics.
3. Estimation of harmonics and sub-harmonics; the static case
3.1 Time domain model [3]
In this model, it is assumed that the waveform under consideration consists of a
fundamental frequency component and harmonic components with order of integral
multiples of the fundamental frequency. It is also assumed that the frequency is known and
constant during the estimation period. Consider a non-sinusoidal voltage given by a
Fourier-type equation:
0
0
sin
N
nn
n
vt V n t
(1)
where
v(t) is the instantaneous voltage at time t (s.)
V
n
is the voltage amplitude of harmonic n
n
is the phase angle of harmonic n
0
is the fundamental frequency
n order of harmonic
N total number of harmonics
Equation (1) can be written as
00
0
() ( cos sin sin cos )
N
nn nn
n
vt V t V t
(2)
Define
cos
nn n
xV
(3a)
Power Quality Harmonics Analysis and Real Measurements Data
6
sin
nn n
yV
(3b)
Then, equation (2) can be written as
00
0
sin cos
N
nn
n
vt x n t y n t
(4)
If the voltage signal v(t) is sampled at a pre-selected rate, say t, then m samples would be
obtained at t
1
, t
2
= t
1
+ t, t
3
= t
1
+ 2t, …, t
m
= t
1
+ (m – 1)t. Then, after expanding equation
(4), it can be written as
0
11 1 12 1 12 1 1
1
1
21 2 22 2 22 1 2
2 1
12 21
N
N
m
mm mm mN m
N
y
at at a t
vt
x
at at a t
vt y
vt
at at a t
y
(5)
where the elements of the A matrix are the sine and cosine expansion of equation (4). In the
a’s vector form, equation (5) can be written as
vv
v
Zt At t
(6)
where
Z
v
(t) is m 1 vector of sampled voltage measurement, A(t) is m (2N + 1) matrix of
measurement coefficients,
v
is (2N +1) vector to be estimated,
v
(t) is m 1 error vector to
be minimized. The order of the matrix A(t) depends n the number of harmonics to be
estimated. Furthermore, the elements of the matrix
A(t) depend on the initial sampling time
t
1
the sampling rate t and the data window size used in the estimation process. The matrix
A (t) can be calculated on off-line and stored.
At least (2
N + 1) samples are required to solve the problem formulated in (6). Using 2N + 1
samples may produce a poor estimate, since we force
v
(t) to be zero. We assume that m >
2
N +1, so that equation (4) represents over determined set of equations.
3.1.1 Time domain estimation; least error squares estimation (LES)
The solution to the over determined set of equations of (6) in the LES sense is given by
1
*
TT
v
v
v
AtAt AtZt
AtZt
(7)
where
1
() [ () ()] ()
TT
At AtAt At
is the left pseudo inverse. Having obtained the
*
v
, the
magnitude of any harmonic of order
n can be calculated as
1
22
2
nnn
Vxn
; 1, ,nN
(8)
while the phase angle of the
nth harmonic is:
1
tan
n
n
n
y
x
(9)
Electric Power Systems Harmonics - Identification and Measurements
7
The above estimation procedures are simple and straight forward if the voltage and/or
current waveforms under investigation are stationary and in steady state, but if there is a
sudden variation in the power system operation, transient operation, such as fault, lighting
and sudden loading to the system or sudden switching off a large load, the voltage signal
waveform may contain, for a few cycles, a dc component, which if it is neglected, will affect
the harmonics estimation content in the waveform. To overcome this problem, the voltage
signal in equation (1) may be remodeled to take into account the dc component as [4]
00
1
sin
N
t
n
n
vt Ve V n t
(10)
where
V
0
is the amplitude of decaying dc component at t = 0
Is the time constant of the decaying dc component
The exponential term in equation (10) can be expanded using Taylor series and its first two
terms can be used as
0
00
1
sin
N
nn
n
V
vt V t V n t
(11)
Define the new parameters
11 0
xV
(12a)
0
12
V
x
(12b)
Then, equation (11) can be written as
11 12 0 0
1
sin cos
N
nn
n
vt x tx x n t
y
nt
(13)
If the voltage v(t) is samples at a pre-selected rate t, then m sample would be obtained at t
1
,
t
2
= t
1
+ t, …, t
m
= 1 + (m – 1)t, in this case equation (13) becomes
Zt BtY t
(14)
where
Z(t) is the m 1 voltage samples
B(t) is m (2N +2) measurement matrix whose elements depend on the initial and
sampling times and its order depends on the number of harmonics and the number of
terms chosen from Taylor series expansion for the exponential term.
Y is (2N +2) 1 parameters vector to be estimated
containing x
11
, x
12
and xn, yn,
(t) is m 1 error vector to be minimized.
If m > (2N +2), we obtain over determined set of equation and the non-recursive least error
square algorithm can be used to solve this system of equation as
1
*
TT
YBtBtBtZt
(15)
Power Quality Harmonics Analysis and Real Measurements Data
8
Having obtained the parameters vector Y
*
, the harmonics magnitude and phase angle can be
obtained as
1
22
2
nnn
Vxy
(16)
1
tan
n
n
n
y
x
(17)
while the parameters of the dc component can be calculated as
011
Vx
(18a)
11
12
x
x
(18b)
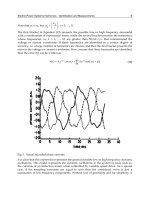
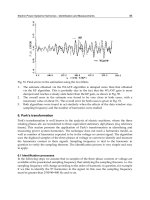
Figure 1 gives actual recorded data for a three-phase dynamic load. The load is a variable
frequency drive controlling a 3000 HP induction motor connected to an oil pipeline
compressor [5]. Examining this curve reveals the following: (a) the waveform of the phase
currents are not periodical; (b) there are low-frequency transients, which have frequencies
not an integer number of the fundamental, we call them sub-harmonics, contaminating
these waveforms, especially in the tips of the wave; and (c) the phase currents are not
symmetrical. It can be concluded from these remarks that this waveform is contaminated
with harmonics, as well as low frequency transients, this is due to the power electronic
devices associated with the load.
3.2 Modeling of sub-harmonics in time domain
The sub-harmonics is a noise contaminated with a signal and having frequency which is not
a multiple from the fundamental frequency (50/60 Hz), as given in equation (19). To
measure these sub-harmonics, an accurate model is needed to present the voltage and
current waves:
Assume the voltage or current waveform is contaminated with both harmonics and sub-
harmonics. Then, the waveform can be written as
1
11
21
() cos cos cos
NM
tit
iiikkk
ik
ft Ae wt Ae wt B wt
(19)
where
A
1
, A
2
, …, A
N
are the sub-harmonics magnitude
B
1
, B
2
, …, B
k
are the harmonics magnitude
1
,
2
, …,
N
are the damping constants
i
; i = 1, …, N are the sub-harmonic phase angles
k
; k = 1, …, M are the harmonic phase angles
w
i
; i=1, …, N are the sub-harmonic frequencies, assumed to be identified in the
frequency domain
w
k
; k = 1, …, M are the harmonic frequencies assumed to be identified also in the
frequency domain.
Electric Power Systems Harmonics - Identification and Measurements
9
Note that w
i
w
k
, but
1
w
w
i
i
, i = 3, …, N.
The first bracket in Equation (19) presents the possible low or high frequency sinusoidal
with a combination of exponential terms, while the second bracket presents the harmonics,
whose frequencies, w
k
, k = 1, …, M, are greater than 50/60 c/s, that contaminated the
voltage or current waveforms. If these harmonics are identified to a certain degree of
accuracy, i.e. a large number of harmonics are chosen, and then the first bracket presents the
error in the voltage or current waveforms. Now, assume that these harmonics are identified,
then the error e(t) can be written as
1
11
2
cos cos
N
tit
iii
i
et Ae wt Ae wt
(20)
Fig. 1. Actual recorded phase currents.
It is clear that this expression represents the general possible low or high frequency dynamic
oscillations. This model represents the dynamic oscillations in the system in cases such as,
the currents of an induction motor when controlled by variable speed drive. As a special
case, if the sampling constants are equal to zero then the considered wave is just a
summation of low frequency components. Without loss of generality and for simplicity, it
Power Quality Harmonics Analysis and Real Measurements Data
10
can be assumed that only two modes of equation (21) are considered, then the error e(t) can
be written as (21)
12
11222
cos cos
tt
et Ae wt Ae wt
(21)
Using the well-known trigonometric identity
22 2 2 2 2
cos cos cos sin sinwt wt wt
then equation (21) can be rewritten as:
12 2
11 222 222
cos cos cos sin sin
tt t
et Ae wt e wtA e wtA
(22)
It is obvious that equation (22) is a nonlinear function of A’s,
’s and
’s. By using the first
two terms in the Taylor series expansion A
i
e
it
; i = 1,2. Equation (22) turns out to be
11 111 222 222
22 2 222
cos cos cos cos cos cos
sin sin sin sin
et A wt t wt A wt A t wt A
wt A t wt A
2
2
(23)
where the Taylor series expansion is given by:
1
t
et
Making the following substitutions in equation (23),
equation (26) can be obtained,
11 211
32 2 422 2
52 2 622 2
;
cos ; cos
sin ; sin
xA xA
xA xA
xA xA
(24)
and
11 1 12 1
13 2 14 2
15 2 16 2
cos ; cos
cos ; cos
sin ; sin
ht wt ht t wt
ht wt ht t wt
ht wt ht t wt
(25)
11 1 12 2 13 3 14 3 15 4 16 5
et h tx h tx h tx h tx h tx h tx (26)
If the function
f (t) is sampled at a pre-selected rate, its samples would be obtained at equal
time intervals, say
t seconds. Considering m samples, then there will be a set of m
equations with an arbitrary time reference
t
1
given by
1111 121 161
1
2212 222 262
12 6
mmmmm mm
et h t h t h t
x
et ht ht ht
x
et h t h t h t
2
6
x
(27)
Electric Power Systems Harmonics - Identification and Measurements
11
It is clear that this set of equations is similar to the set of equations given by equation (5).
Thus an equation similar to (6) can be written as:
zt Ht t t
(28)
where
z(t) is the vector of sampled measurements, H(t) is an m 6, in this simple case,
matrix of measurement coefficients,
(t) is a 6 1 parameter vector to be estimated, and
(t)
is an
m 1 noise vector to be minimized. The dimensions of the previous matrices depend
on the number of modes considered, as well as, the number of terms truncated from the
Taylor series.
3.2.1 Least error squares estimation
The solution to equation (28) based on LES is given as
1
*
TT
tHtHtHtZt
(29)
Having obtained the parameters vector
*
(t), then the sub-harmonics parameters can be
obtained as
*
*
2
11 1
*
1
,
x
Ax
x
(30)
1
*
*2 *2
4
2
235 2
*
3
,
x
Axx
x
(31)
**
56
2
**
34
tan
xx
xx
(32)
3.2.2 Recursive least error squares estimates
In the least error squares estimates explained in the previous section, the estimated
parameters, in the three cases, take the form of
1
*
1
1
m
nm m
n
AZ
(33)
where [A]
+
is the left pseudo inverse of [A] = [A
T
A]
-1
A
T
, the superscript “m – 1” in the
equation represents the estimates calculated using data taken from t = t
1
to t = t
1
+ (m – 1)t
s, t
1
is the initial sampling time. The elements of the matrix [A] are functions of the time
reference, initial sampling time, and the sampling rate used. Since these are selected in
advance, the left pseudo inverse of [A] can be determined for an application off-line.
Equation 33 represents, as we said earlier, a non recursive least error squares (LES) filter that
uses a data window of m samples to provide an estimate of the unknowns,
. The estimates
of [
] are calculated by taking the row products of the matrix [A]
+
with the m samples. A
new sample is included in the data window at each sampling interval and the oldest sample
is discarded. The new [A]
+
for the latest m samples is calculated and the estimates of [
] are
Power Quality Harmonics Analysis and Real Measurements Data
12
updated by taking the row products of the updated [A]
+
with the latest m samples.
However, equation (33) can be modified to a recursive form which is computationally more
efficient.
Recall that equation
11mmnn
ZA
(34)
represents a set of equations in which [Z] is a vector of m current samples taken at intervals
of t seconds. The elements of the matrix [A] are known. At time t = t
1
+ mt a new sample
is taken. Then equation (33) can be written as
*
1
1
m
n
mi m
nmH
mH
Z
A
aZ
(35)
where the superscript “m” represents the new estimate at time t = t
1
+ mt. It is possible to
express the new estimates obtained from equation (34) in terms of older estimates (obtained
from equation (33)) and the latest sample Z
m
as follows
11
** *
mm m
mZ a
mmi
(36a)
This equation represents a recursive least squares filter. The estimates of the vector [
] at t =
t
1
+ mt are expressed as a function of the estimates at t = t
1
+ (m – 1)t and the term
1
*
m
Za
mmi
. The elements of the vector, [
(m)], are the time-invariant gains
of the recursive least squares filter and are given as
1
11
TT
TT
mAA a Ia AA a
mi mi mi
(36b)
3.2.3 Least absolute value estimates (LAV) algorithm (Soliman & Christensen
algorithm) [3]
The LAV estimation algorithm can be used to estimate the parameters vectors. For the
reader’s convenience, we explain here the steps behind this algorithm.
Given the observation equation in the form of that given in (28) as
Zt At t
The steps in this algorithm are:
Step 1. Calculate the LES solution given by
*
At Zt
,
1
TT
At A tAt A t
Step 2. Calculate the LES residuals vector generated from this solution as
Electric Power Systems Harmonics - Identification and Measurements
13
*
rZtAtAtZt
Step 3. Calculated the standard deviation of this residual vector as
1
2
2
1
1
1
m
i
i
rr
mn
Where
1
1
m
i
i
rr
m
, the average residual
Step 4. Reject the measurements having residuals greater than the standard deviation, and
recalculate the LES solution
Step 5. Recalculated the least error squares residuals generated from this new solution
Step 6. Rank the residual and select n measurements corresponding to the smallest
residuals
Step 7. Solve for the LAV estimates
ˆ
as
1
*
1
1
ˆ
ˆˆ
n
n
nn
A
tZt
Step 8. Calculate the LAV residual generated from this solution
3.3 Computer simulated tests
Ref. 6 carried out a comparative study for power system harmonic estimation. Three
algorithms are used in this study; LES, LAV, and discrete Fourier transform (DFT). The data
used in this study are real data from a three-phase six pulse converter. The three techniques
are thoroughly analyzed and compared in terms of standard deviation, number of samples
and sampling frequency.
For the purpose of this study, the voltage signal is considered to contain up to the 13
th
harmonics. Higher order harmonics are neglected. The rms voltage components are given in
Table 1.
RMS voltage components corresponding to the harmonics
Harmonic
frequency
Fundamental 5
th
7
th
11
th
13
th
Voltage
magnitude
(p.u.)
0.95–2.02 0.0982. 0.0438.9 0.030212.9 0.033162.6
Table 1.
Figure 2 shows the A.C. voltage waveform at the converter terminal. The degree of the
distortion depends on the order of the harmonics considered as well as the system
characteristics. Figure 3 shows the spectrum of the converter bus bar voltage.
The variables to be estimated are the magnitudes of each voltage harmonic from the
fundamental to the 13
th
harmonic. The estimation is performed by the three techniques
while several parameters are changed and varied. These parameters are the standard
