IR and Raman Spectroscopy Fundamental Processing docx
Bạn đang xem bản rút gọn của tài liệu. Xem và tải ngay bản đầy đủ của tài liệu tại đây (9.36 MB, 184 trang )
Siegfried Wartewig
IR
and
Raman Spectroscopy
IR
and
Raman Spectroscopy: Fundamental Processing. Siegfried Wartewig
Copyright
©
2003
WILEY-VCH
Verlag GmbH
& Co.
KGaA,
Weinheim
ISBN
3-527-30245-X
Spectroscopic
Techniques:
An
Interactive Course
Siegfried
Wartewig
IR
and
Raman Spectroscopy
Fundamental Processing
2003, ISBN 3-527-30245-X
Christian Schorn
NMR
Spectroscopy: Data Acquisition
2001,
ISBN 3-527-28827-9
Peter
Bigler
NMR
Spectroscopy: Processing
Strategies
Second
Updated
Edition
2000, ISBN 3-527-29990-4
Ursula
Weber/Herbert
Thiele
NMR
Spectroscopy:
Modern
Spectral
Analysis
1998, ISBN 3-527-28828-7
Erno
Pretsch
/
Jean-Thomas
Clerc
Spectra
Interpretation
of
Organic
Comp^nds
\
1997, ISBN 3-527-28826-0
Siegfried
Wartewig
IR
and
Raman Spectroscopy
Fundamental Processing
WILEY-
VCH
WILEY-VCH
GmbH
&
Co.
KGaA
Prof.
Dr.
Siegfried
Wartewig
Institute
of
Applied Dermatopharmacy
Martin-Luther-University Halle-Wittenberg
Wolfgang-Langenbeck-Strasse
4
06120 Halle-Wittenberg
Germany
This book
and
CD-ROM were
carefully
produced. Nevertheless, editors, authors
and
publisher
do not
warrant
the
information contained therein
to be
free
of
errors. Readers
are
advised
to
keep
in
mind that statements, data, illustrations, procedural details
or
other items
may
inad-
vertently
be
inaccurate.
A
CD-ROM containing
a
demo version
of the
program
OPUS
(©
Bruker Optik
GmbH,
Rudolf-Plank-
Strasse
23,
D-76275 Ettlingen, Germany)
is
enclosed.
Library
of
Congress Card
No.
applied
for
A
catalogue record
for
this book
is
available
from
the
British Library.
Bibliographic information published
by Die
Deutsche Bibliothek
Die
Deutsche Bibliothek lists this publication
in the
Deutsche Nationalbibliografie; detailed biblio-
graphic
data
is
available
in the
Internet
at
©
2003
WILEY-VCH
Verlag GmbH
& Co.
KGaA, Weinheim
All
rights reserved (including those
of
translation
in
other languages).
No
part
of
this book
may be
reproduced
in any
form
- by
photoprinting, microfilm,
or any
other means
- nor
transmitted
or
trans-
lated into machine language without written permission
from
the
publishers. Registered names, trade-
marks, etc. used
in
this
book,
even when
not
specifically marked
as
such,
are not to be
considered
unprotected
by
law.
Printed
in the
Federal
Republic
of
Germany.
Printed
ion
acid-free paper.
Typesetting
Hagedorn Kommunikation, Viernheim
Printing
betz-druck gmbh, Darmstadt
ISBN
3-527-30245-X
Contents
Preface
IX
Acknowledgments
X
1
Introduction
1
2
Your
Personal "OPUS Workstation"
3
2.1
Technical Requirements
3
2.2
Installing OPUS
4
2.3
Starting OPUS
4
3
OPUS Basics
9
3.1
Loading
and
Selecting
a
File
10
3.2 The
Browser Window
13
3.3 The
Spectrum Window
15
3.4 The
Report Window
22
3.5
Choosing
a
Spectral Range
22
3.6 The
Toolbars
26
4
Basic Principles
of
Vibrational Spectroscopy
27
4.1
Molecular Vibrations
27
4.2 The
Infrared
Spectrum
29
4.3 The
Raman Spectrum
30
5
Fourier Transform Technique
35
5.1
The
Michelson Interferometer
35
5.2
Advantages
of
Fourier Transform Spectroscopy
37
5.2.1
Connes Advantage
37
5.2.2 Jacquinot Advantage
40
5.2.3 Fellget Advantage
40
5.3
Discrete Fourier Transformation
40
5.3.1
Picket Fence
Effect:
Zerofilling
41
5.3.2 Aliasing
41
5.4
Effect
of the
Finite Record Length: Leakage
and
Apodization
42
5.5
Phase Correction
48
VI
Contents
5.6
Acquisition
49
5.7
Raman Spectroscopy: Interferometer versus
Grating Technique
50
6
Files
53
6.1
Loading
a
File
53
6.2
Unloading
a
File
53
6.3
Undo Changes
54
6.4
Deleting Data Blocks
54
6.5
Scan
and
Find OPUS
Files
55
6.6
Clone Entry
and
Clone Original
57
6.7 Add
Comment
57
6.8
Open
58
6.9
Printing
58
6.10 Print
Preview
58
6.11 Print Setup
58
7
Edit
61
7.1
Edit Parameter
61
7.2
Information Input
62
7.3
Creating
an
Information Mask
64
7.4
Copy
66
8
View
67
8.1
Toolbars
67
8.2
Status
Bar 70
8.3
Browser
70
9
Window
71
9.1
New
Spectrum Window
71
9.2 New
Report Window
71
9.3
Cascade
and
Tile
Windows
72
10
Manipulating
75
10.1 Baseline Correction
76
10.2 Spectrum Subtraction
79
10.3 Conversion
of
IR
Spectra
83
10.4 Straight Line Generation
85
10.5 Spectrum Calculator
85
10.6
Cut 88
10.7 Normalization
89
10.8 Make Compatible
91
10.9
Spectrum Conversion
92
10.9.1
Conversion
to
Kubelka-Munk:
AB, TR,
REFL
->
KM 93
10.9.2
Conversion
to
Reflectance Spectra:
KM
-^
REFL
93
Contents
VII
10.9.3 Conversion
to ATR
Spectra:
AB, TR
->
ATR 93
10.9.4 Conversion
to
Absorbance Spectra:
ATR
—>
AB 93
10.9.5 Taking
the
Logarithm
of
Spectra:
Refl
-»
Ig/te/Z
93
10.9.6
Conversion
of
Spectra
in
Logarithms:
IgRefl
—>
7te/Z
94
10.9.7
Conversion
of
Single Channel Raman Spectra: ScSm
—>
Raman
94
10.9.8 Conversion
of
Raman Spectra: Raman
—»
ScSra
94
10.10 Smooth
94
10.11 Derivative
96
10.12
Wavenumber Calibration
98
10.13 Raman Correction
100
10.14 Blackbody
102
10.15 Conversion
from
Interferogram
to
Spectrum
104
10.16
Inverse Fourier Transformation
110
10.17
Post Zerofilling
110
10.18
Fourier Self Deconvolution
111
10.19
Symmetric Fourier Transformation
114
10.20 Abscissa Conversion
115
10.21 Averaging
of
Spectra
119
10.22 Merging Spectra Ranges
122
11
Evaluating
125
11.1 Curve
Fit 125
11.1.1
B
and
Parameters
127
11.1.2 Band Shape
127
11.1.3
Baseline
128
11.1.4
Band
List
128
11.1.5 Algorithm
128
11.1.6
Status Line
128
11.1.7
Max
Iter.
Time
(s) 128
11.1.8
Auto
Fit 129
11.1.9 Save Report
129
11.1.10
Save
Peaks
and
Reps
129
11.1.11
Some Examples
of
Curve Fitting
129
11.1.11.1
Finding
the
Shape
of a
Single Band
129
11.1.11.2
Decomposition
of Two
Overlapping Bands
129
11.1.11.3
Decomposition
of a
Complex Spectral Feature
132
11.1.12
Theoretical Background
132
11.1.12.1
General Procedure
13
3
11.1.12.2
Criteria
for the
Selection
of an
Algorithm
133
11.2
Integration
134
11.3 Peak Identification
139
11.4 Quick Identity Test
145
11.5 Spectrum Search
148
11.6
Editing Libraries
154
11.7 Library Browser
157
VIII
Contents
12
Display
159
12.1 Back
and
Forward
159
12.2 Stacked
159
12.3 Scale
All and
Scale
Y 161
12.4 Page Forward
and
Page Backward
161
13
163
13.1
Defining
Print Parameters
163
13.2 Print Spectra
163
13.3 Quick Print
167
13.4
and
Print Preview
167
Bibliography
169
Index
171
Preface
At
present, vibrational spectroscopy
is
undergoing
a
renaissance stimulated
by
many
new
developments
in
infrared
and
Raman instrumentation, such
as
high
sensitive detectors, charge-coupled devices (CCD)
and
array detectors, laser
excitation sources, step-scan technique, photoacoustic detection, spectral depth
profiling,
light-fiber optics, mapping
and
imaging
in the
field
of
microscopy,
time resolved
and
surface-enhanced methods
- in
order
to
mention
a few of
these
significant
improvements.
Of
course this progress
in
vibrational spectro-
scopy
is
closely connected with
the
enormous development
in
computer tech-
nique.
These developments have created novel applications
of
IR
and
Raman
spectroscopy
in
various scientific disciplines ranging
from
chemistry
and
phy-
sics
to
bioscience
and
medicine.
On
the
other hand, handling, manipulating
and
evaluating
of IR and
Raman
spectra,
to say
nothing
of
interpretation, remain
as an old
problem.
For
this pur-
pose modern spectrometers
are
equipped with relevant
powerful
software
packages. However, according
to our
experience
it
takes time
to be
familiar
with
all
tools
of
such spectroscopic software. That
is why the
objective
of
this
interactive course
as
interplay
of
text,
software
and
spectra data
is to
teach
you
in
fundamental
manipulating
and
evaluating
of
vibrational spectra.
It is
the
first
volume
in the
WILEY-VCH
series
Spectroscopic
Techniques,
which
deals with
fundamental
processing
of IR and
Raman spectroscopy. Certainly,
further
volumes covering other topics
of
practical vibrational spectroscopy
will
follow
in
future.
The
audience
for
this interactive course should mainly include graduate
students
and
technicians
who are
newcomers
to IR and
Raman spectroscopy.
Hopefully,
this book will also
be of
much benefit
for
practitioners
in the
daily
work
of a
spectroscopic laboratory.
Leipzig, March
2003
Siegfried
Wartewig
Acknowledgments
First
and
foremost,
I
thank
my
wife
for her
patience
and
understanding during
the
long process
of
writing this
book.
I
would like
to
express
my
gratitude
to
BRUKER OPTICS
for
their interest
in
this project
and
providing
the
software OPUS.
I am
deeply indebted
to
Dr.
Heinrich Somberg
for
many
helpful
discussions.
Finally,
I
appreciate
the
efforts
of Dr.
Gudrun Walter,
Wiley-VCH,
with
preparing this book. Rosemary Whitelock
did a
great
job to
improve
the
English.
1 Introduction
Nowadays, many analytical laboratories are equipped with an infrared (IR) and a
Raman spectrometer, be it a dispersive device or a Fourier tran sform (FT) instru-
ment. Raman and IR spectra provide images of molecular vibrations that com-
plement each other and thus both spectroscopic techniques together are also
called vibrational spectroscopy. The concerted evaluation of both spectra gives
more information about the molecular structure than when they are evaluated
separately.
Over the last years, there has been tremendous technical improvement in
Raman and IR spectrometer design. For a newcomer to the field of vibrational
spectroscopy, a modern spectrometer, whether it is a routine or a research-
grade instrument, looks li ke a black box driven by a personal compute r with
very complex software. It is now state of the art that every spectrometer manu-
facturer provides specific software packages for data acquisition, both control-
ling the spectrometer and manipulating and evaluating the spectra. Often such
software looks so sophisticated that this can be frustrating, not only for a newco-
mer. This book is intended to help you to overcome this problem and to under-
stand the fundamental processing of vibr ational spectra. It should enable and
encourage you to process your data according to your own special needs.
The approach of t he text is f rom the pe rspective of a spectroscopis t invol ved in
the daily work of a laboratory. The basis is the spectroscopic software OPUS
developed by Bruker Optik GmbH (Ettlingen, Germany). The acronym OPUS
stands for “OPtical User Software” on the Microsoft Windows platform. A
demo version of OPUS includi ng a collection of IR and Ra man spec tra is su p-
plied on CD-ROM. In addition, you will find an IR library and a Raman library
on your OPUS CD containing 350 and 250 entries, respectively. It is obvious
that a demo version is not suitable for performing measurements. It is also not
pos sible to expor t or import d ata files. Nevertheless, you have an “OPUS Work-
station” at hand, which allows you to enter into the real m of data handling in
vibrational spectroscopy. In order to make the work easier we keep to the ap-
proved rule “Learning by Doing”. You will find a huge amount of illustrations
and examples in the text, which you can and should verify by using your
OPUS workstati on. In this context, we will consider both IR spectra and
Raman spectra in the same way.
The intent was not to write a new textbook on vibrational spectroscopy. So, we
will consider neither band assignments and interpretation of spectra nor special
IR and Raman Spectroscopy: Fundamental Processing. Siegfried Wartewig
Copyright c 2003 WILEY-VCH Verlag GmbH & Co. KGaA, Weinheim
ISBN 3-527-30245-X
experimental techniques. There are many excellent books available detailing the
theory and experimental technique of IR- and Raman spectroscopy as well as
their manifold applications in various fields. The reader interested in those
topic s is re ferred to the bibliography. However, in order to understand the
functions of OPUS we will outline the basic principles of vibrational spectro-
scopy and explain t he essential points of Fourier transformation.
Oriented on the menu of OPUS the book is divided into 13 chapters.
Chapter 2 deals with your personal “OPUS Workstation”, its technical re-
quirements, the software, and spectra database supplied on CD-ROM and
how to install it.
Chapter 3 introduces the basic functions of OPUS. Here you will find general
information about the OPUS windows and the handling of the data files. Once
you have worked throu gh thi s cha pte r you will be able to use the
Browser,load
and unload a spectrum into the
Spectrum Window, select a spectral range, and
deal with a
Report Window.
Chapter 4 briefly summarizes the background of molecular vibrations, which
is fundamental to an understanding of vibrational spectra. Here we will also
explain the difference between IR and Raman spectroscopy.
Chapter 5 addresses the concept of the Fourier transform technique without
going into mathematical details. The advantages of the technique a nd the arte-
facts connected with it are discussed. These include such issues as apodization
function, zerofilling, phase correction, and acquisition mode, which are impor-
tant for an understanding of the measuring process. For Raman spectroscopy,
the ‘rivalry’ between dispersive and FT techniques is also considered.
Chapters6to9cover the details of data managing: handling, editing, and dis-
playing of OPUS files in the form of spectra and reports.
Chapters 10 and 11 form the most exciting and important part of this book
and deal with all aspects of manipulation a nd evaluation of spectra.
Chapter 12 covers the options for manipulating the display of spectra.
Finally,
Chapter 13 outlines how to print spectra and reports.
The book profits from a huge number of figures together with the great advan-
tage that you can create and verify most of them on your own PC screen. It is the
combination of written text, the software tools, and the spectra supplied, which
make it different from other books on vibrational spectroscopy. It is strongly
recommended that you use all these educational tools in a complementary and
interact ive way, switching from the textbook to the software tools and the set
of spectroscopic data stored on your PC and back again. Following this inter-
ac tive line you w ill soon improve your skill in proc essing vib rationa l spectro-
scopic data.
2
1 Introduction
2 Your Personal “OPUS Workstation”
2.1 Technical Requirements
In order to install and run the OPUS version 4.0 demo you will need a Pentium
III class PC with the Microsoft WINDOWS NT 4 .0, WINDOWS 2000 or
WIN DOWS XP pla tfor ms, but note that neither WINDOWS 95 nor WINDOWS
98 are suitable. It is recommended to use an 800 MHz (or higher) processor with
at least 128 MB RAM base memory (256 MB recommended) and a hard disk.
The demo version of the software and the spectra database are both stored on
the CD-ROM enclosed. A corresponding CD-ROM drive is therefore required.
Prior to starting the installation procedure you should ensure that the operating
system WINDOWS NT 4.0 with the Service Pack 6 or WIN DOWS 2000 or
WINDOWS XP is already installed on your computer. The minimum technical
requirements for your OPUS workstation are summarized in Tab. 2.1.
Table 2.1. Minimum requirem ents for your OPUS workstation.
Description Field Information
Operating System Mic rosoft Wind ows NT version 4.0, Microsoft Internet Explorer 5,
Service Pack 6 or
Microsoft Windows 2000 Professional, standard configuration or
Microsoft Windows XP Professional
CPU Intel Pentium III 800 MHz or higher
Hard Disk 800 Mbytes free space or more
Memory 128 Mbytes or better
Monitor 15 in SVGA or better
Network/LAN Ethernet (10 or 10/100 MHz)
Interfaces Parallel (1), RS232 (1 for serial mouse)
Floppy drive 3.5 in
CD ROM 4X
Mouse PS/2 or serial
Keyboard
Gra phics card Resolution 600 x 800 or higher, 8 Mbytes RAM
IR and Raman Spec troscopy: Fundamental Processing. Siegfried Wartewig
Copyright c 2003 WILEY-VCH Verlag GmbH & Co. KGaA, Weinheim
ISBN 3-527-30245-X
2.2 Installing OPUS
In order to start the installation of OPUS insert the OPUS CD into your CD-ROM
drive; the OPUS installation program will start auto mat ically. Depending on your
hardware this may take several seconds. Do not attempt to start the installation
manually during this period or the installation may fail. The installation program
will guide you step by step through the necessary procedure. You only need to
follow the instructions shown in the different dialogs. In the first dialog box ap-
pearing y ou can choose t he language y ou wish to use (see Fig. 2.1). Confirm your
choice by clicking on the
OK butto n.
In the following dialog box shown in Fig. 2.2 the installation set-up will ask
you for the path in which the OP US program should be stored. The default des-
tination folder is C :\OPUSDEMO. Of course, you may choose another folder
using t he
Browser button to browse your hard disk. After clicking on the
Next button, the inst allation program will begin to copy the files from the CD
to your hard disk. The progress of this installation process is displayed by
four status bars as illustrated by the snapshot in Fig. 2.3. Finally, the
Set-up
Complete
box shown in Fig. 2.4 appears, in which you should check “Yes, I
want to restart my computer now”
and then click on the Finish butt on. After
re-booting and successful installation, t he program icon of OPUS will be
added to the Windows Start menu as depicted in Fig. 2.5. Of course, you can
also create the OPUS icon on the desktop as usual in the Windows environment.
In the directory C:\OPUSDEMO\DATA you will find the collection of vibra-
tional spectra split up into the folders ACQUIS, APODIZ, MIR, NIR, and
RAMAN. The t wo spectra libraries IR and Raman are stored in t he directory
C:\OPUSDEMO\Library.
2.3 Starting OPUS
You c an run the OPUSDEMO program most conveniently by clicking the OPUS
icon from the “Start” menu. After starting the program, the login dialog box shown
in Fig. 2.6 appears. Notice that running OPUSDEMO does not require a password
In the login dialog box, click on
Assigned Workspace to vi ew a list of
available user profiles. A workspace file is marked with the e xtension “.ows ”.
The demo version provides four different workspaces. The workspaces
NIR.ows and RA MAN.ows are particularly devoted to NIR spectroscopy and
Raman spectroscopy, respectively. All functions of OPUS are available using
default.ows. The profile DEMO.ows is especially created for the issues of fun-
damental processing, which we will discuss in t his book. Generally, OPUS as
well as OPUSDEMO allows you to generate your own workspace that best
meets y our w ishes. However, in OPU SDEMO you cannot save this new profile.
Therefore, we recommend selecting DEMO.ows.
After confirming the l ogin dialog the OPUS registration screen will be
displayed, showing the version number and the available software packages
4
2 Your Personal “OPUS Work st at ion’’
52.3 Starting OPUS
Figure 2.1. The Set-up
program: The language
dialog box.
Figure 2.2. The Set-up program: Set installation path for OPUS.
Figure 2.3. Status bars indicating the progre ss of install atio n.
6 2 Your Personal “OPUS Work st at ion’’
Figure 2.4. The Set-up Complete dialog box.
Figure 2.5. The Windows Start menu with the
OPUS i con ad de d.
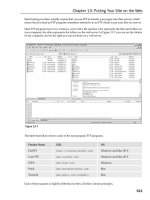
(see Fig 2.7). In addition to the basic program, OPUSDEMO provides specific
packages as follows.
OPUS 3D contains functions to display and manipulate 3D files. These files
can be the results of time resolved measurements, other hyphenated techniques
or mapping experiments.
OPUS IDENT is a software package designed t o identify substances by their
vibrational spectra and is mainly used for quality control.
OPUS QUANT is a package for the quantitative evaluation of spectra.
OPUS SEARCH is a package for the identi fication of unknown substa nces
using a library search for the spectrum, chemical structure information or indi-
vidual bands.
OPUS SEMI is a special package for the spectroscopic analysis of semicon-
ductors, including oxygen and carbon analysis in silicon.
VALIDATION is software that helps users comply with the regulation “21
CFR Part 11 Electronic Records; Ele ctronic Signature”
issued by the United
States Food and Drug Administration, “FDA” (1997).
The t opics of these additional packages are beyond the scope of our interactive
course. However, you can try to apply them using the introductions to these items
that you can find via the menu
Help.
After clicking once again on the OK button the standard OPUS user interface
will be displayed as depicted in Fig 2.8. It consists of three windows, the brow-
ser window, the spectrum window, and the overview. If you place the cursor on
the border between these windows, you will notice the cursor changes to
or
. This allows you to re-size the wi ndows.
On the top of the user interface, there is a line of the menus and under them the
icon bars. By left-clicking on a menu button you have access to a corresponding
context menu, also known as pull-down menu. The icon bars and the menu items
will be explained in detail in the following chapters.
7
2.3 Starting OPUS
Figure 2.6. The OPUS login dialog box.
8 2 Your Personal “OPUS Work st at ion’’
Figure 2.7. The OPUS inform atio n screen.
Figure 2.8. The OPUS user interfa ce.
3 OPUS Basics
This chapter introduces the basic functions of OPUS. Here you will find general
information about the OPUS windows a nd the handling of data files. Many
shortcuts and dialog boxes of OPUS are identical with or resemble those of Win-
dows. If you have already gained experience with Windows, you will find it easy
to use OPUS. So OPU S app lie s drag and drop as well as keystroke shortcuts,
li ke copy
(CTLR C), cut (CTRL X), and paste (CTRL V).
To use these shortcuts, you first have to sel ect a pa rt of the text or select the file
you want to process and then apply the shortcut. Drag and drop simplifies the
copy and paste process, but works only with files. You have to lef t click on
the file icon in the Browser and keep the left mouse button pressed. Then
move the file to the dialog box or the window, which performs the desired func-
tion. Upon releasing the mouse button, the file will automatically be loaded into
the dialog box.
Dialog boxes often consist of several pages, between which you can switch
by left clicking on the tabs of t he page. An exam ple of a dialog box is given
in Fig. 3.1.
Figure 3.1. An example of a four-pages
dialog box.
IR and Raman Spec troscopy: Fundamental Processing. Siegfried Wartewig
Copyright c 2003 W ILEY-VCH Verlag GmbH & Co. KGaA, Weinheim
ISBN 3-527-30245-X
Buttons and menu items are only active if they are displayed in black; gray but-
tons are not active.
3.1 Loading and Selecting a File
You can load a file into the OPUS user in ter face (see Fig. 2.8) by using the Load
File
command from t he File menu or by clicking on the icon located in the
upper left icon bar. In this manner you open the
Load Spectrum di alo g box
shown in Fig. 3.2. The icons in the upper line of this box have the following
meaning :
x
By clicking on you can choose a path to search for spectra.
x
Goes to the last folder visited.
x
Changes to the parent directory.
x
Creates a new folder.
x
By clicking on you open the View Menu for the files listed in t he left
window. You can sel ect between
Large Icons, Small Icons, List, Det ail s,
and Thumbnails.
Test it to become familiar with this menu. We would re-
commend to use
List or Small Icons.
Using the box File name you can also manually type in the name of the file you
wish to load.
In the last three boxes additional information contained in OPUS files can be
selected by choosing parameters. The contents or values of these parameters
will be displayed on the right hand side of the parameter. Keep in mind that
not all OPUS files contain additional information. Figure out by yourself
which parameters are accessible in this way.
10
3OPUSBasics
Figure 3.2. The load file dialog box: No file sel ecte d.
In Fig. 3.2 no file has yet been selected, therefore the abbreviation of the
respective parameter will be displayed.
By selecting a file, here the file RAMAN\ALKANC28.0, the
Load Box will
change as shown in Fig. 3.3. T he right window shows a brief preview of the se-
lected spectrum without the axes, and the data blocks belonging to the file are
shown in the top left corner as small icons. The spectrum parameters now ap-
pear below the spectrum.
You can select several items i n the file list using the control or shift key while
sel ecting the spectra. In thi s case the number of selec ted files will be shown
instead of the data blocks and spectra previews. Clicking on the
Open but ton
will load the spectrum i nto OPUS user interface and automatically close the
Load Box.
Another way of loading a file is by “dragging” it from the Windows Explorer
into the display window or t he Browser window. Using this version of loading the
background of the display icon in the Browser window becomes green.
An OPUS file can consist of various data blocks; several of them are listed
below:
x
Absorbance spectrum
x
Transmittance spectrum
x
Single channel spectrum of the reference
x
Single channel spectrum of the sample
x
Raman spectrum
x
Interferogram of the sample
x
Audit Trail
x
Information
11
3.1 Loading and Selec t i ng a File
Figure 3.3. The load file dialog box with active preview.
x
Integration report
x
Fit report
x
Search report
x
Peak table
x
Report
We will consider the data blocks in detail in the following chapters.
You will encounter the
File Selection Page in various dialog boxes; its pur-
pose is to choose a file on which an OPUS function or command will be per-
formed.Asanexample,Fig.3.4showsthefileselectionpageofthe
Baseline
Correction c
ommand.
The file(s) you want to process are to be entered into the
File(s) to Correct list.
You have several possibilities for loading a file into the selection box:
x
Pre-select one or more files before opening the relevant selection box com-
mand; these files will automatically appear in the selection box.
x
Double-click on a spectrum block while the selection box is open.
x
Use the Browser to drag and drop a spectrum block o f a file i nto the selection
box. By pressing the control key you can select multiple files.
x
Instead of selecting a spectrum block you can also drag and drop a file name
into the selection box. This will select all data blocks contained in this file.
Again use the control key to select multiple files.
x
Drag and drop spectra directly from their spectrum window to the selection
box.
When a data block cannot be processed by a function, it is not possible to load
this file into the selection box. For instance, the conversion AB to TR is not ap-
plicable to an interferogram. Sometimes, the parameters of an OPUS function
(on the following page of the functions dialog box) have to be set prior to load-
12
3OPUSBasics
Figure 3.4. An example of the files selection
page.
ing a file, in order to be able to select the file. When the selected data block can
in principle be processed by the OPUS functions, but the parameters do not
match the data, the file name in the selection box will be indicated in red and
the warning symbol
will be displayed (see Fig. 3.5).
To remove files from the selection box first highlight them. Select several files
by hol ding down the
Shift or Control key while you click on the files with the
left mouse button. Then use the
Delete keytoremovethefileschosen.
Each and every operation dealing with a file, be it a manipulation or evalua-
tion, will automatically be documented and added as audit trail to the file in
terms of t he data block
. You have access to this “history” report by right-
clicking on this icon.
3.2 The Browser Window
The design and functionality of the Browser resemble those of Windows
Explorer. If you load an OPUS file, the file name, the data blocks, and the
file status information become visible in the Browser window (see Fig. 3.6a).
It is possible to display several spectrum windows (see Fig. 3.6 b). If you
have opened several spectrum windows you can toggle between them by left-
clicking on the display icon. Furthermore, clicking on
will collapse the
respective spectrum block, as shown in Fig. 3.6c, and c licking on
will
restore it.
In the Browser window, a blue file icon of the file precedes the file name. The
blue color indicates that the file has not yet been processed. Next to this box are
the file name and a number, indicating the copy of the loaded file. Notice that you
can load a file several times into the Browser.
The data block bar represents all types of information contained in the OPUS
file. In Fig. 3.6a the icons
and indicate a Raman spectrum and an inter-
13
3.2 The Browser Window
Figure 3.5. Theconvertspectradialogbox
indicating parameter mismatch.
ferogram, respectively T he first data block will automatically be displayed in the
spectrum window. The data blocks can be selected in the same manner as you
select files. Selected data blocks are shown framed in red. By left -clicking on
the data block you can change the color of the displayed spectrum in the spec-
trum window.
If you have loaded several spectra, you can select the spectrum you want to pro-
cess by clicking on the file name. If you hold down the
Shift key while selecting
two files, all files in between these two files will also be selected. If you use the
Control key i nstead of the Shift key, all files you selectively click on will be
selected. The same is true for data blocks.
If you load the same spectrum several times, the numbers following the file
name will label the copies. The file name of the active spectrum will appear
in a red box. The display icon can be used to toggle the spectrum windows.
You can select all spectra in a spectrum frame by holding the
Shift key while
clicki ng on a file name. If the cursor is positioned on a file name, the user
name, sample name, and the sample form will be displayed in a small extra win-
dow.
Using t he right mouse button on a file name opens the pop-up menu shown in
Fig. 3.7, which allows you to manipulate the file. You can save the changes you
have made so far, remove the file from the browser, rename it or restore the
original data with the undo function.
14
3OPUSBasics
Figure 3.6. The Browser file list: (a) one file loaded; (b) several files loaded; (c) file
blocks collapsed.
Figure 3.7. The pop-up menu for the file
manipulation.
(a)
(b)
(c)
The Show Parameters command displays all information about the data acqui-
sition stored together with the file, namely the parameters of the sample, instru-
ment, optic, acquisition, Fourier transformation etc. This is done in the form of
a report window (see Chapter 3.4). An example of these parameters is illustrat-
ed in Fig. 3.8 for the Raman file DIAMOND. Load other files and look at the
relevant data.
The last two commands,
Copy Ent ry and Clone Original, are used to duplicate
spectrum files. Use
Copy Entry to make a copy of a data file that has been ma-
nipulated.
Clone Original creates a copy of the original data of such a file.
If you right-click on a data block you have access to another pop-up menu,
shown in Fig. 3.9. Herewith you can change the display color of the spectrum
or remove it from the spectrum window. The other commands will be discussed
later.
3.3 The Spectrum Window
When the default settings are loaded, the spectrum window is located in the right
pane of the OPUS user interface. After a file has been loaded, all spectral features
of this file such as spectra and interferograms can be displayed. As an example,
the transmittance spectrum, the single channel sample spectrum, the sample inter-
ferogram, and the single channel reference spectrum of the MIR file INDIGO are
displayed in Fig. 3.10.
15
3.3 The Spectrum Window
Figure 3.8. The list of instrument parameters.