Ceramic Materials ppsx
Bạn đang xem bản rút gọn của tài liệu. Xem và tải ngay bản đầy đủ của tài liệu tại đây (27.37 MB, 236 trang )
Ceramic Materials
edited by
Wilfried Wunderlich
SCIYO
Ceramic Materials
Edited by Wilfried Wunderlich
Published by Sciyo
Janeza Trdine 9, 51000 Rijeka, Croatia
Copyright © 2010 Sciyo
All chapters are Open Access articles distributed under the Creative Commons Non Commercial Share
Alike Attribution 3.0 license, which permits to copy, distribute, transmit, and adapt the work in any
medium, so long as the original work is properly cited. After this work has been published by Sciyo,
authors have the right to republish it, in whole or part, in any publication of which they are the author,
and to make other personal use of the work. Any republication, referencing or personal use of the work
must explicitly identify the original source.
Statements and opinions expressed in the chapters are these of the individual contributors and
not necessarily those of the editors or publisher. No responsibility is accepted for the accuracy of
information contained in the published articles. The publisher assumes no responsibility for any
damage or injury to persons or property arising out of the use of any materials, instructions, methods
or ideas contained in the book.
Publishing Process Manager Ana Nikolic
Technical Editor Sonja Mujacic
Cover Designer Martina Sirotic
Image Copyright Noam Armonn, 2010. Used under license from Shutterstock.com
First published September 2010
Printed in India
A free online edition of this book is available at www.sciyo.com
Additional hard copies can be obtained from
Ceramic Materials, Edited by Wilfried Wunderlich
p. cm.
ISBN 978-953-307-145-9
SCIYO.COM
WHERE KNOWLEDGE IS FREE
free online editions of Sciyo
Books, Journals and Videos can
be found at www.sciyo.com
Chapter 1
Chapter 2
Chapter 3
Chapter 4
Chapter 5
Chapter 6
Chapter 7
Chapter 8
Chapter 9
Preface VII
Development of Thermoelectric materials based on
NaTaO3 - composite ceramics 1
Wilfried Wunderlich and Bernd Baufeld
Glass-Ceramics Containing Nano-Crystallites of Oxide
Semiconductor 29
Hirokazu Masai, Yoshihiro Takahashi and Takumi Fujiwara
Tape Casting Ceramics for high temperature
Fuel Cell applications 49
Alain S.Thorel
Alkoxide Molecular Precursors for Nanomaterials:
A One Step Strategy for Oxide Ceramics 69
Łukasz John and Piotr Sobota
New ceramic microfiltration membranes from Tunisian natural
materials: Application for the cuttlefish effluents treatment 87
Sabeur Khemakhem, André Larbot, Raja Ben Amar
Electron microscopy and microanalysis of the fiber, matrix and fiber/
matrix interface in sic based ceramic composite material for use in a
fusion reactor application 99
Tea Toplisek, Goran Drazic, Vilibald Bukosek, Sasa Novak and Spomenka Kobe
Mechanical Properties of Ceramics by Indentation:
Principle and Applications 115
Didier Chicot and Arnaud Tricoteaux
Ceramic Materials and Color in Dentistry 155
Cláudia Ângela Maziero Volpato, Márcio Celso Fredel Analúcia Gebler Philippi
and Carlos Otávio Petter
Surface quality controls mechanical strength and fatigue
lifetime of dental ceramics and resin composites 175
Ulrich Lohbauer, Roland Frankenberger and Norbert Krämer
Contents
VI
Chapter 10
Chapter 11
Re-use of ceramic wastes in construction 197
Andrés Juan, César Medina, M. Ignacio Guerra, Julia M. Morán,
Pedro J. Aguado, M. Isabel Sánchez de Rojas, Moisés Frías and Olga Rodríguez
Ceramic Products from Waste 215
André Zimmer
“Ceramic materials” is the title of this book, which describes the state-of-the-art of some
aspects in this large eld in engineering materials. By invitation of the publisher, several
authors from ten countries, most of them do not know each other, have collected a bunch
of chapters which cover a wide area of engineering science. The rst three chapters describe
the fundamental aspects of functional ceramics for thermoelectric, semiconductor and fuel
cell applications. Chapters 4, 5 and 6 describe the processing of nano-ceramics and their
characterisation. The following chapters describe structural ceramics; chapter 7 describes a
new hardness characterisation method for thin lms, and chapters 8 and 9 describe ceramic
materials for dental applications. Finally, chapters 10 and 11 describe the re-use of ceramics
for new structural applications.
This is the rst book of a series of forthcoming publications on this eld by Sciyo publisher.
The reader can enjoy both a classical printed version on demand for a small charge, as well as
the online version free for download. Your citation decides about the acceptance, distribution,
and impact of this piece of knowledge. Please enjoy reading and may this book help promote
the progress in ceramic development for better life on earth.
Editor
Prof.Dr. Wilfried Wunderlich
Tokai University, Dept. Mat.Sci.,
Japan
Preface
Development of Thermoelectric materials based on NaTaO3 - composite ceramics 1
Development of Thermoelectric materials based on NaTaO3 - composite
ceramics
Wilfried Wunderlich and Bernd Baufeld
x
Development of Thermoelectric materials
based on NaTaO
3
- composite ceramics
Wilfried Wunderlich
1
and Bernd Baufeld
2
1
Tokai University, Dept. Material Science., Kitakaname 1117, Hiratsuka-shi, Japan
2
Kath. Universiteit Leuven, Dpt MTM Metallurgy and Ma. Eng., Leuven, Belgium
1. Introduction
This chapter describes the development of novel thermoelectric materials for high-
temperature applications like gas burners, combustion engines, nuclear fuel, or furnaces.
The goal of this development is to recycle waste heat for energy harvesting in order to
contribute in saving the environment. The research results are described in the following
sub-chapters in four different sections.
After a general review about perovskites and NaTaO
3
in section 2, ab-initio-simulations of
the Seebeck coefficient are described in section 3. The Seebeck coefficient strongly depends
on the effective mass and carrier concentration. The electronic band-structure calculations
showed a large electron effective mass for NaTaO
3
. Heavily doping changes NaTaO
3
’s band-
structure in a similar way as the well-known thermoelectric material Nb-doped SrTiO
3
.
Hence, NaTaO
3
, which is stable up 2083 K and which is known as a material with excellent
photo-catalytic properties, was chosen as a candidate for thermoelectric materials.
Section 4 describes the finding of suitable doping elements by sintering NaTaO
3
with
different raw materials. While both, pure NaTaO
3
and NaTaO
3
sintered with Fe
2
O
3
, are
almost insulators, it was discovered that sintering with metallic iron increases both, electric
conductivity and Seebeck coefficient. Microstructural characterization by SEM and XRD
measurements showed that a NaTaO
3
-Fe
2
O
3
composite material is formed. The amount of
Fe solved in the NaTaO
3
lattice is much higher when the starting materials consist of Fe
instead of Fe
2
O
3
. Addition of several metals like Mn, Cr, Ti, Ni, Cu, Mo, W, Fe, and Ag were
tested, but only the later two elements lead to remarkable electric conductivity observed
above 773 K.
Section 5 describes the measurement of thermoelectric properties such as Seebeck-voltage at
a large temperature gradient, a method which is close to applications, but not yet commonly
used, because the thermoelectric theory is based on small temperature gradients. Thermal
conductivity is not measured, but only estimated. The doping is achieved by sintering
metallic iron or silver together with NaTaO
3
. The results are high negative Seebeck voltages
up to -320 mV at a temperature difference of 700 K, as well as high closed-circuit currents up
to -250 A for Fe-doping and positive values for Ag-doping. Besides reporting previous
results, several new findings are described here for the first time. Composites with Cu yield
1
Ceramic Materials 2
to a small Seebeck voltage of about -10 mV with a strong response, when heat flow direction
is reversed.
In section 6 the thermokinetic measurement by differential scanning calorimetry (DSC) and
thermoanalysis (TA) clarifies the reaction sintering between Fe and NaTaO
3
. The
experimental data obtained at different heating rates were analyzed by Friedman analysis
and showed a characteristic shape in the plot of energy versus partial area. Further
directions of improvement, like improving the densification by sintering, are mentioned in
the last section under discussions.
2. Perovskite structure
2.1 Functional Engineering Materials based on Perovskite Crystal structure
The goal of this book chapter is to describe the development of new thermoelectric materials
(TE), whose most important features are described first. Then the perovskite structure is
reviewed, before focusing on the main topic, NaTaO
3
.
Successful thermoelectrics have to be semiconductors [Sommerlate et al. 2007, Nolas et al.
2001, Ryan&Fleur 2002, Bulusu et al.2008], so there are two possible approaches in TE
development, one from the ceramic side, which have large Seebeck coefficients, and one
from the metal side, which have large electric conductivity, but a rather poor Seebeck
coefficient. The main goal of development for ceramics, which are the focus in this book, is
the improvement of the electric conductivity. The engineering targets of such TE-ceramics
are applications in any combustion engines, gas turbines, power plants including nuclear
power plants, furnaces, heaters, burners or in combination with solar cells or solar heaters as
illustrated in fig. 1.
Fig. 1. Possible applications for high-temperature thermoelectric ceramics (in blue color) in
solar cells, solar heaters, combustion engines or gas turbines.
The service temperatures of such devices are usually too high as to be applicable for other
TE materials. The temperature difference [Ryan& Fleur 2002] between the hot chamber
inside and the (cold) ambient environment is considered as the energy source for these
energy conversion devices, which have a long life time and low maintenance costs, because
there are no rotating parts. The main advantage is that any waste heat can be converted into
electricity. Hence, advanced thermoelectrics are both, environment-friendly eco-materials
and energy materials, which main purpose is producing energy. For a wide range of
applications, materials with higher energy conversion efficiency than present TEs need to be
found, in order to be considered as clean energy sources helping to solve the severe CO
2
-
problem. One important indicator for efficient thermoelectric material is the figure-of-merit
ZT
ZT=S
2
T/
(1)
which should have a value significantly larger than 1 to be economically reasonable.
Improvement of ZT requires a high Seebeck coefficient S and electric conductivity and a
low thermal conductivity
. For increasing ZT several concepts for materials design of
thermoelectrics have been introduced [Nolas et al. 2001, Ryan&Fleur 2002, Bulusu et al.2008,
Wunderlich et al. 2009-c]. These are phonon-glass electron-crystal (PGEC) [Terasaki et
al.1997], heavy rattling atoms as phonon absorbers, proper carrier concentration [Vining
1991, Wunderlich et al.2006], differential temperature dependence of density of states, high
density of states at the Fermi energy, high effective electron mass [Wunderlich et al. 2009-a],
superlattice structures with their confined two-dimensional electron gas [Bulusu et al. 2008,
Ohta et al. 2007, Vashaee & Shakouri 2004], and electron-phonon coupling [Sjakste et al.
2007]. As all these factors can influence also the material focused in this chapter NaTaO
3
, at
first basic principles of the Pervoskite crystal structure are briefly reviewed, as this
interdisciplinary approach is supposed to gain important understanding for future
improvement.
The interest on Perovskite structure related materials has dramatically increased in the past
three decades after the discovery of many superior solid-state properties, which makes
Perovskite materials or their layered derivatives record holders in many fields of solid state
physics as shown in fig. 2. The most popular finding was the discovery of superconductivity
in Y
1
Ba
2
C
3
O
7-x
(YBCO) for which the Nobel Prize 1987 was provided. The present record
holder is Bi2212 with a critical temperature of T
C
=120K. A large scale application of YBCO
since 1998 is the linear motor train using the magnetic levitation (Maglev) in Yamanashi-ken
Japan, whose entire rail consists of Helium-cooled superconductors. Present portable phone
technology is all based on layered (Ba,Sr)TiO
3
dielectric material [Ohsato 2001, Wunderlich
et al. 2000] due to their high dielectric constant (e>10000) and quality factor. During the
materials development detailed spectroscopic data of the electromagnetic resonance [Bobnar
et al. 2002, Lichtenberg et al. 2001] have been measured, which further analysis can provide
more understanding of electron-phonon interactions as one of the key issue for
thermoelectrics based on perovskites. Piezoelectric materials on Pb(Ti
1-x
Zr
x
)O
3
(PZT) or the
environmental benign lead free K
0.5
Na
0.5
NbO
3
(KNN) materials [Stegk et al. 2009] have an
increasing application demand in actuators and sensors.
Fig. 2. As Perovskite-structure based mate-rials are record holders in many solid-state
properties, they might become so in thermoelectrics too.
Development of Thermoelectric materials based on NaTaO3 - composite ceramics 3
to a small Seebeck voltage of about -10 mV with a strong response, when heat flow direction
is reversed.
In section 6 the thermokinetic measurement by differential scanning calorimetry (DSC) and
thermoanalysis (TA) clarifies the reaction sintering between Fe and NaTaO
3
. The
experimental data obtained at different heating rates were analyzed by Friedman analysis
and showed a characteristic shape in the plot of energy versus partial area. Further
directions of improvement, like improving the densification by sintering, are mentioned in
the last section under discussions.
2. Perovskite structure
2.1 Functional Engineering Materials based on Perovskite Crystal structure
The goal of this book chapter is to describe the development of new thermoelectric materials
(TE), whose most important features are described first. Then the perovskite structure is
reviewed, before focusing on the main topic, NaTaO
3
.
Successful thermoelectrics have to be semiconductors [Sommerlate et al. 2007, Nolas et al.
2001, Ryan&Fleur 2002, Bulusu et al.2008], so there are two possible approaches in TE
development, one from the ceramic side, which have large Seebeck coefficients, and one
from the metal side, which have large electric conductivity, but a rather poor Seebeck
coefficient. The main goal of development for ceramics, which are the focus in this book, is
the improvement of the electric conductivity. The engineering targets of such TE-ceramics
are applications in any combustion engines, gas turbines, power plants including nuclear
power plants, furnaces, heaters, burners or in combination with solar cells or solar heaters as
illustrated in fig. 1.
Fig. 1. Possible applications for high-temperature thermoelectric ceramics (in blue color) in
solar cells, solar heaters, combustion engines or gas turbines.
The service temperatures of such devices are usually too high as to be applicable for other
TE materials. The temperature difference [Ryan& Fleur 2002] between the hot chamber
inside and the (cold) ambient environment is considered as the energy source for these
energy conversion devices, which have a long life time and low maintenance costs, because
there are no rotating parts. The main advantage is that any waste heat can be converted into
electricity. Hence, advanced thermoelectrics are both, environment-friendly eco-materials
and energy materials, which main purpose is producing energy. For a wide range of
applications, materials with higher energy conversion efficiency than present TEs need to be
found, in order to be considered as clean energy sources helping to solve the severe CO
2
-
problem. One important indicator for efficient thermoelectric material is the figure-of-merit
ZT
ZT=S
2
T/
(1)
which should have a value significantly larger than 1 to be economically reasonable.
Improvement of ZT requires a high Seebeck coefficient S and electric conductivity and a
low thermal conductivity
. For increasing ZT several concepts for materials design of
thermoelectrics have been introduced [Nolas et al. 2001, Ryan&Fleur 2002, Bulusu et al.2008,
Wunderlich et al. 2009-c]. These are phonon-glass electron-crystal (PGEC) [Terasaki et
al.1997], heavy rattling atoms as phonon absorbers, proper carrier concentration [Vining
1991, Wunderlich et al.2006], differential temperature dependence of density of states, high
density of states at the Fermi energy, high effective electron mass [Wunderlich et al. 2009-a],
superlattice structures with their confined two-dimensional electron gas [Bulusu et al. 2008,
Ohta et al. 2007, Vashaee & Shakouri 2004], and electron-phonon coupling [Sjakste et al.
2007]. As all these factors can influence also the material focused in this chapter NaTaO
3
, at
first basic principles of the Pervoskite crystal structure are briefly reviewed, as this
interdisciplinary approach is supposed to gain important understanding for future
improvement.
The interest on Perovskite structure related materials has dramatically increased in the past
three decades after the discovery of many superior solid-state properties, which makes
Perovskite materials or their layered derivatives record holders in many fields of solid state
physics as shown in fig. 2. The most popular finding was the discovery of superconductivity
in Y
1
Ba
2
C
3
O
7-x
(YBCO) for which the Nobel Prize 1987 was provided. The present record
holder is Bi2212 with a critical temperature of T
C
=120K. A large scale application of YBCO
since 1998 is the linear motor train using the magnetic levitation (Maglev) in Yamanashi-ken
Japan, whose entire rail consists of Helium-cooled superconductors. Present portable phone
technology is all based on layered (Ba,Sr)TiO
3
dielectric material [Ohsato 2001, Wunderlich
et al. 2000] due to their high dielectric constant (e>10000) and quality factor. During the
materials development detailed spectroscopic data of the electromagnetic resonance [Bobnar
et al. 2002, Lichtenberg et al. 2001] have been measured, which further analysis can provide
more understanding of electron-phonon interactions as one of the key issue for
thermoelectrics based on perovskites. Piezoelectric materials on Pb(Ti
1-x
Zr
x
)O
3
(PZT) or the
environmental benign lead free K
0.5
Na
0.5
NbO
3
(KNN) materials [Stegk et al. 2009] have an
increasing application demand in actuators and sensors.
Fig. 2. As Perovskite-structure based mate-rials are record holders in many solid-state
properties, they might become so in thermoelectrics too.
Ceramic Materials 4
The main reason for the good piezoelectric properties with its large d
33
shear component is
that soft modes in the phonon spectrum appear near the morphotrophic phase boundary
[Stegk et al. 2009]. This derives from the softening of the atomic bonds by adding other
elements, or from increasing of the lattice constants as described in the next sub-section. The
Nobel Prize 2007 has been provided for the discovery of the giant magnetic resonance
(GMR) observed on Heusler-phases, but it also occurs on Perovskite interfaces as in
(La,Sr)MnO
3
[Coey et al. 1999]. Similarly, for thermoelectric materials, like the layered
Perovskite-relatives called Ruddlesden-Popper phases (SrTiO
3
)
n
(SrO)
m
, large ZT values
have been reported.
Fig. 3. Schematic drawing of the crystal structure of the perovskite structure and of relatives,
(a) perovskite structure with small lattice constant compared to atomic radius, (b) same
with large lattice constants, (c) tilted octahedron in LaTiO
3
, (d) layered Ruddlesden-Popper
phase with uniaxial distorted TiO
6
-octahedron, (e) Aurivilius phase.
The Perovskite structure is schematically summarized in fig 3. In pure perovskites there are
two extreme structural variants, expressed by the tolerance factor f [Imada et al. 1998]
OB
OA
rr
rr
f
(2)
where r
A
, r
B
, r
O
are the atom radii or the A-(alkali or rare earth-), B-(transition metal group-
elements), and O-atom in ABO
3
-perovskites. The first extreme with small f (fig. 3a) has small
lattice constants compared to the atomic radii. Thus, the atoms fit almost without free
volume into the cubic unit cell. The second variant with large f (fig. 3b) has large lattice
constants compared to the atomic radii. Hence, phonon modes especially soft modes can
easily be excited and this is considered as a beneficial factor for many of the superior solid-
state properties mentioned above [Imada et al. 1998, Stegk et al. 2009]. If the space for the
octahedron is too large, they start too tilt as shown in fig. 3 c for LaTiO
3
. This is considered
as bad for the thermoelectric properties. This holds also true for the case of the uniaxial
octahedron extension as shown in fig. 3 d for the layered Ruddlesden-Popper phase
[Ruddlesden & Popper 1958], which is a natural grown nano-composite consisting of SrO
and SrTiO
3
. They are explained in the section 2.3, as well as the Auirvillius phases (fig, 3 e),
but before that the findings on perovskite-based thermo-electrics are briefly summarized.
2.2 Perovskite based thermoelectrics
Focusing from now on thermoelectric materials, it has been shown [Yamamoto et al. 2007,
Sterzel & Kuehling 2002] that in the (Sr,Ba,Ca)TiO
3
ternary system only specimens at the Sr-
rich corner show a large Seebeck-coefficient. Because pure SrTiO
3
is an insulator with a band
gap of 3.2 eV, it needs to be doped in order to become a semiconductor. N-doping has
successfully been demonstrated by partially substitution of Sr with La, or Ti with Nb, and a
rather large thermoelectric figure of merit of 0.34 at 1000K is achieved [Ohta et al. 2005-a,b,
Wunderlich et al. 2006] As shown in fig. 4, the principle is the same as doping in Si, electron
donator elements from the right side of the host atoms in the period system are substituted.
However, in these oxide ceramics, not only an electron is released, but also due to the
valence change of Ti-atom, oxygen atoms are released (fig, 4 b). Hence, firing in reduced
atmosphere improves the properties of Nb-doped SrTiO
3
, as well as NaTaO
3
as explained
later.
The oxygen deficit introduces an additional electronic state 300 mV below the valence band
edge, as discussed elsewhere [Wunderlich et al. 2009-a]. In this paper also one of the reasons
for the good thermoelectric performance of SrTi
1-x
Nb
x
O
3-v
, has been discovered.
Fig. 4. N-type doping of SrTiO
3
for A- and B-side in shown (a) in the period table, (b) as
reaction equation with either creation oxygen vacancies or changing the oxidation state of
the Ti-atom.
Fig. 5 Effective band mass in Nb-doped SrTiO
3
as a function of the Nb-content. The inset
shows the conduction band features near the bandgap for different concentrations in -Z
direction, from which the effective mass was estimated [Wunderlich et al. 2009-a].
Development of Thermoelectric materials based on NaTaO3 - composite ceramics 5
The main reason for the good piezoelectric properties with its large d
33
shear component is
that soft modes in the phonon spectrum appear near the morphotrophic phase boundary
[Stegk et al. 2009]. This derives from the softening of the atomic bonds by adding other
elements, or from increasing of the lattice constants as described in the next sub-section. The
Nobel Prize 2007 has been provided for the discovery of the giant magnetic resonance
(GMR) observed on Heusler-phases, but it also occurs on Perovskite interfaces as in
(La,Sr)MnO
3
[Coey et al. 1999]. Similarly, for thermoelectric materials, like the layered
Perovskite-relatives called Ruddlesden-Popper phases (SrTiO
3
)
n
(SrO)
m
, large ZT values
have been reported.
Fig. 3. Schematic drawing of the crystal structure of the perovskite structure and of relatives,
(a) perovskite structure with small lattice constant compared to atomic radius, (b) same
with large lattice constants, (c) tilted octahedron in LaTiO
3
, (d) layered Ruddlesden-Popper
phase with uniaxial distorted TiO
6
-octahedron, (e) Aurivilius phase.
The Perovskite structure is schematically summarized in fig 3. In pure perovskites there are
two extreme structural variants, expressed by the tolerance factor f [Imada et al. 1998]
OB
OA
rr
rr
f
(2)
where r
A
, r
B
, r
O
are the atom radii or the A-(alkali or rare earth-), B-(transition metal group-
elements), and O-atom in ABO
3
-perovskites. The first extreme with small f (fig. 3a) has small
lattice constants compared to the atomic radii. Thus, the atoms fit almost without free
volume into the cubic unit cell. The second variant with large f (fig. 3b) has large lattice
constants compared to the atomic radii. Hence, phonon modes especially soft modes can
easily be excited and this is considered as a beneficial factor for many of the superior solid-
state properties mentioned above [Imada et al. 1998, Stegk et al. 2009]. If the space for the
octahedron is too large, they start too tilt as shown in fig. 3 c for LaTiO
3
. This is considered
as bad for the thermoelectric properties. This holds also true for the case of the uniaxial
octahedron extension as shown in fig. 3 d for the layered Ruddlesden-Popper phase
[Ruddlesden & Popper 1958], which is a natural grown nano-composite consisting of SrO
and SrTiO
3
. They are explained in the section 2.3, as well as the Auirvillius phases (fig, 3 e),
but before that the findings on perovskite-based thermo-electrics are briefly summarized.
2.2 Perovskite based thermoelectrics
Focusing from now on thermoelectric materials, it has been shown [Yamamoto et al. 2007,
Sterzel & Kuehling 2002] that in the (Sr,Ba,Ca)TiO
3
ternary system only specimens at the Sr-
rich corner show a large Seebeck-coefficient. Because pure SrTiO
3
is an insulator with a band
gap of 3.2 eV, it needs to be doped in order to become a semiconductor. N-doping has
successfully been demonstrated by partially substitution of Sr with La, or Ti with Nb, and a
rather large thermoelectric figure of merit of 0.34 at 1000K is achieved [Ohta et al. 2005-a,b,
Wunderlich et al. 2006] As shown in fig. 4, the principle is the same as doping in Si, electron
donator elements from the right side of the host atoms in the period system are substituted.
However, in these oxide ceramics, not only an electron is released, but also due to the
valence change of Ti-atom, oxygen atoms are released (fig, 4 b). Hence, firing in reduced
atmosphere improves the properties of Nb-doped SrTiO
3
, as well as NaTaO
3
as explained
later.
The oxygen deficit introduces an additional electronic state 300 mV below the valence band
edge, as discussed elsewhere [Wunderlich et al. 2009-a]. In this paper also one of the reasons
for the good thermoelectric performance of SrTi
1-x
Nb
x
O
3-v
, has been discovered.
Fig. 4. N-type doping of SrTiO
3
for A- and B-side in shown (a) in the period table, (b) as
reaction equation with either creation oxygen vacancies or changing the oxidation state of
the Ti-atom.
Fig. 5 Effective band mass in Nb-doped SrTiO
3
as a function of the Nb-content. The inset
shows the conduction band features near the bandgap for different concentrations in -Z
direction, from which the effective mass was estimated [Wunderlich et al. 2009-a].
Ceramic Materials 6
When x, the doping concentration ob Nb increases, the effective electronic mass increases as
shown in fig. 5. When analyzing the band structure, this fact can be explained by the
decrease in energy of a flat band as seen in the inset of fig. 5. At the concentration of x
Nb
=0.24 the low-mass band stretching becomes too large and it forms an independent band
section at the -point (inset of fig. 5, case (C)). As a result the band mass suddenly becomes
small, and in the experiments the bad TE-properties have been confirmed.
The finding expressed in fig. 5 [Wunderlich et al. 2009-a] can be considered as a kind of
guideline for any functional material development. In contrary to structural materials,
where a wide concentration range gives usual good performance, in functional materials
only a narrow concentration range gives good properties. “A little bit increases the
performance remarkable, but a little bit too much, deteriorates them”, is a principle
occurring often in nature, especially in organic or bio-chemistry.
Another reason for the success of Nb-doped SrTiO
3
-Perovskite has been suggested by the
decrease of the bandgap due to phonons [Wunderlich W., 2008-a]. This mechanism explains
the importance of phonons for electron excitation as the origin of the heat conversion, and
on the other hand it explains the large Seebeck coefficient due to reduction of
recombination. Namely, when the excited electron wants to jump back to ground state, the
phonon has traveled away and the bandgap is large as it is without phonon making a de-
excitation unlikely.
The following formula [Wunderlich et al. 2009-a] relates the calculated band masses to the
effective band mass m* as determined in experiments
iBe
mmm
,
*
*
(3)
by taking m
B,i
with i=1, the next band to the band gap from band structure calculations, as
an average of high and low band masses m
B,i,h
m
B,i,l
at two different reciprocal lattice points
by
3/2
2/3
,,
2/3
,,, liBhiBiB
mmm
(4).
Through these band mass calculations it was described for the first time [Wunderlich &
Koumoto 2006], that NaTO
3
, KTaO
3
and others are possible TE-candidates, because they
possess a large effective mass of m*/m
e
=8, about two times larger than Nb-SrTiO
3
. Before
describing NaTO
3
in section 2.4., we briefly summarize findings on layered Perovskites.
2.3 Layered Perovskites as thermoelectrics
The electron confinement at Perovskite interfaces has been demonstrated first in [Ohmoto &
Hwang 2004]. Due to such 2-dimensional electron gas (2DEG) at interfaces, also
thermoelectric properties are enhanced as predicted theoretically (see references in [Bulusu
& Walker 2008]). The confined electron gas has been successfully demonstrated for Nb-
doped SrTiO
3
, and this discovery leads to Seebeck coefficients ten times higher than bulk
materials [Mune et al. 2007, Ohta et al. 2007, Hosono et al. 2006, Lee et al. 2008]. Theoretical
calculations [Wunderlich et al. 2008] showed that the control of the concentration on
atomistic level, diffusion and structural stability is essential, as a SrTiO
3
-SrNbO
3
-SrTiO
3
composite is much more effective that an embedded Nb-doped SrTiO
3
.
The idea that an insulating nano-layer of SrO inside Nb-doped SrTiO
3
reduces the thermal
expansion of the composite, has been demonstrated for the Ruddlesden-Popper phase [Lee
et al. 2007-a, Lee et al. 2007-b, Wunderlich et al. 2005], which are naturally grown
superlattices [Haeni et al.2001]. As mentioned in section 2.2, in such case structural uniaxial
distortions of the Ti-octahedron can occur, which deteriorate the thermoelectric properties
due to their larger Ti-O-distance. By additional doping elements the extension can be
restored and thermoelectric properties are improved [Wang et al. 2007].
Other Perovskite relatives are the various Aurivilius phases, which consists of Bi
2
O
2
layers
between Perovskite [Lichtenberg et al. 2001, Perez-Mato et al. 2004]. Their thermoelectric
conversion power has yet been tested to a certain degree. Other Perovskite relatives are the
Tungsten-bronze crystals [Ohsato 2001], which have not yet been tested.
2.4 Pure NaTaO
3
is a distorted Perovskite
The interest in NaTaO
3
recently increased after the discovery of its photo catalytic properties
as water splitting [Kato et al. 1998], or degradation of organic molecules, especially when
doped with rare earth elements like La [Yan et al., 2009]. In spite of its high melting point of
1810
o
C [Lee et al. 1995, Suzuki et al. 2004] it has a lattice energy of -940 kJ/mol, but not as
low as Ta
2
O
5
(-1493 kJ/mol). It can be produced at relatively low temperatures from
Na
2
C
2
O
4
and Ta
2
O
5
[Xu et al. 2005] and it reactives with Si
3
N
4
[Lee et al. 1995]. NaTaO
3
forms an eutectic ceramic alloy with CaCO
3
, which lowers the melting point to 813 K
[Kjarsgaard & Mtchell 2008]. Ta in NaTaO
3
can be exchanged isomorphly by Nb, relating in
similar properties as NaNbO
3
[Shirane et al. 1954, Shanker et al., 2009].
Detailed investigations showed that NaTaO
3
possesses the Pervoskite structure (Pm-3m)
only above (893 K) before it lowers its symmetry becoming tetragonal (P4/mbm), and
orthorhombic (Cmcm, Pbnm) below 843 K and 773 K, respectively [Kennedy et al. 1999].
NaTaO
3
is more stable compared to NaNbO
3
, which becomes tetragonal at 653 K and
orthorhombic at 543 K, or KNbO
3
, where these transformations occur at 608 K and 498 K,
respectively [Shirane et al. 1954]. NaTaO
3
has a bandgap of 4eV [Xu et al. 2005]. The phase
transition is caused by the octahedron tilting (fig. 2 c), which can reach up to 8
o
in the case of
NaTaO
3
[Kennedy. et al. 1999].
NaTaO
3
has been suggested as thermoelectric material [Wunderlich & Koumoto 2006,
Wunderlich et al. 2009-a, Wunderlich & Soga 2010], as it shows a large Seebeck coefficient.
The findings are briefly summarized, together with explanation of new research results in
the following sections.
3. Ab-initio calculations of doped NaTaO
3
First-principle calculations based on the density-functional theory (DFT) are presented in
this chapter. They should clarify the following topics, namely which doping element sits on
A- or B-site of the perovskite lattice ABO
3
, how the lattice constants change, how Fermi
energy and bandgap change, and finally how the bandstructure and density-of-states (DOS)
looks like.
The first principles calculations were performed using VASP software [Kresse & Hafner
1994] in the LDA-GGA approximation with a cut-off energy E=-280eV, U=0V and sufficient
Development of Thermoelectric materials based on NaTaO3 - composite ceramics 7
When x, the doping concentration ob Nb increases, the effective electronic mass increases as
shown in fig. 5. When analyzing the band structure, this fact can be explained by the
decrease in energy of a flat band as seen in the inset of fig. 5. At the concentration of x
Nb
=0.24 the low-mass band stretching becomes too large and it forms an independent band
section at the -point (inset of fig. 5, case (C)). As a result the band mass suddenly becomes
small, and in the experiments the bad TE-properties have been confirmed.
The finding expressed in fig. 5 [Wunderlich et al. 2009-a] can be considered as a kind of
guideline for any functional material development. In contrary to structural materials,
where a wide concentration range gives usual good performance, in functional materials
only a narrow concentration range gives good properties. “A little bit increases the
performance remarkable, but a little bit too much, deteriorates them”, is a principle
occurring often in nature, especially in organic or bio-chemistry.
Another reason for the success of Nb-doped SrTiO
3
-Perovskite has been suggested by the
decrease of the bandgap due to phonons [Wunderlich W., 2008-a]. This mechanism explains
the importance of phonons for electron excitation as the origin of the heat conversion, and
on the other hand it explains the large Seebeck coefficient due to reduction of
recombination. Namely, when the excited electron wants to jump back to ground state, the
phonon has traveled away and the bandgap is large as it is without phonon making a de-
excitation unlikely.
The following formula [Wunderlich et al. 2009-a] relates the calculated band masses to the
effective band mass m* as determined in experiments
iBe
mmm
,
*
*
(3)
by taking m
B,i
with i=1, the next band to the band gap from band structure calculations, as
an average of high and low band masses m
B,i,h
m
B,i,l
at two different reciprocal lattice points
by
3/2
2/3
,,
2/3
,,, liBhiBiB
mmm
(4).
Through these band mass calculations it was described for the first time [Wunderlich &
Koumoto 2006], that NaTO
3
, KTaO
3
and others are possible TE-candidates, because they
possess a large effective mass of m*/m
e
=8, about two times larger than Nb-SrTiO
3
. Before
describing NaTO
3
in section 2.4., we briefly summarize findings on layered Perovskites.
2.3 Layered Perovskites as thermoelectrics
The electron confinement at Perovskite interfaces has been demonstrated first in [Ohmoto &
Hwang 2004]. Due to such 2-dimensional electron gas (2DEG) at interfaces, also
thermoelectric properties are enhanced as predicted theoretically (see references in [Bulusu
& Walker 2008]). The confined electron gas has been successfully demonstrated for Nb-
doped SrTiO
3
, and this discovery leads to Seebeck coefficients ten times higher than bulk
materials [Mune et al. 2007, Ohta et al. 2007, Hosono et al. 2006, Lee et al. 2008]. Theoretical
calculations [Wunderlich et al. 2008] showed that the control of the concentration on
atomistic level, diffusion and structural stability is essential, as a SrTiO
3
-SrNbO
3
-SrTiO
3
composite is much more effective that an embedded Nb-doped SrTiO
3
.
The idea that an insulating nano-layer of SrO inside Nb-doped SrTiO
3
reduces the thermal
expansion of the composite, has been demonstrated for the Ruddlesden-Popper phase [Lee
et al. 2007-a, Lee et al. 2007-b, Wunderlich et al. 2005], which are naturally grown
superlattices [Haeni et al.2001]. As mentioned in section 2.2, in such case structural uniaxial
distortions of the Ti-octahedron can occur, which deteriorate the thermoelectric properties
due to their larger Ti-O-distance. By additional doping elements the extension can be
restored and thermoelectric properties are improved [Wang et al. 2007].
Other Perovskite relatives are the various Aurivilius phases, which consists of Bi
2
O
2
layers
between Perovskite [Lichtenberg et al. 2001, Perez-Mato et al. 2004]. Their thermoelectric
conversion power has yet been tested to a certain degree. Other Perovskite relatives are the
Tungsten-bronze crystals [Ohsato 2001], which have not yet been tested.
2.4 Pure NaTaO
3
is a distorted Perovskite
The interest in NaTaO
3
recently increased after the discovery of its photo catalytic properties
as water splitting [Kato et al. 1998], or degradation of organic molecules, especially when
doped with rare earth elements like La [Yan et al., 2009]. In spite of its high melting point of
1810
o
C [Lee et al. 1995, Suzuki et al. 2004] it has a lattice energy of -940 kJ/mol, but not as
low as Ta
2
O
5
(-1493 kJ/mol). It can be produced at relatively low temperatures from
Na
2
C
2
O
4
and Ta
2
O
5
[Xu et al. 2005] and it reactives with Si
3
N
4
[Lee et al. 1995]. NaTaO
3
forms an eutectic ceramic alloy with CaCO
3
, which lowers the melting point to 813 K
[Kjarsgaard & Mtchell 2008]. Ta in NaTaO
3
can be exchanged isomorphly by Nb, relating in
similar properties as NaNbO
3
[Shirane et al. 1954, Shanker et al., 2009].
Detailed investigations showed that NaTaO
3
possesses the Pervoskite structure (Pm-3m)
only above (893 K) before it lowers its symmetry becoming tetragonal (P4/mbm), and
orthorhombic (Cmcm, Pbnm) below 843 K and 773 K, respectively [Kennedy et al. 1999].
NaTaO
3
is more stable compared to NaNbO
3
, which becomes tetragonal at 653 K and
orthorhombic at 543 K, or KNbO
3
, where these transformations occur at 608 K and 498 K,
respectively [Shirane et al. 1954]. NaTaO
3
has a bandgap of 4eV [Xu et al. 2005]. The phase
transition is caused by the octahedron tilting (fig. 2 c), which can reach up to 8
o
in the case of
NaTaO
3
[Kennedy. et al. 1999].
NaTaO
3
has been suggested as thermoelectric material [Wunderlich & Koumoto 2006,
Wunderlich et al. 2009-a, Wunderlich & Soga 2010], as it shows a large Seebeck coefficient.
The findings are briefly summarized, together with explanation of new research results in
the following sections.
3. Ab-initio calculations of doped NaTaO
3
First-principle calculations based on the density-functional theory (DFT) are presented in
this chapter. They should clarify the following topics, namely which doping element sits on
A- or B-site of the perovskite lattice ABO
3
, how the lattice constants change, how Fermi
energy and bandgap change, and finally how the bandstructure and density-of-states (DOS)
looks like.
The first principles calculations were performed using VASP software [Kresse & Hafner
1994] in the LDA-GGA approximation with a cut-off energy E=-280eV, U=0V and sufficient
Ceramic Materials 8
number of k-points. The DOS is convoluted with a Gaussian distribution with a FWHM of
0.2eV, to approximate the broadening at room temperature. The relevant symmetry points
in reciprocal space were chosen according to the standard notifications of the Perovskite
space group Pm-3m, which was assumed as a first approximation to have untitled
octahedra. The path in reciprocal space was focused on the three directions near the -point,
see discussion in [Wunderlich et al. 2009-a]. The supercell used in these calculations is a
2x2x2 extension of the unit cell, allowing calculations of minimal doping concentration steps
of 0.125 = 1/8 for A- or B-side or 1/24 for O.
Fig. 6. The energy-volume dependence for pure NaTaO
3
(pink line) is shown and compared
with different doping elements dissolved in NaTaO
3
, either on Na- or Ta-side, each for two
concentration. The variants with lowest energy are (a) Fe on Ta-side, (b) Ag on Na-side, and
(c) Ti, (d) Mn, (e) Cr all three on Ta-side.
Doping element
NaTa
0.9
Me
0.1
O
3
un-
doped
Fe Ag Ti Mn Cr
Lattice constant [nm] 0.3909 0.3948 0.3968 0.3909
0.3952 0.3929
Band-gap [eV] 2.20 0.74 0.60 2.10 0.95 1.30
Fermi energy [eV] 2.37 1.91 1.80 2.17 1.95 2.54
Table 1. Lattice constants, band-gap and Fermi energy for Ta-site doped NaTaO
3
as
estimated from ab-initio calculations
The results of the energy-versus-volume (E(V)) calculations are shown in fig. 6 for doping
elements Fe, Ag, Ti, Mn, and Cr for either doping on A- or B- side. The obtained lattice
constants are shown in table 1 and exhibit only a small change compared to pure NaTaO
3.
As explained in the following section and in a previous paper [Wunderlich 2009-b], Ag and
Fe are the two doping elements, which cause the highest Seebeck voltage due to their high
solubility in the NaTaO
3
lattice. The data in fig. 6 show that both, Fe, and Ag, doped on B-
site have a slightly higher energy, while according to the experimental data intuitively one
would expect a lower energy than pure NaTaO
3
, as it is in the case for all other doping
elements. The discrepancy can be explained by the fact that pure NaTaO
3
has tilted
octahedron. Furthermore, Ag shows a slightly lower energy for doping on A-side, but this
makes no sense, because valence and hence band structure remains unchanged. As in the
case of Nb-doped SrTiO
3
[Wunderlich et al. 2009-a] DFT-calculations of the combined
defects NaTa
0.88
Me
0.12
O
3-x
might clarify this issue. As explained in fig. 4 b in the previous
section, an increase in the electron concentration on B-side is always related to a deficit in
oxygen.
Fig. 7. Band structure of (a) NaTaO
2.8
. (b) NaTa
0.88
Fe
0.12
O
3
(n-type) (c) NaTa
0.88
Ag
0.12
O
3
(p-
type). The arrows show the change compared to un-doped NaTaO
3
. (The band colors are
just for distinguishing and have no other meaning).
The calculated band structure of Fe-doped NaTaO
3
is shown in fig. 7 b, that of Ag-doped
NaTaO
3
in fig 7 c and the oxygen-deficit NaTaO
2.8
lattice in fig. 7 a. In all plots the Fermi
energy level, which is shown in table 1, has been adjusted to 0 eV. In the case of n-doping
the Ta-2eg bands have lowered their energy and the band gap is reduced remarkably from
2.2 eV in pure NaTaO
3
to 0.74 eV, so that excitations due to phonons become possible. The
p-doping by Ag shifts the Ta-2eg bands towards the valence band, so that an indirect band
gap with 0.6 eV occurs. As shown in table 1, the band structures of other doping elements
show larger band gaps. The band gap widths correspond well to the electric resistivity of
Development of Thermoelectric materials based on NaTaO3 - composite ceramics 9
number of k-points. The DOS is convoluted with a Gaussian distribution with a FWHM of
0.2eV, to approximate the broadening at room temperature. The relevant symmetry points
in reciprocal space were chosen according to the standard notifications of the Perovskite
space group Pm-3m, which was assumed as a first approximation to have untitled
octahedra. The path in reciprocal space was focused on the three directions near the -point,
see discussion in [Wunderlich et al. 2009-a]. The supercell used in these calculations is a
2x2x2 extension of the unit cell, allowing calculations of minimal doping concentration steps
of 0.125 = 1/8 for A- or B-side or 1/24 for O.
Fig. 6. The energy-volume dependence for pure NaTaO
3
(pink line) is shown and compared
with different doping elements dissolved in NaTaO
3
, either on Na- or Ta-side, each for two
concentration. The variants with lowest energy are (a) Fe on Ta-side, (b) Ag on Na-side, and
(c) Ti, (d) Mn, (e) Cr all three on Ta-side.
Doping element
NaTa
0.9
Me
0.1
O
3
un-
doped
Fe Ag Ti Mn Cr
Lattice constant [nm] 0.3909 0.3948 0.3968 0.3909
0.3952 0.3929
Band-gap [eV] 2.20 0.74 0.60 2.10 0.95 1.30
Fermi energy [eV] 2.37 1.91 1.80 2.17 1.95 2.54
Table 1. Lattice constants, band-gap and Fermi energy for Ta-site doped NaTaO
3
as
estimated from ab-initio calculations
The results of the energy-versus-volume (E(V)) calculations are shown in fig. 6 for doping
elements Fe, Ag, Ti, Mn, and Cr for either doping on A- or B- side. The obtained lattice
constants are shown in table 1 and exhibit only a small change compared to pure NaTaO
3.
As explained in the following section and in a previous paper [Wunderlich 2009-b], Ag and
Fe are the two doping elements, which cause the highest Seebeck voltage due to their high
solubility in the NaTaO
3
lattice. The data in fig. 6 show that both, Fe, and Ag, doped on B-
site have a slightly higher energy, while according to the experimental data intuitively one
would expect a lower energy than pure NaTaO
3
, as it is in the case for all other doping
elements. The discrepancy can be explained by the fact that pure NaTaO
3
has tilted
octahedron. Furthermore, Ag shows a slightly lower energy for doping on A-side, but this
makes no sense, because valence and hence band structure remains unchanged. As in the
case of Nb-doped SrTiO
3
[Wunderlich et al. 2009-a] DFT-calculations of the combined
defects NaTa
0.88
Me
0.12
O
3-x
might clarify this issue. As explained in fig. 4 b in the previous
section, an increase in the electron concentration on B-side is always related to a deficit in
oxygen.
Fig. 7. Band structure of (a) NaTaO
2.8
. (b) NaTa
0.88
Fe
0.12
O
3
(n-type) (c) NaTa
0.88
Ag
0.12
O
3
(p-
type). The arrows show the change compared to un-doped NaTaO
3
. (The band colors are
just for distinguishing and have no other meaning).
The calculated band structure of Fe-doped NaTaO
3
is shown in fig. 7 b, that of Ag-doped
NaTaO
3
in fig 7 c and the oxygen-deficit NaTaO
2.8
lattice in fig. 7 a. In all plots the Fermi
energy level, which is shown in table 1, has been adjusted to 0 eV. In the case of n-doping
the Ta-2eg bands have lowered their energy and the band gap is reduced remarkably from
2.2 eV in pure NaTaO
3
to 0.74 eV, so that excitations due to phonons become possible. The
p-doping by Ag shifts the Ta-2eg bands towards the valence band, so that an indirect band
gap with 0.6 eV occurs. As shown in table 1, the band structures of other doping elements
show larger band gaps. The band gap widths correspond well to the electric resistivity of
Ceramic Materials 10
such specimens as explained in the next section. Hence, the band-gap-reduction will be a
future engineering challenge for obtaining a large electric conductivity.
Fig. 8. Band structure near the conduction band edge at the -point for Na-site doping, (a)
Na
0.88
Ca
0.12
TaO
2.8
, , (b) Na
0.88
Sr
0.12
TaO
2.8
, (c) Na
0.88
Ba
0.12
TaO
2.8
, , (d) Na
0.88
Ce
0.12
TaO
2.8
.
The mechanism for electron conductivity is similar to that in Nb-doped SrTiO
3
; for details
see the discussions in [Wunderlich et al. 2009-a]. The oxygen vacancies introduce electronic
states about 200 ~ 300 meV below the valence band edge, form which electrons from the
conduction band can be excited into the valence band. Compared to pure and Nb-doped
SrTiO
3
(m*/m
0
= 4.8 and 8), in pure NaTaO
3
(m*/m
0
= 8) the effective electron mass increases
further (m*/m
0
= 12), as can be seen from the flat bands over the entire region -X in all
three cases of fig. 7. In un-doped NaTaO
3
the hole mass is also large (m*/m
0
= 8). The mass of
Ag-doped NaTaO
3
(Fig. 7 c) is smaller due to the indirect bands at Z and -points, but the
large effective mass of the valence band minimum in un-doped regions (m*/m
0
> 20) seems to
have also an large influence on the effective mass measured in experiments. Calculations for
A-site doping analog to La-doped SrTiO
3
[Wunderlich et al. 2009-a] are shown for NaTaO
2.8
in fig. 8. In all cases the DOS near the band edge is increased, but for Ce-doping it became
especially large as can be also seen on the increased number of bands (fig. 8 d). In spite of
experimental difficulties with sintering of Ce
2
O
3
containing samples [Wunderlich et al. 2009-
d], a large TE-performance by co-doping might be expected. In following experimental
results about Ta-site doping are reported.
4. Specimen preparation and microstructure characterization of NaTaO
3
NaTaO
3
composite ceramics were produced by conventional sintering. Well-defined weight
ratios of fine powders of NaTaO
3
(Fine Chemicals Ltd.) and each of the pure metals Fe, Ag
and other metals, or Fe
2
O
3
, were mixed in different concentration ratios in a mortar for more
than 10 min. The specimens were pressed with 100 MPa as pellets, 10 mm in diameter and 3
mm height, and sintered in a muffle furnace in air at 1000
o
C for 5h with slow heating and
cooling rates (50K/h) as sketched in fig. 9. The electric properties of the specimens were
analyzed as explained in the following section. Thereafter, the sintering was repeated
several times at the same temperature. During sintering the white color of NaTaO
3
specimens turn into dark colors indicating that the band-gap has been reduced, when a
large amount of metals was dissolved. However, specimens containing metals with low
solubility such as Al, Cu, Sn, Sb, Mo, W remained white or turned into light orange or
reddish color (Ti). The specimens were characterized by SEM (Hitachi 3200-N) at 30kV
equipped with EDS (Noran), which allows chemical mapping. The X-ray diffraction (XRD)
analysis was performed using a Rigaku Miniflex device with Co-source with 1.7889 nm
wavelength. Simulation of the XRD-patterns was performed with the Carine V3 software
(Cristmet).
Fig. 9. Flowchart of the specimen preparation
Fig. 10 XRD diffraction pattern of NaTaO
3
with 50 wt-% Ni. The letters N indicate NaTaO
3
reflexes.
The analysis of XRD-diffraction pattern of Fe- and Ti-doped NaTaO
3
showed [Wunderlich,
Soga, 2010] that the initially mixed Fe or Ti-metallic powder gets oxidized as besides the
NaTaO
3
- XRD-peaks also such of FeO
3
- or Ti
2
O
3
are observed. Hence, during sintering a
FeO
3
- and Ti
2
O
3
–NaTaO
3
composite material is formed by reaction bonded sintering (RBS),
a mechanism, which supports additional energy for sintering and has been successfully
applied for many structural ceramics [Claussen et al. 1996]. Weight measurements of
specimens before and after sintering confirmed the oxidation by weight gain even in
quantitative manner.
In the case of Ag, evidences for oxidation have not yet been clearly approved, instead,
cooling down a sintered specimen, metallic silver balls separated on the specimen surface
are observed. In the case of Ni-added NaTaO
3
, in spite of the greenish specimen surface
color due to NiO, the XRD pattern in fig. 10 shows that the interior of the specimen consists
of a composite NaTaO
3
with metallic Ni. In all specimens with Fe-, Ni-, Mn-, and Ag-doping
the XRD peaks were indentified as Perovskite with space group Pm-3m as mentioned in
Development of Thermoelectric materials based on NaTaO3 - composite ceramics 11
such specimens as explained in the next section. Hence, the band-gap-reduction will be a
future engineering challenge for obtaining a large electric conductivity.
Fig. 8. Band structure near the conduction band edge at the -point for Na-site doping, (a)
Na
0.88
Ca
0.12
TaO
2.8
, , (b) Na
0.88
Sr
0.12
TaO
2.8
, (c) Na
0.88
Ba
0.12
TaO
2.8
, , (d) Na
0.88
Ce
0.12
TaO
2.8
.
The mechanism for electron conductivity is similar to that in Nb-doped SrTiO
3
; for details
see the discussions in [Wunderlich et al. 2009-a]. The oxygen vacancies introduce electronic
states about 200 ~ 300 meV below the valence band edge, form which electrons from the
conduction band can be excited into the valence band. Compared to pure and Nb-doped
SrTiO
3
(m*/m
0
= 4.8 and 8), in pure NaTaO
3
(m*/m
0
= 8) the effective electron mass increases
further (m*/m
0
= 12), as can be seen from the flat bands over the entire region -X in all
three cases of fig. 7. In un-doped NaTaO
3
the hole mass is also large (m*/m
0
= 8). The mass of
Ag-doped NaTaO
3
(Fig. 7 c) is smaller due to the indirect bands at Z and -points, but the
large effective mass of the valence band minimum in un-doped regions (m*/m
0
> 20) seems to
have also an large influence on the effective mass measured in experiments. Calculations for
A-site doping analog to La-doped SrTiO
3
[Wunderlich et al. 2009-a] are shown for NaTaO
2.8
in fig. 8. In all cases the DOS near the band edge is increased, but for Ce-doping it became
especially large as can be also seen on the increased number of bands (fig. 8 d). In spite of
experimental difficulties with sintering of Ce
2
O
3
containing samples [Wunderlich et al. 2009-
d], a large TE-performance by co-doping might be expected. In following experimental
results about Ta-site doping are reported.
4. Specimen preparation and microstructure characterization of NaTaO
3
NaTaO
3
composite ceramics were produced by conventional sintering. Well-defined weight
ratios of fine powders of NaTaO
3
(Fine Chemicals Ltd.) and each of the pure metals Fe, Ag
and other metals, or Fe
2
O
3
, were mixed in different concentration ratios in a mortar for more
than 10 min. The specimens were pressed with 100 MPa as pellets, 10 mm in diameter and 3
mm height, and sintered in a muffle furnace in air at 1000
o
C for 5h with slow heating and
cooling rates (50K/h) as sketched in fig. 9. The electric properties of the specimens were
analyzed as explained in the following section. Thereafter, the sintering was repeated
several times at the same temperature. During sintering the white color of NaTaO
3
specimens turn into dark colors indicating that the band-gap has been reduced, when a
large amount of metals was dissolved. However, specimens containing metals with low
solubility such as Al, Cu, Sn, Sb, Mo, W remained white or turned into light orange or
reddish color (Ti). The specimens were characterized by SEM (Hitachi 3200-N) at 30kV
equipped with EDS (Noran), which allows chemical mapping. The X-ray diffraction (XRD)
analysis was performed using a Rigaku Miniflex device with Co-source with 1.7889 nm
wavelength. Simulation of the XRD-patterns was performed with the Carine V3 software
(Cristmet).
Fig. 9. Flowchart of the specimen preparation
Fig. 10 XRD diffraction pattern of NaTaO
3
with 50 wt-% Ni. The letters N indicate NaTaO
3
reflexes.
The analysis of XRD-diffraction pattern of Fe- and Ti-doped NaTaO
3
showed [Wunderlich,
Soga, 2010] that the initially mixed Fe or Ti-metallic powder gets oxidized as besides the
NaTaO
3
- XRD-peaks also such of FeO
3
- or Ti
2
O
3
are observed. Hence, during sintering a
FeO
3
- and Ti
2
O
3
–NaTaO
3
composite material is formed by reaction bonded sintering (RBS),
a mechanism, which supports additional energy for sintering and has been successfully
applied for many structural ceramics [Claussen et al. 1996]. Weight measurements of
specimens before and after sintering confirmed the oxidation by weight gain even in
quantitative manner.
In the case of Ag, evidences for oxidation have not yet been clearly approved, instead,
cooling down a sintered specimen, metallic silver balls separated on the specimen surface
are observed. In the case of Ni-added NaTaO
3
, in spite of the greenish specimen surface
color due to NiO, the XRD pattern in fig. 10 shows that the interior of the specimen consists
of a composite NaTaO
3
with metallic Ni. In all specimens with Fe-, Ni-, Mn-, and Ag-doping
the XRD peaks were indentified as Perovskite with space group Pm-3m as mentioned in
Ceramic Materials 12
section 2.4. Hence, it can be concluded, that the octahedron tilting mentioned in section 2
was suppressed by the doping.
Fig. 12. SEM micrographs of the as-prepared surfaces of different NaTaO
3
-composites
processed by adding 40 wt% of (a) Fe, (b) Ag, (c) Ti, (d) Mo, (e) Mn, (e) Cr, (g) Ni, (h) W.
The microstructure of the NaTaO
3
composite processed with 50 wt% Fe consists of a
NaTaO
3
- 50 mol% Fe
2
O
3
composite as shown in fig. 12 a. It consists of dark Fe
2
O
3
particles,
on average 10 m in size, and appearing in streaks-like shape, which are embedded in a
grey NaTaO
3
matrix. Detailed explanation is provided in a previous paper [Wunderlich &
Soga 2010]. When NaTaO
3
is initially processed with Fe
2
O
3
instead of Fe, the microstructure
looks like a sintered ceramic composite with white Fe
2
O
3
besides white NaTaO
3
particles.
The change from black to white color can be explained by oxygen saturation as explained in
section 6. Such a micrograph is shown in a previous paper [Wunderlich 2009-b]. The white
areas in fig. 12 a are pores remaining from insufficient compaction during sintering or from
released oxygen as explained in section 5.
In NaTaO
3
-composites containing Ag, Ti, Mn, and Ni the dark, metallic particles are slightly
bigger (5~10 m). The particles have a volume fraction of about 30% which correspond well
to the intensity ratios of the XRD-pattern. In specimens, which were produced from Fe
2
O
3
-
instead of Fe-powder, the Fe
2
O
3
-particles form round particles as shown in fig. 3 a in
[Wunderlich 2009-b]. In the case of Cr the dark, metallic Cr-particles are significantly larger
(20 m), which can be explained by their low diffusivity. The same would be expected for
Mo and W with their high melting points, but instead they lead to faceted interfaces. By
chemical mapping homogeneous distribution of Na, Ta, Mo or W was confirmed. The two
elements, Mo, and W, having their location in the period system and their atomic radii close
to Ta, and, hence, can inter-diffuse easily with Ta. They lower the surface energy of certain
crystallographic planes, which is an important fact to be kept in mind when nano-layered
composite materials based on NaTaO
3
are desired.
The main goal of doping is to increase the carrier concentration of NaTaO
3
in order to
increase the conductivity. In a composite this can only be achieved by increasing the
concentration of the dissolved element. Composition measurements by EDX in SEM with
lateral resolution of 1 m were performed on the NaTaO
3
-phase in the NaTaO
3
-composites
processed with different metals. For Cr, Mo and W concentrations below 2 at% were
detected, for Ag, Ti, Mn, and Ni, 5 ~ 10 at% were detected and for Fe 14 at%. This result can
Is a necessity for a thermoelectric material and explains the success of Fe and Ag for the TE-
performance as explained in the following section.
5. Thermoelectric characterization
5.1 Measuring device
The thermoelectric measurements were performed with a self-manufactured device as
shown in the inset of fig. 13. The specimen was attached to the device, so that its left side lies
on a copper block as a heat sink and its right side on a micro-ceramic heater (Sakaguchi Ltd.
MS1000) with a power of 1kW, and was heated up to 1000
o
C within 3 minutes. Hence, the
bottom part of the specimen experienced the large temperature difference, while the upper
part was heated through the heat conductivity of the specimen. The temperature
distribution as measured by thermocouples is shown in fig. 1c of [Wunderlich & Soga 2010].
Seebeck voltages were measured on both, the bottom and top part of the specimen by Ni-
wires, which were connected to voltmeters (Sanwa PC510), marked as V1 and V2 in the inset
of fig. 13 b. The temperature was measured with thermocouples also attached to voltmeters.
The data were recorded online by a personal computer.
Most TE-literature reports TE-data measured under small temperature gradient [Bulusu &
Walkner 2008], where the theory is valid for. Our device however, measures the data under
large temperature gradient, which is close to applications. When comparing such measured
data with literature data on similar specimens (CoTiSb, Fe), in general about 1.5 times larger
values for the Seebeck voltages are obtained.
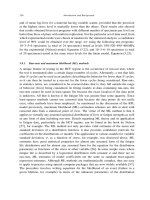
Fig. 13. Temperature (on the left y-axis), Seebeck Voltage and short-circuit current (both on
the right y-axis) as a function of time. The inset shows the scheme of the experimental setup
for measuring the Seebeck voltage and the closed circuit current. (a) Typical measurement
for NaTaO
3
+ 50 wt% Fe, (b) Seebeck voltage response for NaTaO
3
+ 50 wt% Cu, when the
heater is switched off or on (red line).
Development of Thermoelectric materials based on NaTaO3 - composite ceramics 13
section 2.4. Hence, it can be concluded, that the octahedron tilting mentioned in section 2
was suppressed by the doping.
Fig. 12. SEM micrographs of the as-prepared surfaces of different NaTaO
3
-composites
processed by adding 40 wt% of (a) Fe, (b) Ag, (c) Ti, (d) Mo, (e) Mn, (e) Cr, (g) Ni, (h) W.
The microstructure of the NaTaO
3
composite processed with 50 wt% Fe consists of a
NaTaO
3
- 50 mol% Fe
2
O
3
composite as shown in fig. 12 a. It consists of dark Fe
2
O
3
particles,
on average 10 m in size, and appearing in streaks-like shape, which are embedded in a
grey NaTaO
3
matrix. Detailed explanation is provided in a previous paper [Wunderlich &
Soga 2010]. When NaTaO
3
is initially processed with Fe
2
O
3
instead of Fe, the microstructure
looks like a sintered ceramic composite with white Fe
2
O
3
besides white NaTaO
3
particles.
The change from black to white color can be explained by oxygen saturation as explained in
section 6. Such a micrograph is shown in a previous paper [Wunderlich 2009-b]. The white
areas in fig. 12 a are pores remaining from insufficient compaction during sintering or from
released oxygen as explained in section 5.
In NaTaO
3
-composites containing Ag, Ti, Mn, and Ni the dark, metallic particles are slightly
bigger (5~10 m). The particles have a volume fraction of about 30% which correspond well
to the intensity ratios of the XRD-pattern. In specimens, which were produced from Fe
2
O
3
-
instead of Fe-powder, the Fe
2
O
3
-particles form round particles as shown in fig. 3 a in
[Wunderlich 2009-b]. In the case of Cr the dark, metallic Cr-particles are significantly larger
(20 m), which can be explained by their low diffusivity. The same would be expected for
Mo and W with their high melting points, but instead they lead to faceted interfaces. By
chemical mapping homogeneous distribution of Na, Ta, Mo or W was confirmed. The two
elements, Mo, and W, having their location in the period system and their atomic radii close
to Ta, and, hence, can inter-diffuse easily with Ta. They lower the surface energy of certain
crystallographic planes, which is an important fact to be kept in mind when nano-layered
composite materials based on NaTaO
3
are desired.
The main goal of doping is to increase the carrier concentration of NaTaO
3
in order to
increase the conductivity. In a composite this can only be achieved by increasing the
concentration of the dissolved element. Composition measurements by EDX in SEM with
lateral resolution of 1 m were performed on the NaTaO
3
-phase in the NaTaO
3
-composites
processed with different metals. For Cr, Mo and W concentrations below 2 at% were
detected, for Ag, Ti, Mn, and Ni, 5 ~ 10 at% were detected and for Fe 14 at%. This result can
Is a necessity for a thermoelectric material and explains the success of Fe and Ag for the TE-
performance as explained in the following section.
5. Thermoelectric characterization
5.1 Measuring device
The thermoelectric measurements were performed with a self-manufactured device as
shown in the inset of fig. 13. The specimen was attached to the device, so that its left side lies
on a copper block as a heat sink and its right side on a micro-ceramic heater (Sakaguchi Ltd.
MS1000) with a power of 1kW, and was heated up to 1000
o
C within 3 minutes. Hence, the
bottom part of the specimen experienced the large temperature difference, while the upper
part was heated through the heat conductivity of the specimen. The temperature
distribution as measured by thermocouples is shown in fig. 1c of [Wunderlich & Soga 2010].
Seebeck voltages were measured on both, the bottom and top part of the specimen by Ni-
wires, which were connected to voltmeters (Sanwa PC510), marked as V1 and V2 in the inset
of fig. 13 b. The temperature was measured with thermocouples also attached to voltmeters.
The data were recorded online by a personal computer.
Most TE-literature reports TE-data measured under small temperature gradient [Bulusu &
Walkner 2008], where the theory is valid for. Our device however, measures the data under
large temperature gradient, which is close to applications. When comparing such measured
data with literature data on similar specimens (CoTiSb, Fe), in general about 1.5 times larger
values for the Seebeck voltages are obtained.
Fig. 13. Temperature (on the left y-axis), Seebeck Voltage and short-circuit current (both on
the right y-axis) as a function of time. The inset shows the scheme of the experimental setup
for measuring the Seebeck voltage and the closed circuit current. (a) Typical measurement
for NaTaO
3
+ 50 wt% Fe, (b) Seebeck voltage response for NaTaO
3
+ 50 wt% Cu, when the
heater is switched off or on (red line).
Ceramic Materials 14
By putting the specimen completely above the ceramics heater, the temperature dependence
of the electric resistivity was measured with the same device as shown previously
[Wunderlich 2009-b, Wunderlich & Soga 2010]. The reason, why the Seebeck voltage only
appears when heated above 500°C, can be explained by the poor electric conductivity at low
temperatures. The room temperature resistivity of such samples decreases from about 10
M to 0.1 M when sintered in at least five sintering steps (1000
o
C, 5h) [Wunderlich & Soga
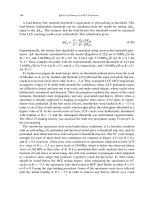
2010]. The temperature dependence of the resistivity was measured. The activation energy
E
A
for thermal activation of the charge carriers n
e
in this n-doped semiconductors was
estimated according to n
e
= N exp (-E
A
/2kT) by a suitable data fit. This analysis yield to an
activation energy for charge carriers of about 1 eV during heating and 0.6 eV during cooling
[Wunderlich 2009-b].
Another option of this device is the measurement of the closed circuit current. For this
option, the wires below the specimen are connected with resistances of 1, 10, 100, 1k,
or 1M in a closed circuit condition as seen in the inset of fig. 13 a. As the measured electric
current is a material dependent property, it is recorded too. As shown in fig. 13 a or fig. 3 in
[Wunderlich 2009-b], as soon as the circuit is closed, the voltage of the NaTaO
3
- 30mol%
Fe
2
O
3
specimen drops down, and the current increases according to the amount of load with
a short delay time of a few ms. The detection limits are about U=1mV and I=0.8A.
5.2 Time-dependence of Seebeck voltage
For the most specimens, the Seebeck voltage is not time-dependent and only depends on the
temperature gradient. Time-dependent effects of the Seebeck-voltage occurrence have been
reported for Co-based rare-earth Perovskite-composites (for example Gd
2
O
3
+CoO
x
) [Wunderlich
& Fujizawa. 2009-d] and were explained as a combined occurrence of pyro-electricity and
thermoelectricity. In some Co-based perovskite specimes remarkable non-linearities in the plot
Seebeck voltage versus temperature difference appear, but not in NaTaO
3
.
A time-dependent Seebeck voltage behavior appears at specimens NaTaO
3
+ x Cu, with x from
30 to 50 wt%, as shown in fig. 13 b for x= 50wt%. On such specimens in general only a small
Seebeck voltage of only -5 mV is measured, even at temperatures above 500
o
C, when a
sufficiently high charge carrier concentration is reached. However, when then the heater is
switched off suddenly, a sharp pulse, a few milliseconds in length, of the Seebeck voltage with a
value of 20 mV is measured with a negative sign. When switching on the heater again, the sign
reverses to a positive pulse of Seebeck voltage with the same absolute value of 20mV. The
Seebeck voltage on the backside of the specimen, which experiences the temperature gradient
only indirectly through heat conduction, is not so high in its absolute value (12 mV for a 5 mm
thick specimen), but it appears with the same sign and at the same time. In fig. 13 b this is shown
in dark-green, while the pulse of the specimen side with the large temperature gradient is shown
in light-green. The value of the Seebeck pulse is independent on the time-interval between the
heat flow reversals, just the Seebeck voltage between the pulses fluctuates between 2 and 10
times of its absolute value. Only when the temperature gradient decreases (right side of fig. 13b),
the absolute value of the pulse becomes smaller.
This heat flow dependent Seebeck pulse in time appears also in NaTaO
3
+ x Ag specimens,
which were sintered only for a short time (1000
o
C, 5h). The reason is not yet completely
investigated, but the interface between NaTaO
3
and metallic particles, which are not reactive
with NaTaO
3
, is responsible for this effect. It is different from pyroelectricity, which showed
a similar behavior like an electric capacitor. The heat-flow dependent Seebeck voltage pulse
can be utilized for building a heat-flow meter, which would be able to detect the forward or
backward direction of the heat flow, due to the sign of the voltage pulse. By micro
fabrication several such specimens could be arranged under different angles to heat flow, so
that the vector of the heat flow can be determined, and when such devices are arranged in
an array, even the heat flow tensor can be measured.
5.3 Seebeck voltage measured under large temperature gradients
The measurements of the Seebeck voltage U
See
are shown in fig. 14, where a temperature
gradient of up to T = 800 K was applied to the specimens and the Seebeck voltage
measured as explained in section 5.1. The specimens with NaTaO
3
+x Fe were measured for
x = 30, 40, 50, 60, 70, 80, 90 wt%. The specimen with x= 50, 60, 70 wt% showed the high
Seebeck voltages of about -300 mV as shown in fig. 14 a, details are explained in previous
publications [Wunderlich 2009-b, Wunderlich & Soga 2010]. From the plot temperature
difference dT versus Seebeck voltage U
S
a Seebeck coefficient S of 0.5 mV/K was estimated
by the slope S = dU
S
/dT.
As the XRD results showed the formation of Fe
2
O
3
, also NaTaO
3
+ r Fe
2
O
3
specimens were
sintered, were r was 30, 50, 70, 90 wt%. These specimens showed all a Seebeck voltage of +60
mV at T = 800K with a slightly nonlinear T-dependence. Hence, different processing
causes a different oxidation state of the second component in this composite, and changes
the n-type NaTaO
3
+x Fe into a p-type NaTaO
3
+ r Fe
2
O
3
composite. As mentioned above,
the microstructure looks slightly different for both composites and the thermo-kinetic
measurements in section 6 too.
When metallic Ni is added to NaTaO
3
, the sintered composites with x= 30 wt% Ni showed
the highest value of -320 mV with a Seebeck coefficient of 0.57 mV/K, as shown in fig. 14 b.
In this case non-linear behavior at T = 650 K during heating, and T = 600K during cooling
appears at all Ni-specimens, but not at other elements, and is probably related to some
phase transitions. In the case of W additions to NaTaO
3
the specimens showed only a small
Seebeck voltage of -30 mV for all concentrations in the range 30 to 90 wt% (fig. 14 c). A
similar behavior is seen for Mo, where the 50 wt% sample showed a Seebeck voltage of -10
mV during heating and +10 mV during cooling. The plots of Seebeck voltage versus
temperature difference are linear.
Fig. 14. Seebeck Voltage as a function of the temperature difference for (a) NaTaO
3
+50 wt%
Fe, (b) NaTaO
3
+30 wt% Ni, (c) NaTaO
3
+50 wt% W, (d) NaTaO
3
+50 wt% Mo. The slope of
the plots yield to the Seebeck-coefficients as mentioned.
Development of Thermoelectric materials based on NaTaO3 - composite ceramics 15
By putting the specimen completely above the ceramics heater, the temperature dependence
of the electric resistivity was measured with the same device as shown previously
[Wunderlich 2009-b, Wunderlich & Soga 2010]. The reason, why the Seebeck voltage only
appears when heated above 500°C, can be explained by the poor electric conductivity at low
temperatures. The room temperature resistivity of such samples decreases from about 10
M to 0.1 M when sintered in at least five sintering steps (1000
o
C, 5h) [Wunderlich & Soga
2010]. The temperature dependence of the resistivity was measured. The activation energy
E
A
for thermal activation of the charge carriers n
e
in this n-doped semiconductors was
estimated according to n
e
= N exp (-E
A
/2kT) by a suitable data fit. This analysis yield to an
activation energy for charge carriers of about 1 eV during heating and 0.6 eV during cooling
[Wunderlich 2009-b].
Another option of this device is the measurement of the closed circuit current. For this
option, the wires below the specimen are connected with resistances of 1, 10, 100, 1k,
or 1M in a closed circuit condition as seen in the inset of fig. 13 a. As the measured electric
current is a material dependent property, it is recorded too. As shown in fig. 13 a or fig. 3 in
[Wunderlich 2009-b], as soon as the circuit is closed, the voltage of the NaTaO
3
- 30mol%
Fe
2
O
3
specimen drops down, and the current increases according to the amount of load with
a short delay time of a few ms. The detection limits are about U=1mV and I=0.8A.
5.2 Time-dependence of Seebeck voltage
For the most specimens, the Seebeck voltage is not time-dependent and only depends on the
temperature gradient. Time-dependent effects of the Seebeck-voltage occurrence have been
reported for Co-based rare-earth Perovskite-composites (for example Gd
2
O
3
+CoO
x
) [Wunderlich
& Fujizawa. 2009-d] and were explained as a combined occurrence of pyro-electricity and
thermoelectricity. In some Co-based perovskite specimes remarkable non-linearities in the plot
Seebeck voltage versus temperature difference appear, but not in NaTaO
3
.
A time-dependent Seebeck voltage behavior appears at specimens NaTaO
3
+ x Cu, with x from
30 to 50 wt%, as shown in fig. 13 b for x= 50wt%. On such specimens in general only a small
Seebeck voltage of only -5 mV is measured, even at temperatures above 500
o
C, when a
sufficiently high charge carrier concentration is reached. However, when then the heater is
switched off suddenly, a sharp pulse, a few milliseconds in length, of the Seebeck voltage with a
value of 20 mV is measured with a negative sign. When switching on the heater again, the sign
reverses to a positive pulse of Seebeck voltage with the same absolute value of 20mV. The
Seebeck voltage on the backside of the specimen, which experiences the temperature gradient
only indirectly through heat conduction, is not so high in its absolute value (12 mV for a 5 mm
thick specimen), but it appears with the same sign and at the same time. In fig. 13 b this is shown
in dark-green, while the pulse of the specimen side with the large temperature gradient is shown
in light-green. The value of the Seebeck pulse is independent on the time-interval between the
heat flow reversals, just the Seebeck voltage between the pulses fluctuates between 2 and 10
times of its absolute value. Only when the temperature gradient decreases (right side of fig. 13b),
the absolute value of the pulse becomes smaller.
This heat flow dependent Seebeck pulse in time appears also in NaTaO
3
+ x Ag specimens,
which were sintered only for a short time (1000
o
C, 5h). The reason is not yet completely
investigated, but the interface between NaTaO
3
and metallic particles, which are not reactive
with NaTaO
3
, is responsible for this effect. It is different from pyroelectricity, which showed
a similar behavior like an electric capacitor. The heat-flow dependent Seebeck voltage pulse
can be utilized for building a heat-flow meter, which would be able to detect the forward or
backward direction of the heat flow, due to the sign of the voltage pulse. By micro
fabrication several such specimens could be arranged under different angles to heat flow, so
that the vector of the heat flow can be determined, and when such devices are arranged in
an array, even the heat flow tensor can be measured.
5.3 Seebeck voltage measured under large temperature gradients
The measurements of the Seebeck voltage U
See
are shown in fig. 14, where a temperature
gradient of up to T = 800 K was applied to the specimens and the Seebeck voltage
measured as explained in section 5.1. The specimens with NaTaO
3
+x Fe were measured for
x = 30, 40, 50, 60, 70, 80, 90 wt%. The specimen with x= 50, 60, 70 wt% showed the high
Seebeck voltages of about -300 mV as shown in fig. 14 a, details are explained in previous
publications [Wunderlich 2009-b, Wunderlich & Soga 2010]. From the plot temperature
difference dT versus Seebeck voltage U
S
a Seebeck coefficient S of 0.5 mV/K was estimated
by the slope S = dU
S
/dT.
As the XRD results showed the formation of Fe
2
O
3
, also NaTaO
3
+ r Fe
2
O
3
specimens were
sintered, were r was 30, 50, 70, 90 wt%. These specimens showed all a Seebeck voltage of +60
mV at T = 800K with a slightly nonlinear T-dependence. Hence, different processing
causes a different oxidation state of the second component in this composite, and changes
the n-type NaTaO
3
+x Fe into a p-type NaTaO
3
+ r Fe
2
O
3
composite. As mentioned above,
the microstructure looks slightly different for both composites and the thermo-kinetic
measurements in section 6 too.
When metallic Ni is added to NaTaO
3
, the sintered composites with x= 30 wt% Ni showed
the highest value of -320 mV with a Seebeck coefficient of 0.57 mV/K, as shown in fig. 14 b.
In this case non-linear behavior at T = 650 K during heating, and T = 600K during cooling
appears at all Ni-specimens, but not at other elements, and is probably related to some
phase transitions. In the case of W additions to NaTaO
3
the specimens showed only a small
Seebeck voltage of -30 mV for all concentrations in the range 30 to 90 wt% (fig. 14 c). A
similar behavior is seen for Mo, where the 50 wt% sample showed a Seebeck voltage of -10
mV during heating and +10 mV during cooling. The plots of Seebeck voltage versus
temperature difference are linear.
Fig. 14. Seebeck Voltage as a function of the temperature difference for (a) NaTaO
3
+50 wt%
Fe, (b) NaTaO
3
+30 wt% Ni, (c) NaTaO
3
+50 wt% W, (d) NaTaO
3
+50 wt% Mo. The slope of
the plots yield to the Seebeck-coefficients as mentioned.
Ceramic Materials 16
Na Mg Al Si P
/ / 0 / /
K * Ca Sc Ti V Cr Mn
Fe
Co Ni Cu Zn Ga Ge As
-30 / / -20 / -200 -30
-320
-20 -360 -20 / / / /
Rb Sr Y Zr Nb Mo Tc Ru Rh Pd
Ag
Cd In Sn Sb
/ / / / / -10/+10 / / / /
+250
/ / 0 0
Cs Ba Hf Ta W Re Os Ir Pt Au Hg Tl Pb Bi
/ / / -20 / / / / / / / / 0
* KTaO
3
+Fe
Fig. 15. Part of the periodic table showing the elements which were tested as doping
additives for NaTaO
3
. The vale refers to the Seebeck voltage in mV at T = 750K. In the case
of K it means KTaO
3
with Fe-additions. Only the two elements in bold letters (Fe, Ag)
showed a remarkable closed-circuit current.
Such measurements were performed by adding several metallic elements Me from the
periodic system NaTaO
3
+x Me specimens with x = 30, 50, 70, 90 wt%. Fig. 15 shows the
largest Seebeck voltage at T=800 K among these specimens, where the best results usually
were achieved for x around 50 wt%. Al and those semiconducting elements which were
measured did not dissolve in NaTaO
3
and such specimens remain white, a sign that they are
still insulators.
Specimens sintered from NaTaO
3
- x Ag powders with x= 30, 50, 60 wt% lead to p-type
thermoelectrics. The Seebeck coefficient as deduced from fig. 14 a, Fe as n-type, and the
corresponding plot for Ag as p-type [Wunderlich 2009-b] yield for both composites to
almost the same value, namely +/- 0.5mV/K. In the case of NaTaO
3
+ x Fe specimens, the
Seebeck voltage increases during the first three sintering cycles (1000
o
C 5h), and reached
this saturation value, which was confirmed to be stable even after eight sintering cycles. In
the case of Ag-doped NaTaO
3
, the value also increases, however, after the fourth sintering
cycle the Seebeck voltage drops to less than 30mV and the color turns into white again,
indicating a structural instability of the NaTaO
3
-Ag compound probably due to silver
evaporation. The temperature dependence of the electric resistivity was shown previously
[Wunderlich 2009-b, Wunderlich & Soga 2010] for both, n- and p-type specimens, with x= 50
wt%, which was found as the optimum concentration for low resistivity. According to the
thermal activation of the carriers an activation energy in the order of the band gap (1 eV) can
be estimated by fitting the data as shown in [Wunderlich 2009-b, Wunderlich & Soga 2010]
by the formula
= N
0
exp(-E
0
/2kT) |e|
e
. with E
0
activation energy.
There are further promising doping candidates, not yet checked, as Nb, or rare earth. As a
conclusion, it can be stated that only the light transition metals like Fe, Cr, Mn, Ni showed
remarkable Seebeck voltages. Among them, the closed-circuit measurements described in
the following section, lead to further restrictions.
5.4 Electric current under closed circuit conditions
For power generation the performance under closed circuit conditions is important. Fig. 16
shows the measured current when different electric resistances as load are connected. While
both composites, the one processed from NaTaO
3
+x Fe and the NaTaO
3
- x Ag one, showed
large Seebeck voltage in the range of x = 50 to 70 wt%, the closed circuit current
measurements showed the highest value only for the specimen processed from NaTaO
3
+x
Fe with x= 50 wt%, which corresponds to NaTaO
3
+r Fe
2
O
3
with r = 32 mol% after sintering.
In the silver added composite, the specimen with 40 mol% Ag (about 50 wt%) yields to the
optimum between large Seebeck coefficient and low resistivity. For the NaTaO
3
-x Fe
2
O
3
-
composite, the specimen with x = 32 mol % shows the highest current of 320 A, but for the
Fig. 16. Seebeck Voltage and closed circuit current for n- and p-type NaTaO
3
with Fe- or Ag-
additions with the Mol-% as shown. The horizontal and vertical arrows indicate the target
for current and voltage increase, the inclined ones indicate the target for power
improvement. P- and n-type materials should have the same Seebeck voltage as expressed
by the target-line.
NaTaO
3
-x Ag-composite, it is only 1.2 A. For the silver added composite, a part of Ag gets
dissolved, another part gets oxidized as NaTa
1-x
Ag
x
O
3-y
+ t AgO
u
, when sintered in three
cycles (1000
o
C 5h). While NaTaO
3
- Fe
2
O
3
is a stable composite, the metallic Ag in the p-type
composite with its low melting point decomposes into an insulating oxide after four
sintering cycles (1000
o
C, 5h), and metallic silver balls at the surface.
The microstructure of the p-type material needs to be stabilized and optimized for
improving both, Seebeck voltage as well as resistivity. When this is realized, and the p-type
material would have had the same short-circuit current as suggested by the target line in fig.
16, it is expected that modules with both n- and p-type materials work optimal. As p- and n-
type material has been found, NaTaO
3
is suggested as a new thermoelectric for power
generation suitable for applications in an upper range of application temperatures (500 to
1100
o
C), when a sufficient performance is achieved as described in the next section.
5.5 Estimation of the figure-of-merit
The absolute value of the negative Seebeck Voltage increases linearly with the temperature
and reaches -320 mV at a temperature difference of 800 K as shown in fig. 14 a for the
specimen NaTaO
3
-50mol% Fe
2
O
3
. From the slope of the Seebeck voltage versus temperature
a Seebeck coefficient of -0.5 mV/K was estimated. Specimens in the range of 20 mol to 70
mol% Fe
2
O
3
showed all a Seebeck coefficient larger than -0.45 mV/K. From these data the
figure of merit can be deduced, a little bit more promising as previously [Wunderlich 2009-
b]. For the thermal conductivity in the worst case a high value of 5 W/(m K) was assumed
Development of Thermoelectric materials based on NaTaO3 - composite ceramics 17
Na Mg Al Si P
/ / 0 / /
K * Ca Sc Ti V Cr Mn
Fe
Co Ni Cu Zn Ga Ge As
-30 / / -20 / -200 -30
-320
-20 -360 -20 / / / /
Rb Sr Y Zr Nb Mo Tc Ru Rh Pd
Ag
Cd In Sn Sb
/ / / / / -10/+10 / / / /
+250
/ / 0 0
Cs Ba Hf Ta W Re Os Ir Pt Au Hg Tl Pb Bi
/ / / -20 / / / / / / / / 0
* KTaO
3
+Fe
Fig. 15. Part of the periodic table showing the elements which were tested as doping
additives for NaTaO
3
. The vale refers to the Seebeck voltage in mV at T = 750K. In the case
of K it means KTaO
3
with Fe-additions. Only the two elements in bold letters (Fe, Ag)
showed a remarkable closed-circuit current.
Such measurements were performed by adding several metallic elements Me from the
periodic system NaTaO
3
+x Me specimens with x = 30, 50, 70, 90 wt%. Fig. 15 shows the
largest Seebeck voltage at T=800 K among these specimens, where the best results usually
were achieved for x around 50 wt%. Al and those semiconducting elements which were
measured did not dissolve in NaTaO
3
and such specimens remain white, a sign that they are
still insulators.
Specimens sintered from NaTaO
3
- x Ag powders with x= 30, 50, 60 wt% lead to p-type
thermoelectrics. The Seebeck coefficient as deduced from fig. 14 a, Fe as n-type, and the
corresponding plot for Ag as p-type [Wunderlich 2009-b] yield for both composites to
almost the same value, namely +/- 0.5mV/K. In the case of NaTaO
3
+ x Fe specimens, the
Seebeck voltage increases during the first three sintering cycles (1000
o
C 5h), and reached
this saturation value, which was confirmed to be stable even after eight sintering cycles. In
the case of Ag-doped NaTaO
3
, the value also increases, however, after the fourth sintering
cycle the Seebeck voltage drops to less than 30mV and the color turns into white again,
indicating a structural instability of the NaTaO
3
-Ag compound probably due to silver
evaporation. The temperature dependence of the electric resistivity was shown previously
[Wunderlich 2009-b, Wunderlich & Soga 2010] for both, n- and p-type specimens, with x= 50
wt%, which was found as the optimum concentration for low resistivity. According to the
thermal activation of the carriers an activation energy in the order of the band gap (1 eV) can
be estimated by fitting the data as shown in [Wunderlich 2009-b, Wunderlich & Soga 2010]
by the formula
= N
0
exp(-E
0
/2kT) |e|
e
. with E
0
activation energy.
There are further promising doping candidates, not yet checked, as Nb, or rare earth. As a
conclusion, it can be stated that only the light transition metals like Fe, Cr, Mn, Ni showed
remarkable Seebeck voltages. Among them, the closed-circuit measurements described in
the following section, lead to further restrictions.
5.4 Electric current under closed circuit conditions
For power generation the performance under closed circuit conditions is important. Fig. 16
shows the measured current when different electric resistances as load are connected. While
both composites, the one processed from NaTaO
3
+x Fe and the NaTaO
3
- x Ag one, showed
large Seebeck voltage in the range of x = 50 to 70 wt%, the closed circuit current
measurements showed the highest value only for the specimen processed from NaTaO
3
+x
Fe with x= 50 wt%, which corresponds to NaTaO
3
+r Fe
2
O
3
with r = 32 mol% after sintering.
In the silver added composite, the specimen with 40 mol% Ag (about 50 wt%) yields to the
optimum between large Seebeck coefficient and low resistivity. For the NaTaO
3
-x Fe
2
O
3
-
composite, the specimen with x = 32 mol % shows the highest current of 320 A, but for the
Fig. 16. Seebeck Voltage and closed circuit current for n- and p-type NaTaO
3
with Fe- or Ag-
additions with the Mol-% as shown. The horizontal and vertical arrows indicate the target
for current and voltage increase, the inclined ones indicate the target for power
improvement. P- and n-type materials should have the same Seebeck voltage as expressed
by the target-line.
NaTaO
3
-x Ag-composite, it is only 1.2 A. For the silver added composite, a part of Ag gets
dissolved, another part gets oxidized as NaTa
1-x
Ag
x
O
3-y
+ t AgO
u
, when sintered in three
cycles (1000
o
C 5h). While NaTaO
3
- Fe
2
O
3
is a stable composite, the metallic Ag in the p-type
composite with its low melting point decomposes into an insulating oxide after four
sintering cycles (1000
o
C, 5h), and metallic silver balls at the surface.
The microstructure of the p-type material needs to be stabilized and optimized for
improving both, Seebeck voltage as well as resistivity. When this is realized, and the p-type
material would have had the same short-circuit current as suggested by the target line in fig.
16, it is expected that modules with both n- and p-type materials work optimal. As p- and n-
type material has been found, NaTaO
3
is suggested as a new thermoelectric for power
generation suitable for applications in an upper range of application temperatures (500 to
1100
o
C), when a sufficient performance is achieved as described in the next section.
5.5 Estimation of the figure-of-merit
The absolute value of the negative Seebeck Voltage increases linearly with the temperature
and reaches -320 mV at a temperature difference of 800 K as shown in fig. 14 a for the
specimen NaTaO
3
-50mol% Fe
2
O
3
. From the slope of the Seebeck voltage versus temperature
a Seebeck coefficient of -0.5 mV/K was estimated. Specimens in the range of 20 mol to 70
mol% Fe
2
O
3
showed all a Seebeck coefficient larger than -0.45 mV/K. From these data the
figure of merit can be deduced, a little bit more promising as previously [Wunderlich 2009-
b]. For the thermal conductivity in the worst case a high value of 5 W/(m K) was assumed