Lifetime-Oriented Structural Design Concepts- P2 potx
Bạn đang xem bản rút gọn của tài liệu. Xem và tải ngay bản đầy đủ của tài liệu tại đây (655.14 KB, 30 trang )
XXXII List of Figures
3.78 Load historywith various rest periods [150] . . . . . . . . . . . . . . . . . 192
3.79Behaviour ofthelong itudinal strain at
S
max
/S
min
=0.675/0.10 192
3.80 Related longitudinal strain at S
max
/S
min
=0.675/0.10 193
3.81 Correlation between the fatigue strain andtheresidual
stiffness subjected to differentsequences ofcyclic loading 194
3.82 Steps ofexposure andmeasuring duringCDF/CIF test [731] . . 195
3.83 Examplerelationshipbetween RDM andrelativemoisture
uptake - concrete type 2 [610] . . . . . . . . . . . . . . . . . . . . . . . . . . . . . 195
3.84 Internal damage due to freeze-thaw cycles at several depths
ofthespecimen(left), Moisture uptake vs.number of
freeze-thaw cycles (right) 197
3.85Test devices anddefinitions 199
3.86 Cyclic flow rule (I) 200
3.87 Cyclic flow rule (II) 201
3.88 Intensityof accumulation in drained cyclicelement tests on
soils (I) 202
3.89Intensityof accumulation in drained cyclicelement tests on
soils (II) 204
3.90 Influence ofthegrain size distribution curve on D
acc
205
3.91 Undrained cyclictests 206
3.92Effect ofcycles at σ = 0 207
3.93 Application of headed shear studs in composite bridges 208
3.94 Load-deflection behaviour of headed shear studs embedded
in solidconcrete slabs under static loading 209
3.95 Fatigue strength curveforcyclic loaded headed shear studs
according [685] 210
3.96 Safety concept to determinethelifetime ofcomposite
structures subjected to high cycle loading 211
3.97 Tests with multipleblocks of loading 213
3.98 Tests to compare the effect ofthemode control - force control
vs. displacementcontrol - andtheeffect of low temperature 215
3.99 Duration ofthecrackinitiation phase andcrackgrowth
velocity due toverylowcyclic loads [685] 216
3.100 Details of the push-out test specimen 216
3.101 Servo hydraulicactuators 217
3.102 Position oftransducers 218
3.103 Development ofplasticslip over the fatigue life in series
S1 - S4 220
3.104 Decrease ofstaticstrength vs.lifetime due to high cycle
loading 221
3.105 Test programme and loading parameters ofthecomposite
beam tests VT1 and VT2 226
3.106 Details of test beam VT1 228
3.107 Details of test beam VT2 229
List of Figures XXXIII
3.108 Test setup of test beams VT1 and VT2 230
3.109 Electriccircuitto detect complete shear failure ofheaded
studs 231
3.110 Change of initial deflections due to cyclic loading 234
3.111 Load-deflection behaviour of test beams VT1 and VT2 in the
static tests after cyclic loading 234
3.112Experimental determination of the reduced staticstrength of
the steel section near midspan after high cyclepre-loading 235
3.113 Slipalongtheinterfaces ofsteel andconcrete after first
loadingandaftercyclic loading 236
3.114Cracklengths at the stud feet after the cyclic loading phase -
Preparation stages forexamination purposes 237
3.115 Representation ofdifferentfailure surfaces in the principal
strain space 239
3.116 Stress-strain diagrams foruniaxial c ompressiveandtensile
loading obtained from the damage model by Mazars 240
3.117 Anisotropic damage model by[604]: Illustration ofthefailure
surface in the principal stress space, see eq.(3.29) 242
3.118 Definition ofalocal coordinate system anddecomposition
ofthetraction vector t =into the normal part t
n
andthe
tangential part t
m
243
3.119 Anisotropicelastoplastic damage model by[534]: Influence of
the scalar coupling parameter β on the stress-strain diagram 246
3.120Yieldconditions 247
3.121Stress-strain relation ofconcrete 249
3.122 Discrete representation ofcracks:Traction separation lawof
the format t = t(
u
) across the crack surface 253
3.123Strong DiscontinuityApproach:Additivedecomposition of
the displacementfield u (equation (3.84)) 254
3.124 Strong DiscontinuityApproach:Strain fieldresultingfrom
the displacementfield u(x)=
¯
u(x)+
ˆ
u(x) 254
3.125Model-based concept for life time assessment ofmetallic
structures 257
3.126
Numerical and experimental data for (a) material softening and
(b) ratcheting effect
259
3.127 Low Cycle Fatigue in metals:Numerical andexperimental
results forcyclically loaded round notched bar 260
3.128 Low Cycle Fatigue in metals:Damage accumulation and
predicted damage in acyclically loaded round notched bar 261
3.129 S-N -approach 263
3.130 Degradation ofcompressivestrength andsequence effects 263
3.131 Evaluation of the approach for sequence effects 264
3.132Rheological element 265
3.133 Fatigue strain evolution 267
3.134 Split offatigue strains 268
XXXIV List of Figures
3.135 Evaluation ofthesplit variable β
fat
268
3.136 Kinked crack and its equivalentelliptical cr ack 277
3.137Growth ofthecircular crack and its equivalentelliptical
crack 279
3.138Orderoftheconsidered sequentialloading 280
3.139 Evolution ofthegeometry andtheorientations ofthe
equivalentelliptical cr
ack
281
3.140 Evolution ofthestiffness components in the principle
directions 282
3.141Specimen geometry anddifferent mesh patterns 283
3.142 Load-cyclecurves fordifferent mesh patterns 284
3.143 Chemo-mechanical damage ofporous materials within the
Theoryof Mixtur
es
295
3.144 Conductivityofthepore fluid D
0
andmacroscopic
conductivityof non-reactiveporous media φD
0
299
3.145 Chemical equilibrium function by G
´
erard [307,308] and
Delagrave et al. [232] 302
3.146Microstructure, constituents and volume fractions ofconcrete
as a partially saturated porous media 303
3.147 Chemical material parameters k and
u
/
r
− 1 and oftheir
depe ndence on the liquid saturation s
l
312
3.148 Theoretical model for the prediction ofthemeanvalue ofthe
ultimate shear resistance according [684] 317
3.149 Result ofthestatistical analysis of the results of 101 statically
loaded push-out tests accordingto EN 1990 [16] . . . . . . . . . . . . . 322
3.150 Comparison of the result ofthestatistical analysis with
the
rules in cu
rrentGerman andEuropean standards 324
3.151 Preparation stages forexamination purposes 324
3.152 Failure modes A a nd B 325
3.153 Weldcollar - Close-up viewofthecrackshowninFigure
3.152 326
3.154Correlation between reduced staticstrength and
damage at
the s
tud feet based on the fatigue fracture area 327
3.155 Correlation between reduced staticstrength and damage at
the stud feet based on crack lengths 328
3.156 Comparison offatigue test results with the prediction in
Eurocode 4 329
3.157 Model for the prediction ofthefatigue life of a headed shear
stud in a push-out test 331
3.158 (a) Reduced staticstrength over lifetime,(b) Comparison
of
the r
educed staticstrength 331
3.159 Load-slipcurve of headed shear studs -load deflection
behaviour 332
3.160 Effect ofhigh-cycle loading on the load-slipbehaviour 333
3.161 Elasticstiffness and accumulated plasticslip 334
List of Figures XXXV
3.162Relationshipbetween crack velocity, crack propagation and
reduction ofstaticstrength 335
3.163 Fatigue strength and lifetime ofcyclic loaded shear studs 336
3.164Comparison between the test results with the lifetime
prediction 338
3.165 Damage accumulation consideringtheload sequence effects 339
3.166 Damage accumulatio
n in the c
ase ofmultipleblock loading
tests with decreasingpeakloads 340
3.167Comparison between the test results with the results ofthe
lifetime prediction 340
3.168 Ductility after high cycle loading 341
3.169 Comparison between test results andfinite element
calculatio
ns
342
3.170 Comparison between test results andfinite element
calculations 343
3.171Test ser ies S9 - Effect ofcontrol mode - Effect of low
temperature 345
3.172 Failure surface oftheimproved material model CONCRETE 347
3.173 Compa
rison between t
he results of numerical simulationsand
test results 348
3.174 Test beam VT1 - Effect ofhigh cycle loading on load bearing
capacity 348
3.175 Cyclicbehaviour of test beam VT1 350
3.176Test beam VT2 - Effect ofhigh cycle loading -Typical crac
k
formati
on 351
3.177 Geometryofatunnel liningsubjected to cyclichygral and
thermalloading 352
3.178 Evolution ofthecrackwidth w ofatunnel liningsubjected
to cyclichygral andthermalloading 352
3.179Scalar damage measure d at the crown ofatunnel lining
subjected to cyc lichygral andthermall
oading
353
3.180Liquid saturation S
l
at the crown ofatunnel liningsubjected
to cyclichygral andthermalloading 354
3.181Simulation of a cementitious beam exposed to calcium
leachingandmechanicalloading 355
3.182 Temporal evolution ofthevertical displacement u
s
ofthe
cementitious beam andprediction ofthecollapse 355
3.183 Chemo-mechanical analysis ofaconcrete panel: Conditions 356
3.184 Chemo-mechanical analysis ofaconcrete panel: Results I 358
3.185 Chemo-mechanical analysis ofaconcrete panel: Results II 359
3.186Numerical simulatio
n ofa
concrete beam affected by
alkali-silica reaction: Conditions 360
3.187 Numerical simulation ofaconcrete beam affected by
alkali-silica reaction: Results I 361
XXXVI List of Figures
3.188 Numerical simulation ofaconcrete beam affected by
alkali-silica reaction: Results II 362
3.189Numerical simulation ofaconcrete beam affected by
alkali-silica reaction: Results III 363
3.190 Low Cycle Fatigue Model: (a)Spherical pressure vessel, (b)
Vertical displacement-time plot oftheEl Centro earthquake . . . 363
3.191 Low Cycle Fatigue Model: (a)Damage accumulation
(El Centro earthquake), (b)Temporal evolution ofthe
maximalvoid volume fraction f 364
4.1 Overviewofthemethodologicalimplementation of lifetime
oriented design concepts 366
4.2 Numerical modelingandgeneral multiphysics problem 375
4.3 Modelingand numerical analysis ofmultiphysics problems 376
4.4 Illustration of isotropic Lagrange shap e functions 381
4.5 Illustration ofanisotropic Lagrange shape functions 382
4.6 Computation ofgeneralized elementtensors ofmultiphysics
p-finite elements 387
4.7 Sinusoidialloading ofatrussmemberandrel. error of
internal energy plotted over the number ofdof 388
4.8 Modified Legendre-polynomials 390
4.9 Comparison ofhigh order shape function concepts 391
4.10 Comparison of the structure ofelement vectors andmatrices
fortheLegendre- and Lagrange-concept 392
4.11 3D-p-element: definition and numbering ofelement vertices
(N
i
), edges (E
i
) and faces (F
i
) 393
4.12 3D-p-shape functions:nodal, edge, face and internal modes
fordifferentpolynomial degrees 395
4.13 Structure types, corresponding classical finite elementmodels
and 3D-p finite elementmodels with spatially anisotropic
approximations 396
4.14 Hygro-thermo-mechanicalloading of a structural segment,
Fieldwise anisotropicdiscretization usingthep-FEM 398
4.15 Discretization ofthestandard structures (truss, slab, shell)
into aninfinite numbers ofelements 399
4.16 Relative reduction ofsystem nodes/doffordifferent
structures 402
4.17 Strategy forsolving non-linear vectorequation r
i
(u)=r 404
4.18Control of load factorand Newton-Raphson iteration 404
4.19 Algorithmic set-up oftheload controlled Newton-Raphson
scheme 4 06
4.20Illustration ofarc-length methods andpredictorstep
calculation 407
4.21Algorithmic set-up ofthearc-length controlled
Newton-Raphson scheme 410
List of Figures XXXVII
4.22 Designof Newmark type time integration schemes 413
4.23Illustration of Newmark andgeneralized mid-point
approximations 414
4.24 Algorithmic set-up of Newmark-α schemes includingerror
controlled adaptivetime stepping 417
4.25 Galerkin time int
egration sc
hemes 418
4.26Algorithmic set-up ofdiscontinuous andcontinuous
Galerkin time integration schemes 423
4.27 Modular concept formultiphysics finite elementprograms 425
4.28 Examplegeometry and warping-based errorcriteri
on 432
4.29Tw
o-elementexample with t wo hanging nodes 434
4.30 Beam 1: Geometry andboundary conditions 435
4.31 Beam 1: Load-displacementcurvefor tolerr =10
−5
and crit1
(various nGP) 435
4.32 Beam 1: Different states ofmeshrefinement (Q1SPs/o, 16El.),
contours: accumulated plasticstrain 436
4.33 Beam 1: Load-displacementcurveand number ofelements
for tolerr =10
−7
and crit1 (various nGP0) 437
4.34 Beam 1: Load-displacementcurveand number ofelements
fordifferenttolerances and crit2 (Q1SPs/o, nGP0 =16) 438
4.35 Beam 2:Load-displacementcurveand number ofelements
fordifferenttolerances and crit2 (Q1
SPs/o, nGP =
16) 438
4.36 Beam 2 :Different states ofmeshrefinement (Q1SPs/o,
16 El.), contours: accumulated plasticstrain 439
4.37 Plate 1: Geometry andboundary conditions 440
4.38 Plate 1: Load-displacementcurveand number ofelements for
differenttolerances and crit2 (Q1SPs, nG
P = 8) 440
4.39 Plate 1: Load-displacementcurvefordifferenttolerances and
crit2 (Q1SPs, nGP = 8) 441
4.40Plate 1: Different states of mesh r efi nement (Q1SPs/o,
16 El.), contours: accumulated plasticstrain 441
4.41Plate 1:
Load-displacementc
urveand number ofelements
fordifferent load steps and crit2 (Q1SPs/o, nGP = 8,
tolerr =0.01) 442
4.42 Plate 1: Load-displacementcurveand number ofelements
fordifferent load steps and crit2 (Q1SPs, nGP = 8,
tolerr =0.0001) . . . . . . . . . . . . . . . . . . . . . . . . . . . . . . . . . . . . . . . . . . 442
4.43I
llustratio
n of h- and p-methoderrorestimates and
indicators 443
4.44 Algorithmic set-up fortheerrorcontrolled adaptivetime
integration by Newmark-α schemes 447
4.45Algorithmic set-up fortheerrorcontrolled adaptivetime
integration byNe wmark-α or p-Gale
rkin methods
and
h-methoderrorestimates/indicators 447
XXXVIII List of Figures
4.46Algorithmic set-up fortheerrorcontrolled adaptivetime
integration by p-Galerkin methods and p-methoderror
estimates/indicators 448
4.47 Function to be approximated 450
4.48 Approximation ofequation (4.147) 451
4.49Normal andtangentialvector 452
4.50 Four crack tipfunctions 453
4.51 Crack with onekink 454
4.52 Crack after mapping 456
4.53 Multiplekinked crack 456
4.54 Multiplekinked crack after the first mapping 457
4.55 Point x andmirrored point
ˆ
x 458
4.56 Strain ε fromequation (4.173) fortheintegral(4.175) 462
4.57 Number of integration points used in the numerical
integration of (4.174) 462
4.58 Strain ε fromequation (4.17 3) fortheintegral(4.177) 463
4.59 Number of integration points used in the numerical
integration of (4.176) 463
4.60 Strain ε fromequation (4.173) fortheintegral(4.17 9) 465
4.61 Number of integration points used in the numerical
integration of (4.178) 465
4.62 Strain ε fromequation (4.17 3) fortheintegral(4.181) 466
4.63 Number of integration points used in the numerical
integration of (4.180) 466
4.64 Strain ε fromequation (4.17 3) fortheintegral(4.183) 467
4.65 Number of integration points used in the numerical
integration of (4.182) 467
4.66 Strain ε fromequation (4.173) fortheintegral(4.185) 468
4.67 Number of integration points used in the numerical
integration of (4.184) 468
4.68 Tension test configuration 469
4.69 Displacements u
x
for the deformed system usingbilinear
shape functions 470
4.70Displacements u
x
for the deformed system,left: using
bi-quadraticshapefunctions, right: using quadratic
hierarchical shape functions 470
4.71Differences ofdisplacements inside the 1st blendingelement 471
4.72 Differences ofdisplacements inside the 2ndblendingelement 471
4.73Differences ofdisplacements inside the 3rd blendingelement 472
4.74 Differences ofdisplacements inside the 4th blendingelement 472
4.75Differences ofdisplacements inside the 5th blendingelement 473
4.76Numericalintegration in the context of X-FEM: Subdivision
ofthecontinuum element into six sub-tetrahedrons 475
4.77 Separation ofasub-tetrahedron by aplane crack segment 475
4.78 C
0
-crack planeevolution 476
List of Figures XXXIX
4.79Definition ofthecrackplaneby point P and normalvector n 477
4.80 Constantstrain triangular elementcutby means ofaplanar
internal boundary ∂
s
Ω; see [745] 481
4.81 Enhanced discontinuous displacementfield ru (H
s
− ϕ): (a)
bi-linear approximation (2 nodes in Ω
+
); (b) bi-quadratic
approximation (1 node in Ω
+
) 482
4.82 Numerical studyofanotched concrete beam: dimensions (in
[cm]) andmaterial parameters 486
4.83Numerical studyofanotched concrete beam usingthe
proposed multiplecrackconcept andtherotatingcrack
approach 488
4.84 Sketch forthecomputation oftheSIF forakinkingcrack
with r → 0 491
4.85Schematicfigureforthecalculation oftheSIF with constant
radius forkinkingcracks 491
4.86Sketch of K
II
(left) and |K
II
| (right) depending on the angle
θ forathreepointbendingtest 492
4.87 Energy function Π
tot
forathreepointbendingtest 4 93
4.88 Crack simulation ofadouble notched slab:System, material
data andfinite elementmesh 494
4.89 Crack simulation ofadouble notched slab:Visua lization of
the crack topology by the φ =0-level set 495
4.90 Crack simulation ofadouble notched slab: Comparison of
crack topology and of load-displacementcurves 495
4.91 Bumericalinvestigation ofcrackpropagation ofan anchor
pull-out test:System andfinite element mesh (NE = 996) . . . . 496
4.92 Numericalinvestigation ofcrackpropagation ofan anchor
pull-out test: Crack topolog y anddisplacement u
3
in pull-out
direction 497
4.93 Numericalinvestigation ofcrackpropagation ofan anchor
pull-out test:Stress σ
33
at the beginningandtheend ofthe
crack process 497
4.94 Numericalinvestigation ofcrackpropagation ofan anchor
pull-out test:Load-displacementcurve 498
4.95 Concept fortheefficientsimulation ofdynamic, partially
damaged structures 501
4.96 Decomposition of the structure 507
4.97Geometry and loading 513
4.98Exploded viewof the bridge 514
4.99 Damage evolution in the largest two hangers 515
4.100 Displacement in X
2
-direction in point B 516
4.101 Mean relativedisplacement-based error in point B 516
4.102Comparison of a pure implicitandan explicitcalculation of
accumulation 518
XL List of Figures
4.103 General definition ofthefailure domain depending on
scatteringresistance (R) a ndstress(S) values 529
4.104 Standardization ofan exemplary 2Djointdistribution
function for a subsequent FORM/SORM analysis 532
4.105 Comparison of Latin
Hypercube Sam
plingand Monte-Carlo
Simulation 536
4.106 Parallel execution ofstochastically independent DC-MCSof
fatigue analyses on adistributed memory architecture [824] 545
4.107 Parallel software framework 561
4.108Experimental setup 562
4.109 Damage equipment
563
4.110 Singular values 564
4.111 1’st eigenfrequency andmode shape 564
4.1122’ndeigenfrequency andmode shape 565
4.113 3’rd eigenfrequency andmode shape 565
4.1144’th eigenfrequency andmode shape 566
4.115 Cut modelling 566
4.116 Optimization topol
ogy
570
4.117 The new3-series convertible 573
4.118 3-series convertible with battery 574
4.119 Battery as vibration absorber 574
4.120FEmodelof the shaker test arrangement 575
4.121Measured acceleration data forthey-dir ection 576
4.122 Power spectral density function
of t
he resulting von Mises
stress fortheelements of Figure 4.119, load direction y 577
4.123 Dirlik distribution function of the stress amplitudes 579
4.124 Typical stress picture for load in y-direction (Time History
Analysis) 581
4.125 Expected life time in arbitr
ary time
units fortheTime
History calculation (acceleration load in y-direction) 582
4.126Hygro-mechanically loaded concrete shell structure:System
geometry andmaterial data 584
4.127 Hygro-mechanically loaded concrete shell structure:Hygral
boundary conditions oft
heinner and outer
surface ofthe
shell 584
4.128 Hygro-mechanically loaded concrete s hell structure:Finite
elementmeshofthenumerical analysis 585
4.129Hygro-mechanically loaded concrete shell structure:
Deformation and stresses due to dead load 586
4.130 Hygro-mechanically loaded concrete shell structure:
Distribution oft
hesaturation S
l
587
4.131 Hygro-mechanically loaded concrete shell structure:Damage
evolution at the support area 588
4.132 Hygro-mechanically loaded concrete shell structure:Damage
zoneand accelerated transport process in the area ofcracks 588
List of Figures XLI
4.133 Hygro-mechanically loaded concrete shell structure:
Distribution of saturation S
l
and damage variable d across
the shell thickness (I) 589
4.134 Hygro-mechanically loaded concrete shell structure:
Distribution of saturation S
l
and damage variable d across
the shell thickness (II) 590
4.135 Calcium leaching of a cementitious bar and a cementitious
beam: Geometry, FEmeshandchemicalloadinghistory 591
4.136 Calcium leaching of a cementitious bar:Numerical results
obtained fromthecG(1) method
593
4.137Calcium leaching of a cementitious bar:Numerical results
andtime integration error obtained from adaptive Newmark
integration 595
4.138Calcium leaching of a cementitious bar:Time histories
c(t, X
1
)/c
0
obtained fromdG(p)-integration (t [10
8
s],
X
1
[mm]) 596
4.139 Calcium leaching of a cementitious bar:Time histories
c(t, X
1
)/c
0
obtained fromcG(p)-integration (t [10
8
s],
X
1
[mm]) 597
4.140 Calcium leaching of a cementitious bar:Spatiallocal and
global errorestimates for Newmark time integrations 598
4.141 Calcium leaching of a cementitious bar:Logarithm oferror
estimates e
Δt/5
fordG-methods with differenttime steps Δt . . . 599
4.142 Calcium leaching of a cementitious bar:Logarithm oferror
estimates e
p/p+1
fordG-methods with differenttime steps Δt . . 600
4.143 Calcium leaching of a cementitious bar:Logarithm oferror
estimates e
p/p+1
and e
Δt/5
forcG-methods with different
time steps Δt 601
4.144 Calcium leaching of a cementitious bar:Average relative
errors oftheNewmark methodand Galerkin methods 603
4.145 Calcium leaching of a cementitious beam:Numerical results
obtained fromcG(1) 604
4.146 Calcium leac
hing of a
cementitious beam:Investigation of
the oscillations in the results ofcG(1)- andcG(2)-solutions . . . . 605
4.147 Calcium leaching of a cementitious beam:Investigation of
the robustness ofthecG(1)-solution forsmall T
c
606
4.148 Pictures of damaged road bridge in M¨unster (Germany) and
correspondent FEmodels 607
4.149 Refined FEmodels ofaconnectingplate andthe
correspondent welding 608
4.150 Effective stress values ofaconnectingplate under a constant
rodd
eflection 610
4.151 R
epresentativesurfaceofpartial damage values for varying
windand initial displacements at the critical tierod 611
XLII List of Figures
4.152 Time-dependentevolution of the failure probabilityofcritical
material points in the weldingregion and the bulkmaterial 612
4.153 Optimization model 613
4.154Optimization results 614
4.155 The road bridge at H¨unxe (Germany) shortly before its
deconst
ruction
in 2006 616
4.156 Location of prestressingtendonsand crack patternobserved
on the bridges main girders 617
4.157 Location ofdrillingcores 618
4.158Comparison of stress-strain curves between bridge concrete
and laboratory concretes with differentstrengths [193] . . . . . . . . 620
4.159 LM-micrograph of in-situ
concrete .
621
4.160 Totallongitudinal(left) andfatigue strain (right) at S
max
622
4.161 Correlation between fatigue strain andtheresidual stiffness
for S
max
/S
min
=0.675/0.10 623
4.162 Three dimensionalFinite Elementmodeloftheroad bridge
at H¨unxe 624
4.163 Applied corrosion model 626
4.164 Modified S-N curves forsteel andfatigue damage evolution
function 627
4.165 Higher order statistical moments 628
4.
166 Vali
dation of input data 628
4.167Evolution ofcompressivestrength andhistogram ofconcrete
strength 629
4.168Randomfielddependencyoncorrelation length and
eigenvalues used forreconstruction ofcorrelation matrix 632
4.169 Load deflection diagram andtime deflectio
n diagram 3D
633
4.170Load deflection curves and lifetime distribution and
estimation 633
4.171State space model 636
4.172 Impulse excitation in laboratory 639
4.173 Comparison between measured signalsandsignalsfrom
identified model
639
4.174 Cantil
ever bendingbeamusedforexperiments in laboratory 641
4.175Drawingfromthecantilever bendingbeamwith the location
ofsaw cut 641
4.176Markov parameters for damage detection 642
4.177 Bridge near H¨unxe / Germany (span: 62.5m) 643
4.178 Syst
em modificatio
n: hanger cut through 643
4.179Torsional mode from reference system and after cut hanger 644
4.180 Recalculation ofacentrifuge model test of Helmetal. [365] . . . 646
4.181Parametricstudies ofshallow stripfoundationsunder cyclic
loading 647
4.182 FEc
alculations with
stochastically fluctuating voidratio 648
List of Figures XLIII
4.183FEcalculation of vibratory compaction andbridge
settlements 649
4.184 Calculation ofpore water pressure accumulation due to
earthquake loading 650
4.185FEcalculation ofageogrid-reinforced embankment 651
4.186FEcalculation ofamonopilefoundatio
n ofanoffshore wind
power
plant 651
5.1 Reinforced concrete column under fatigue loading 654
5.2 Load-carrying-capacity a nd r esponse surface method 654
5.3 Time-dependent hazard function andtime-dependent
reliability 655
5.4 Multi-level system
approach
followed duringthelifetime
analysis ofthearchedsteel bridge [826] 656
5.5 Multi-scalemodelingandanalysis offatigue-related
structural problems 657
5.6 Comparison of resultingtime-dependentfailure probabilities
oftheresearchedconnection plate 658
List of Tables
2.1 Conversion ofthewinddataoftheobservation station at the
airport of Hannover into data for the building location 20
2.2 Determination of a reduced characteristicsuction force on
the fa¸cade elementafterFigure 2.8 24
2.3 Statistical parameters ofthetrafficrecords of Auxerre (1986) . . 49
2.4Relation between gross weight of the heavy vehicles andthe
axle weights ofthelorries oftypes 1 to 4 in % (meanvalues
andstandard deviation) 50
2.5 Distance ofaxles in [m]ofthedifferenttypes of vehicles
(meanvalues andstandard deviation) 50
2.6 Statistical parameters ofthecorrected statictrafficrecords
of Auxerre (1986) 53
2.7 Differentcross-sectionsandtraffictypes fortherandom
generations 55
2.8 Trafficdataofdifferent locationsandcharacteristic values of
gross andaxle weight [720] 60
2.9 Differentdesign situationsandcorrespondingreturn periods
andfractiles 60
2.10 Factors Ψ for the determination of the representative values
forserviceabilitylimitstatesacc. to[9] 63
2.11 Trafficcategories acc. to Eurocode 1-2 66
2.12 Statistical parameters ofthetrafficrecords at highwayA61
(2004) 75
2.13 Relation between gross weight of the heavy vehicles andthe
axle weights ofthelorries oftypes 1 to5(meanvalues) 76
2.14Readings:winter 05/06 and winter 06/07; fieldstation
Meißen 102
3.1 Classification ofpore sizes in concrete accordingto[724] 151
3.2 Influences on the degree ofchemical attack 152
3.3 Changes ofconcrete properties due to cyclic loading 185
XLVI List of Tables
3.4 Crack characteristics at certain number ofcycles
S
max
/S
min
=0.675/0.10 191
3.5 Correlation between frost suction and internal damage due
to freeze-thaw testing 197
3.6 Summaryofthesingle level tests 213
3.7 Summaryof the tests with multipleblocks of loading 214
3.8 Meanvalues ofmaterial properties ofconcrete accordingto
EN 206-1 [12] 218
3.9 Meanvalues ofmaterial properties ofsteel members 219
3.10 Average test results per stud 219
3.11 Loading parameters and results ofthetestswith two blocks
of loading (series S5) 222
3.12 Loading parameters and results ofthetestswith four blocks
of loading (series S6) 222
3.13 Average test results per stud in series S9 223
3.14 Measured meanvalues ofthepeakload andtheload range
at discrete number of load cycles in tests S9
4 223
3.15 Loading parameters andblock lengths in tests S9
5 224
3.16 Average test results per stud in series S11 and S13 225
3.17 Meanvalues ofmaterial properties ofconcrete accordingto
EN 206-1 [12] 231
3.18 Meanvalues ofmaterial properties ofsteel members 232
3.19 Main test results ofbeamsVT1 and VT2 233
3.20Parameter oftheelasto-plasticmicropore damage model for
20MnMoNi55 260
3.21LowCycle Fatigue in metals:Number of load cycles until
failure obtained 261
3.22 Characteristics oftheapplied sequentialloading 281
3.23Summaryofthefunctions, material constants andreference
quantities ofthehigh-cyclemodel 314
3.24 Summaryofthestatically loaded push-out tests with decisive
criterion “failure oftheconcrete”(tests 1-27) 319
3.25Summaryofthestatically loaded push-out tests with decisive
criterion “failure oftheconcrete”(tests 28 -58) 320
3.26Summaryofthestatically loaded push-out tests with decisive
criterion “shear failure of the stud” 321
3.27 Result ofthestatistical a nalysisaccordingEN 1990, Annex
D[16] 323
3.28 Meanvalues ofthecracklength a
h
(see Figure 3.155) in test
series S11 and S13 337
4.1 Multi-dimensional Lagrange shap e functions 382
4.2 Totalnumber ofgeometricentities (vertices, edges, faces)of
the discretizations with aninfinite number ofelements 399
4.3 Convergence criteria of iterativesolution methods 405
List of Tables XLVII
4.4Comparison of iteration methods 406
4.5 Constraints and load factor increments ofselected arc-length
methods 409
4.6 Error indicators for Newmark type time integration schemes
for non-linear s ec ond order initialvalue problems 445
4.7Error indicators
for New
mark type time integration schemes
for non-linear fir s t order initialvalue problems 446
4.8Equivalent square sections 514
4.9 ModalAssurance Criterion 569
4.10 Gauss-Newton (c
p
/c
d
=800/1smm) 571
4.11 Gauss-Newton iteration (c
p
/c
d
=1400/1mm) 571
4.12Results foran early design proposal 582
4.13 Standard parameter set [307, 454, 457] 592
4.14Calcium leaching of a cementitious bar:Average relative
errors oftheNewmark method, discontinuous Galerkin
methods andcontinuous Gale
rkin methods
602
4.15 Type ofrandom variables (RV) included in the reliability
problem used to describe the scatter of wind load parameters
as well as material properties 609
4.16 Comparison of resultingruntime values analyzingthe
connectingplate 615
4.17 Dynamicelas
ticmoduli E
dyn
(mean) andtheirstandard
deviations (SD) oftheconcrete after a service life of 50
years 619
4.18Relevantmechanical concrete properties E
stat
,
u
and f
c
(meanvalues) as well as theirstandard deviations (SD) after
aservice life of 50 years 619
4.19 Number ofelements of structural members 624
4.20Determination ofcompressivestrength at time of
construction 629
4.21 Concrete strength grades accordingto German standards 630
4.22 Summaryof the results oft
heFEcalculatio
ns ofstrip
foundationsunder cyclic loading 647
1
Lifetime-Oriented Design Concepts
Authored by Friedhelm Stangenberg
1.1 Lifetime-Related Structural Damage Evolution
Authored by Friedhelm Stangenberg
Structures deteriorate during their lifetimes, e.g. their original quality de-
creases. In terms of structural safety, this reduces the original safety margin,
a process, which also can be described as an increase of structural damage.
If, in such deterioration, the safety parameter decreases below the admissible
safety limit, or the structural damage parameter increases beyond the admis-
sible damage limit, then the structural service life will be terminated. If the
failure safety value or the structural damage parameter both reach unity, the
structure (theoretically) will fail.
The initial structural properties must have sufficient reserves, in order to
compensate future reductions of safety against failure and of safety against
reaching the limits of serviceability. The final structural properties, at the end
of the service life or at the end of the relevant inspection interval, respectively,
must include a minimum resistance safety, a minimum serviceability level, and
other minimum qualities.
Lifetime-related deteriorations can happen in various forms and can con-
sist of various components. For example for structural concrete, the lifetime-
related aspects with influence on the long time structural behavior are listed
in Figure 1.1.
Deteriorations therein can be induced mechanically, e.g. by load cycles lead-
ing to fatigue effects. They can also be induced non-mechanically, e.g. by
corrosion or other chemical processes.
In combination, deterioration effects can be superimposed by addition, if
there is no interaction between them. In case of interactions, the superposition
can be more than additive because of amplification effects due to influences
2 1 Lifetime-Oriented Design Concepts
Durability
Integrated from outside into SFB 398
models and concepts
Resistance
against
abrasion
Chemical durability
against s ubstances
penetrating from
outside
particularly:
corrosion protection
of reinforcing steel
in concrete:
• carbonation
• penetration of
chlorides
• further
deteriorations
Resistance against
fatigue (cyclic loading)
Resistance against frost
(-thaw cycles)
Simulations fo r combined mechanical and chemical
processes and propagations
Own basic SFB 398 research
Integrated design concepts
Appropriate Quality Assurance for structural design, detailing and execution
QA is a very important overhead
necessity, also for lifetime-oriented
design concepts, in order to eliminate
big mistakes a nd big errors a priori,
as well as to make sure that certain
tolerable deviations of structural
qualities are not exceeded.
This is a fundamental requirement
for service-life control.
Fig. 1.1. Lifetime-related aspects of structural concrete
between each other. E.g. the longtime increase of concrete crack widths leads
to increased penetration of chemically aggressive media, through the cracks
damage phenomena
superimposed
mechanically
induced
degradation
without
interactions
non-mechanically
induced
degradation, e.g.
co rrosion
interactions
included
d
1
d
1
d
1
d
2
d
2
d
2
interaction
d
d
d
d
T
T
T
T
T
i
T
i
T
i
T
i
T
e
T
e
T
e
T
e
T
i
: intermediate time
T
e
: end of observation time
Fig. 1.2. Evolution of degradation
1.2 Time-Dependent Reliability of Ageing Structures 3
into the structure, causing increased chemical deteriorations, e.g. increased
corrosion in the reinforcing steel. On the other hand, this leads to increased
steel weakening and, thus, vice-versa to a higher amplification of concrete
crack widths, and so on.
Therefore, combinations of interactive effects can lead to additional deteri-
orations, which would be underestimated by additive superposition only. This
is illustrated, in principle, in Figure 1.2.
1.2 Time-Dependent Reliability of Ageing Structures
and Methodological Requirements
Authored by Friedhelm Stangenberg
In the beginning of the structural lifetime, the safety against failure and
against losses of other important structural qualities must have sufficient re-
serves. In the early lifetime, maybe e.g. concrete post-hardening may improve
the safety situation for a while, but later on, deteriorations lead to safety
reductions. At the end of the planned service period, a remaining minimum
safety is still required.
This time variant safety problem or reliability problem, respectively, is pre-
sented in Figure 1.3, in principle, where the time histories of resistances and ac-
tions, together with their statistical distributions, are plotted in relation to each
other. Degradationsof the resistances and maybe certain increases of the actions
effect time-dependent safety losses. For analytical predictions of these develop-
ments, methods for time-dependent stochastic calculations are needed.
R, S
R(t
1
)
R(t
d
)
S(t
1
)
S(t
d
)
Safety margin
(fractile-based)
t
1
t
d
= planned
service
p
eriod
mean lifetime
(
50%
p
robabilit
y)
time
t
actions S
resistance R
Fig. 1.3. Time-dependent reliability of structures
4 1 Lifetime-Oriented Design Concepts
R, S
time t
resistance R
actions S
R(t
1
)
R(t
d
)
¯
R(t
1
)
safety margin
(fractile-based)
S(t
1
)
S(t
d
)
upgrading by
repairs
t
1
t
d
= planned
service period
Fig. 1.4. Time-dependent reliability of structures with upgrading by repairs
In Figure 1.4, two alternatives of service-life control are compared. The
planned service period t
d
can be obtained, by starting on a high level of struc-
tural reserves R(t
1
), high enough to reach t
d
, with enough remaining safety,
and without repairs during the full service life. The other alternative is: to
start at a lower level of initially invested reserves
¯
R(t
1
), but to upgrade by re-
pairs, i.e. by additional investments, before t
d
, before the minimum acceptable
safety is undergone. The success at time t
d
may be the same for both alterna-
tives. The second alternative means initial savings, but additional investments
later, maybe combined with temporary restrictions or losses of use during the
repairs. It depends on the special conditions, what alternative should have
preference.
1.3 Idea of Working-Life Related Building Classes
Authored by Friedhelm Stangenberg
Current design standards do not provide a satisfactory basis or procedure to
ensure expected structural lifetimes. These may vary from only a few years—
for temporary structures—to more than a century for tunnels, dams of water
reservoirs, or nuclear repositories. There is an urgent demand for handling
this wide spectrum of lifetimes, in structural design and maintenance.
An appropriate differentiation of the design service lives of different building
classes is necessary. A proposal for such a differentiation of expected working
lives is given in Figure 1.5.
1.4 Economic and Further Aspects of Service-Life Control 5
expected working life
[y ears]
≥
150
≥ 80
≥ 60
30–40
≈ 10
dams of water
reservoirs
residential and
buisness buildings
bridges
temporary buildings
industrial buildings
Fig. 1.5. Working-life related building classes
1.4 Economic and Further Aspects of Service-Life
Control
Authored by Friedhelm Stangenberg
Service-life control is successful, if all initial and later investment costs
are minimized, and if all aspects of sustainability are respected, from the
beginning of the construction, over all the lifetime with perhaps intervals of
repair, including final removal or perhaps recycling, revitalization etc.
Lifetime-oriented strategies aim at successful investment economy com-
bined with sustainability.
Building investment costs comprise
• costs of initial construction,
• maybe costs of periodic inspection, of maintenance and strengthening,
• costs consequent to temporary losses or restrictions of use (in cases of
interruptions for maintenance),
• costs of financing for the initial construction and, in case, for later main-
tenance and repair.
6 1 Lifetime-Oriented Design Concepts
P
costs constant
designed for no maintenance
s
ervice life
(without maintenance measures)
P
costs
savings at the b eginnig
inspections and maintenance
(
eventually temporar y loss of use
)
Fig. 1.6. Service Life control and economic aspects
Life Cycle Assessment
of Structures via
Innovative Monitoring
Materials and Structures in
Revitalization of Buildings
Fig. 1.7. Related Collaborative Research Centers
Aspects of sustainability comprise
• saving of natural resources, e.g. by economizing raw materials, energy etc.,
• prevention of future negative consequences and remains as well as
• harmony with nature and human life qualities, now and in future.
For the partial aspects of economic service-life control see the Figure 1.6.
Service-life control with high probability of success, in future will also bring
up new ideas in the field of warranty.
Duration time of warranty for structural qualities is different in diverse
countries (according to warranty laws in European countries: 5 or 10 years or
other). New law aspects will perhaps follow in new design concepts making
a successful service life more reliable. Duration time of warranty according
to law should be in correlation with the degree of realizability of structural
1.5 Fundamentals of Lifetime-Oriented Design 7
lifetimes. The progress in lifetime-oriented design concepts can contribute to
an international harmonization of warranty law.
1.5 Fundamentals of Lifetime-Oriented Design
Authored by Friedhelm Stangenberg
Current structural design concepts are oriented towards serviceability as
well as towards safety against failure. They are based on structural virgin
states, largely excluding pre-damage as well as later damage accumulation.
Design standards use limit state formats in terms of load scenarios, material
behavior, and required (partial) safeties. With respect to service-life control,
such formats should include quantified damage predictions and assumptions
for future tendencies of relevant action scenarios.
Such anticipations are necessary for realistic simulations of future lifetime
influences. Thus, expected or monitored structural safety and serviceability
evolutions can be described properly.
Such concepts are created presently and named life-cycle design. Methods
for describing damage evolutions, resistance alterations, increases of actions
etc. are needed as well as simulations techniques and methods for the esti-
mation of the reliability of structures with respect to these phenomena. This
book provides contributions to these topics, which form the basis for lifetime-
oriented design.
2
Damage-Oriented Actions and Environmental
Impact on Materials and Structures
Authored by R¨udiger H¨offer
Mechanical loading and ambient actions on civil engineering structures and
components cause lifetime-related deteriorations. Not the rare extreme load-
ing events are in the first place responsible for the evolution of structural
degradation but the ensemble of load effects during the life-time of the struc-
ture. It is of major importance to have models at hand which adequately
reflect the experienced time histories of impacts, and which can include jus-
tified predictions of future trends. Leading types of loading and load-effects
with relation to mechanical fatigue as well as damages due to hygro-thermal
and chemical impacts are considered in this chapter. Selected contributions
from wind and temperature effects with certain meteorological characteristics
as well as from traffic loads on roads and railway lines are modeled as typical
examples of contributions to mechanically induced degradations of structures.
A specific aspect is the permanent settlement of soil due to high-cyclic, long-
term loading, for which novel representations are developed. The attack of
freeze-thaw circles in different environments and of chemical impacts leading
to solving, swelling and leaching processes in concrete including principle in-
teractions are discussed as examples for the main types of non-mechanically
induced degradations.
2.1 Wind Actions
Authored by R¨udiger H¨offer
Wind-induced cyclic motions of structures can generate deterioration of
constructions and materials. It is therefore required to check the exposure of
structures and structural components regarding the probability and accumu-
lation of such damages. Cyclic responses due to wind buffeting as one of the
aerodynamic loading mechanisms are evaluated based on the concept of gust
response factors. In general gust-response factors relate equivalent static loads
10 2 Damage-Oriented Actions and Environmental Impact
0
4
8
12
-4
-8
-12
-16
20 40
60 80
20 40
60 80
20 40
60 80
0.001
0.002
a[m]
4.0
2.0
0
-2.0
W [kN]
a[m]
f=3.56 Hz
f=0.18 Hz
t[s]
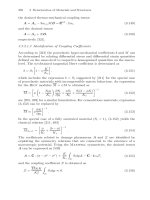
(a) (b) (c)
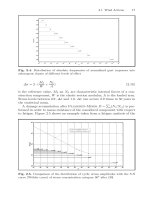
Fig. 2.1. Typical wind load process (a), and related low frequency (b) and high
frequency (c) response of a structure [572]
to maximal dynamic effects. In the presented approach frequently repeated
gust effects of lower levels than the extreme effect with a return period of 50
years are modeled using the statistical distributions of ensembles of registered
wind speeds. The influence of the wind direction on a structural failure proba-
bility is included via advanced directional factors. Resonant vortex excitation
of slender cylindrical structures is a classical aerodynamic interaction mech-
anism which can cause high-cyclic responses with large amplitudes. A time
domain model is applied and validated using data from wind tunnel investiga-
tions and from an experiment in full scale. A novel representation in the micro
and the macro time domain is developed. The succession of damage events is
modeled through the adaption of renewal processes and pulse processes.
2.1.1 Wind Buffeting with Relation to Fatigue
Authored by R¨udiger H¨offer
Buffeting loading on structures consist of mean and fluctuating compo-
nents. The mean wind load is the static load component, which is related to
the mean wind speed in a deterministic manner. The second, fluctuating load
component is primarily due to wind gustiness. Both parts are required for the
evaluation of aerodynamic forces. The time histories of forces are derived from
a superposition of the effect of wind buffeting and of body-induced turbulence,
from vortex forces and from aeroelastic interaction forces (s. e.g. [200]). The
forces vary randomly in space and time. Time domain or frequency domain
methods are available to calculate the stochastic response. However, they are
cumbersome in view of the input data required and the computer time needed.
For practical design it is sufficient to apply equivalent static gust wind loads.
2.1 Wind Actions 11
They are based on the so-called gust response factor G that incorporates the
most adverse gust effect on a structural response, which dominates in the
design, the so-called leading response.
Aeroelastic oscillations, such as galloping or flutter, are usually not ob-
ject of a fatigue analysis as the associated, often continuously growing oscil-
lation amplitudes can lead rapidly to a structural failure from an overload
breakage. Structures which are prone to such type of excitations are dynami-
cally detuned, damping devices or other dissipative mechanism are arranged.
An important exception is the structural oscillation due to vortex resonance
which - depending on the damping ration - can generate resonant amplitudes
of different levels and also the lock-in phenomenon due to synchronized vortex
seperations (s. e.g. [740]). Such fatigue behaviour must always be analysed.
Often scruton coils against regular vortex separations are installed.
In contrast, gust-induced oscillations of structures are unavoidable if the
structure exhibits eigenfrequencies in the limits of up to ca. 2 Hz, Fig. 2.1 (b).
The reason is that higher energy levels below 2 Hz are introduced into the
flexible structure and are amplified due to the resonant behavior of the struc-
ture [571]. Above 2 Hz wind-induced oscillations are often marginal because
the spectral energy of wind turbulence is minor. Here, the excitation process
is not amplified but uniformly transferred into structural responses. However,
in such case the structure follows the wind gusts quasi-statically, Fig. 2.1 (a),
which alone by itself acts as a fatigue loading, Fig. 2.1 (c).
2.1.1.1 Gust Response Factor
Authored by R¨udiger H¨offer and Norbert H¨olscher
The gust response factor G is the magnification of the static, mean reac-
tion Y
m
of a structure to the fluctuations of the wind load. Stresses, internal
forces, and displacements are the responses of interest for which a specific gust
response factor is evaluated. The factor is applied to generate an equivalent
static force F
E
which refers to the maximal dynamical effect. The maximal
effect Y
P
is composed from the mean response Y
m
, which is defined as the
mean value of responses in a time window of 10 minutes, and the standard
deviation of the reaction σ
Y
with the peak factor g as a weight.
Y
p
= Y
m
± g ·σ
Y
(2.1)
The total standard deviation of response σ
Y
results from quasi-static variance
σ
2
YQ
and resonant contributions σ
2
YR
which can originate from one or more res-
onant contributions (Figure 2.2). The assumed maximum reaction is given by
Y
p
= Y
m
± g ·
σ
2
YQ
+ σ
2
YR
= Y
m
·
1+g ·
σ
YQ
Y
m
·
1+
σ
2
YR
σ
2
YQ
= Y
m
· G
(2.2)