Lifetime-Oriented Structural Design Concepts- P13 pps
Bạn đang xem bản rút gọn của tài liệu. Xem và tải ngay bản đầy đủ của tài liệu tại đây (1.31 MB, 30 trang )
318 3 Deterioration of Materials and Structures
intended to use the secant modulus of elasticity. On this background the sta-
tistical analysis of [684] was repeated when specifying the national parameters
of the German Annex of Eurocode 4 [34]. In this analysis additionally the new
results of the static tests of series S1 - S6 and the results of larger headed studs
with a diameter of 25 mm [343] were considered taking into account the re-
vised secant modulus of elasticity E
cm
according to the edited version of DIN
1045 [25]. In total 101 push-out tests could be included, which are summarized
for the different failure modes in Table 3.24, Table 3.25 and Table 3.26. In
these tables n means the number of studs per test specimen and h/d the ratio
of the height of each stud (after welding) to its shank diameter. In 58 cases the
criterion ”failure of the concrete” and in 43 cases the criterion ”shear failure
of the stud” was relevant. Further information regarding specimen geometry
and determination of the material properties are given in [345].
The result of the reanalysis according to EN 1990 [16] are shown in Table
3.27 and Figure 3.149. In accordance with the background report [684] the
following coefficients of variation V
x
were chosen.
• V
x
= 3 % for the stud diameter d,
• V
x
= 20 % for the modulus of elasticity (secant modulus) E
cm
,
• V
x
= 15 % for the cylinder compressive strength f
cm
,
• V
x
= 5 % for the tensile strength of the headed stud f
u
.
In the case of relation of the equations of the theoretical model (P
t,c
and P
t,s
)
to the characteristic values (X
k
) of the cylinder compressive strength f
ck
and
the tensile strength of the headed studs f
uk
instead of each mean value (X
m
)
the required partial safety factors γ
R
shown in Table 3.27 can be reduced by the
correction factors Δk
c
and Δk
s
according equation 3.251. In the case of ”failure
of the concrete” Δk
c
lies between 0.84 and 0.94 for a compressive strength range
20 ≤f
ck
≤60 N/mm
2
,thusavalueofΔk
c
= 0.94 can be applied on the safe side.
In the case of ”shear failure of the stud” Δk can be assumed constant equal to
0.92 for tensile strengths f
uk
between 400 and 620 N/mm
2
.
Δk
c
=
P
t,c
(X
k
)
P
t,c
(X
m
)
Δk
s
=
P
t,s
(X
k
)
P
t,s
(X
m
)
(3.251)
Because of
γ
∗
R
= Δk
c
· γ
R
=0.94 · 1.318 = 1.239 (3.252)
( γ
R
according Table 3.27, column 3 )
and
γ
∗
R
= Δk
s
· γ
R
=0.92 · 1.198 = 1.102 (3.253)
( γ
R
according Table 3.27, column 4 )
the design value of the shear resistance of a headed stud in concrete slabs with
normal weight concrete as a short time static strength is given to:
3.3 Modelling 319
Table 3.24. Summary of the statically loaded push-out tests with decisive criterion
”failure of the concrete” (tests 1 - 27)
reference test no. P
e
n f
cm
E
cm
f
u
d h/d P
t,c
[-] [-] [-] [kN] [-] [N/mm²] [N/mm²] [N/mm²] [mm] [-] [kN]
SA1 1 88.5 8 28.2 25200 493 16 4.75 80.7
SA2 2 94.4 8 28.2 25200 493 16 4.75 80.7
SA3 3 90.3 8 28.2 25200 493 16 4.75 80.7
SB1 4 82.6 8 28.3 22300 493 16 4.75 76.1
SB2 5 76.7 8 28.3 22300 493 16 4.75 76.1
SB3 6 85.3 8 28.3 22300 493 16 4.75 76.1
A1 7 132.9 8 35.7 26300 499 19 4.00 130.8
A2 8 147.4 8 35.7 26300 499 19 4.00 130.8
A3 9 138.8 8 35.7 26300 499 19 4.00 130.8
LA1 10 111.1 8 25.6 24700 499 19 4.00 107.4
LA2 11 120.2 8 25.6 24700 499 19 4.00 107.4
LA3 12 112.0 8 25.6 24700 499 19 4.00 107.4
B1 13 124.3 8 33.6 22400 499 19 4.00 117.1
B2 14 115.2 8 33.6 22400 499 19 4.00 117.1
B3 15 115.2 8 33.6 22400 499 19 4.00 117.1
LB1 16 83.0 8 18.8 15400 499 19 4.00 72.6
LB2 17 82.1 8 18.8 15400 499 19 4.00 72.6
LB3 18 78.5 8 18.8 15400 499 19 4.00 72.6
2B1 19 118.4 8 33.6 22400 499 19 4.00 117.1
2B2 20 115.7 8 33.6 22400 499 19 4.00 117.1
2B3 21 113.4 8 33.6 22400 499 19 4.00 117.1
RSs1 22 135.0 2 27.0 24549 620 19 5.26 109.9
RSs2 23 133.0 2 27.0 24549 620 19 5.26 109.9
RSs3 24 122.0 2 21.8 22546 620 19 5.26 94.7
RSs4 25 131.0 2 21.8 22546 620 19 5.26 94.7
RSs5 26 133.0 2 25.5 23990 620 19 5.26 105.6
RSs6 27 142.0 2 25.5 23990 620 19 5.26 105.6
[601]
[590]
P
Rd
=
0.721
1.239
0.374 d
2
α
E
cm
f
ck
=0.218 d
2
α
E
cm
f
ck
(3.254)
≤
0.811
1.239
1.000 π
d
2
4
f
uk
=0.736 π
d
2
4
f
uk
(3.255)
Due to short time relaxation effects in static tests under displacement control
with structural composite members of steel and concrete a partly significant
320 3 Deterioration of Materials and Structures
Table 3.25. Summary of the statically loaded push-out tests with decisive criterion
”failure of the concrete” (tests 28 - 58)
reference test no. P
e
n f
cm
E
cm
f
u
d h/d P
t,c
[-] [-] [-] [kN] [-] [N/mm²] [N/mm²] [N/mm²] [mm] [-] [kN]
S3 28 96.2 4 29.0 25273 600 19 5.33 115.6
S4 29 100.1 4 28.3 25022 600 19 5.33 113.6
S5 30 106.7 4 27.7 24805 600 19 5.33 111.9
S6 31 126.2 4 29.1 25309 600 19 5.33 115.9
S8 32 121.4 4 30.7 25873 600 19 5.33 120.3
S11 33 112.7 4 29.6 25486 600 19 5.33 117.3
S16 34 115.0 4 31.3 26081 600 19 5.33 122.0
S19 35 115.0 4 32.0 26322 600 19 5.33 123.9
S22 36 106.9 4 34.7 27233 600 19 5.33 131.2
S26 37 99.1 4 24.9 23763 600 19 5.33 103.9
S29 38 104.1 4 27.1 24586 600 19 5.33 110.2
P1 39 97.5 4 16.6 20302 600 19 5.33 78.4
P2 40 96.5 4 16.6 20302 600 19 5.33 78.4
P3 41 97.0 4 16.6 20302 600 19 5.33 78.4
P4 42 127.0 4 40.8 29196 600 19 5.33 147.4
P5 43 127.0 4 40.8 29196 600 19 5.33 147.4
P6 44 127.0 4 40.8 29196 600 19 5.33 147.4
D1/1 45 99.0 4 30.2 25698 580 16 6.25 84.3
D1/2 46 94.0 4 30.2 25698 580 16 6.25 84.3
D2/1 47 123.0 4 30.2 25698 500 19 5.26 118.9
D2/2 48 128.8 4 30.2 25698 500 19 5.26 118.9
D2/3 49 126.5 4 30.2 25698 500 19 5.26 118.9
D3/1 50 148.5 4 30.2 25698 548 22 4.54 159.5
D3/2 51 148.0 4 30.2 25698 548 22 4.54 159.5
D3/3 52 146.8 4 30.2 25698 548 22 4.54 159.5
2A 53 141.0 4 40.3 29040 485 19 3.68 136.7
I/1 54 179.5 8 23.7 29445 468 25 5.00 195.3
I/2 55 183.0 8 23.7 29445 468 25 5.00 195.3
I/3 56 180.4 8 23.7 29445 468 25 5.00 195.3
I/4 57 183.1 8 23.7 29445 468 25 5.00 195.3
I/5 58 178.6 8 23.7 29445 468 25 5.00 195.3
[513]
[528]
[862]
[371]
[343]
loss of load bearing capacity can be observed, when the actuator is held in
constant position. In push-out tests near ultimate load this loss amounts
approximately 10% [345], even if the tests are carried out with a very low
displacement rate as in the present cases. In order to allow for these effects
as a result of the test procedure the short time static strengths according
equation (3.254) and (3.255) have to be reduced by an additional reduction
factor in the order of 0.9. Thus on the basis a uniform partial safety factor γ
v
= 1.25 for both failure modes the design value of the shear resistance of a single
3.3 Modelling 321
Table 3.26. Summary of the statically loaded push-out tests with decisive criterion
”shear failure of the stud”
reference test no. P
e
n f
cm
E
cm
f
u
d h/d P
t,s
[-] [-] [-] [kN] [-] [N/mm²] [N/mm²] [N/mm²] [mm] [-] [kN]
T1/1 1 144.5 8 36.7 27890 460 19 5.26 130.4
T1/2 2 147.8 8 36.7 27890 460 19 5.26 130.4
T1/3 3 135.5 8 36.7 27890 460 19 5.26 130.4
T1/4 4 148.9 8 38.3 28405 460 19 5.26 130.4
T1/5 5 137.8 8 38.3 28405 460 19 5.26 130.4
T3/1 6 140.1 8 44.7 30397 460 19 5.26 130.4
T3/2 7 145.1 8 44.7 30397 460 19 5.26 130.4
T4/1 8 137.3 8 44.7 30397 460 19 5.26 130.4
T4/2 9 133.7 8 44.7 30397 460 19 5.26 130.4
T4/3 10 137.7 8 44.7 30397 460 19 5.26 130.4
T2/1 11 170.1 8 36.3 27759 471 22 4.50 179.0
T2/2 12 168.1 8 36.3 27759 471 22 4.50 179.0
T2/3 13 165.9 8 36.3 27759 471 22 4.50 179.0
T2/4 14 170.6 8 36.3 27759 471 22 4.50 179.0
T2/5 15 168.8 8 36.3 27759 471 22 4.50 179.0
T5/1 16 176.3 8 59.0 34546 471 22 4.50 179.0
T5/2 17 177.5 8 59.0 34546 471 22 4.50 179.0
T6/1 18 166.1 8 57.3 34069 471 22 4.50 179.0
T6/2 19 159.9 8 57.3 34069 471 22 4.50 179.0
T6/3 20 177.9 8 57.3 34069 471 22 4.50 179.0
3A 21 166.0 4 39.1 28661 485 19 5.26 137.5
4A 22 160.0 4 47.1 31119 485 19 5.26 137.5
5A 23 172.0 4 57.5 34126 485 19 5.26 137.5
II/1 24 233.0 8 41.3 34687 468 25 5.00 229.8
II/2 25 238.0 8 41.3 34687 468 25 5.00 229.8
II/3 26 234.9 8 41.3 34687 468 25 5.00 229.8
II/4 27 243.5 8 41.3 34687 468 25 5.00 229.8
II/5 28 232.8 8 41.3 34687 468 25 5.00 229.8
S1-1a 29 191.3 8 44.2 36400 528 22 5.68 200.7
S1-1b 30 211.3 8 49.0 36400 528 22 5.68 200.7
S1-1c 31 213.0 8 49.7 36400 528 22 5.68 200.7
S2-1a 32 201.3 8 44.7 33800 528 22 5.68 200.7
S2-1b 33 173.3 8 42.8 33800 528 22 5.68 200.7
S2-1c 34 175.3 8 42.8 33800 528 22 5.68 200.7
S3-1a 35 216.0 8 56.2 39000 528 22 5.68 200.7
S3-1b 36 200.6 8 53.9 39000 528 22 5.68 200.7
S3-1c 37 201.0 8 53.9 39000 528 22 5.68 200.7
S4-1a 38 186.8 8 43.4 33900 528 22 5.68 200.7
S4-1b 39 176.5 8 43.4 33900 528 22 5.68 200.7
S4-1c 40 179.1 8 43.4 33900 528 22 5.68 200.7
S5-1a 41 184.6 8 42.9 33050 528 22 5.68 200.7
S5-1b 42 186.8 8 42.9 33050 528 22 5.68 200.7
S6-1a 43 196.0 8 45.8 33700 528 22 5.68 200.7
[682]
[371]
[343]
[352]
stud connector considering time dependent effects due to high local
concrete pressure in front of the studs is finally given by the minimum of
equation (3.256) and (3.257).
322 3 Deterioration of Materials and Structures
P
e
[kN]
P
t,c
[kN]
250
200
150
100
50
50 100
150
200
250
P
t,s
[kN]
50 100
150
200
250
P
e
[kN]
250
200
150
100
50
0
S1-S6
200.7
0
0
0
P
t,c
P
Rk
P
Rd
P
t,s
P
Rk
P
Rd
V
R
= 0.19
V
R
= 0.12
cmcm
2
c,t
fEd374.0P
u
2
s,t
f
4
d
P
S
P
Rk
= 0.811 P
t,s
P
Rd
= 0.678 P
t,s
P
Rk
= 0.721 P
t,c
P
Rd
= 0.547 P
t,c
P
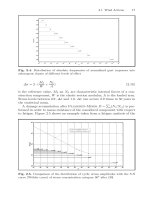
e
experimental shear resistance
P
t,c
mechanical model (concrete failure) (mean value)
P
t,s
mechanical model (steel failure) (mean value)
P
Rk
characteristic value of the shear resistance according
EN 1990 (5%-fractile)
P
Rd
design value of the shear resistance according EN 1990
Fig. 3.149. Result of the statistical analysis of the results of 101 statically loaded
push-out tests according to EN 1990 [16]
P
Rd
=0.245 d
2
α
E
cm
f
ck
1
γ
v
(γ
v
=1.25) (3.256)
≤ 0.83 πf
uk
d
2
4
1
γ
v
(γ
v
=1.25) (3.257)
This result is nearly coincident to the original evaluation [684] and it confirms
the use of the secant modulus of elasticity E
cm
[33, 25] as one of the main
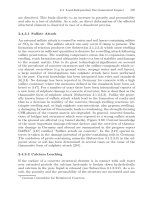
material properties of the concrete in equation (3.256). In Figure 3.150 the
result of the statistical re-analysis according EN 1990 is compared to the
design rules of the German and the European rules. The design rules of DIN
18800-5 [27] are nearly identical to the result of the statistical re-analysis,
whereas in the Eurocode 4 [22, 23] a significant higher shear resistance can
be taken into account. In order to compensate this lower safety level in the
German Annex of Eurocode 4 [34] a partial safety factor γ
v,c
=1.5forthe
mode ”failure of the concrete” was introduced.
3.3.4.2.2 Failure Modes of Headed Shear Studs Subjected to High-Cycle
Loading
The test results given in Chapter 3.2.3 clearly indicate, that the mechani-
cal properties of headed shear studs under static loading can not be applied
without restrictions on the properties of headed shear studs subjected to
3.3 Modelling 323
Table 3.27. Result of the statistical analysis according EN 1990, Annex D [16]
test according
theoretical model ("failure" mode) P
t,c
P
t,s
n number of tests 58 43
b
¦
¦
2
ti
tiei
P
)PP(
b
1.0 1.0
i
G
ti
ei
i
Pb
P
G
- -
i
' )(ln
ii
G '
- -
'
¦
' '
i
n
1
0.035 0.012
'
s
2
i
2
)(
1n
1
s
¦
''
'
0.124 0.087
G
V
1)s(exp
2
'
G
2
V
0.124 0.088
rt
V
2
i
i
t
m
t
n
1i
2
rt
P
)(P
1
»
»
»
¼
º
«
«
«
¬
ª
V
w
w
6
XX
V
0.139 0.078
r
V
2
rt
2
r
VV
G
2
V
0.187 0.117
G
Q )1V(ln
2
GG
Q
0.124 0.087
rt
Q
)1V(ln
2
rtrt
Q
0.138 0.078
Q )1Vln(
2
r
Q
0.185 0.117
Rk
P
)Q5.0
Q
k645.1(exp)X(PbP
2
2
n
2
rt
m
tRk
G
Q
0.721 P
t,c
0.811 P
t,s
Rd
P
)Q5.0
Q
k04.3(exp)X(PbP
2
2
n,d
2
rt
m
tRd
G
Q
0.547 P
t,c
0.678 P
t,s
R
J
RdRk
R
P/P J
1.318 1.198
n
k
V
x
unknown – 5%-fractile – (n) 1.694 1.713
n,d
k
V
x
unknown – (n) 3.28 3.366
Table 3.24,
Table 3.25
Table 3.26
high-cyclic preloading. High cyclic loading leads to a reduction of the stiff-
ness of the interface between steel and concrete due to the irreversible slip
and moreover it results in an early reduction of the static strength. In order
to find the reasons for the significant effect of high-cyclic loading, the concrete
slabs were separated from the steel beams and the fractured surfaces at the
324 3 Deterioration of Materials and Structures
concrete failure:
steel failure:
d diameter of the shank (16 d d d 25mm)
f
uk
characteristic value of the ultimate tensile strength
of the stud shank
f
ck
characteristic value of the compressive cylinder
strength (according EN 206)
E
cm
mean value of the modulus of elasticity for concrete
(secant modulus) (according EN 206)
D = 0.2 [(h/d) + 1] for 3 d h/d d 4; = 1.0 for h/d > 4
k
c,d
, k
s,d
coefficients to fit the theoretical model
J
v,c
, J
v,s
partial safety factors for the design shear resistance
c,vckcm
2
d,cc,Rd
fEdkP JD
s,v
2
ukd,ss,Rd
)4d(fkP JS
0.245 / 0.83
statistical analysis
(EN 1990)
J
v,c
/ J
v,s
[-]
f
u
[N/mm²]
k
c,d
/ k
s,d
[-]
1.25 / 1.25 460 - 620
design value: P
Rd
= min (P
Rd,c
, P
Rd,s
)
EN 1994-1-1 incl.
National Annex
EN 1994-1-1
DIN 18800-5
0.25 / 0.80 < 450
< 500
< 500
0.29 / 0.80
0.29 / 0.80
1.25 / 1.25
1.25 / 1.25
1.50 / 1.25
Fig. 3.150. Comparison of the result of the statistical analysis with the rules in
current German and European standards
metallurgical investigations
microstructure
forced fracture area and
fatigue fracture area
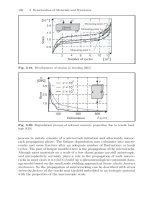
Fig. 3.151. Preparation stages for examination purposes
foot of each headed stud of each test specimen were examined. Figure 3.151
shows in detail the stages of preparation of the test specimens after the test
phases for examination purposes. In two specific cases additional metallurgical
investigations of the microstructure were carried out.
The exposed fracture surfaces at each stud foot consisted of a typical
smooth fatigue fracture zone and a partly coarse forced fracture zone as shown
in Figure 3.152. In nearly all cases these zones could be clearly distinguished
3.3 Modelling 325
P1
fatigue fracture (with
arrest lines)
forced fracture
Mode A:
crack initiation at point P1 followed by a
horizontal crack propagation through the shank
Mode B:
crack initiation at point P1 or at P2
followed by a crack propagation
headed through the flange
Mode A
weld collar
stud shank
fatigue fracture
Mode B
mode B
crack tip
P2
forced fracture
P1: transition between the stud shank and the weld collar
P2: transition between the weld collar and the flange
Fig. 3.152. Failure modes A and B
from each other because of the different surface structures, so that it was pos-
sible to determine clearly the size and the geometry of the exposed fatigue
fracture areas. The fatigue fracture area was in all cases caused by cracks at
the stud foot, initiated at the points P1 or P2 and then propagating horizontal
through the shank or headed through the flange. The corresponding forced
fracture area was caused by a combination of a bending-shear failure of the
residual cross section. This kind of failure occurred at the end of a fatigue test
at which due to crack propagation the static strength was reduced to the ap-
plied peak load or during the static loading phase after high cyclic preloading,
which was carried out in order to determine the residual strength. The failure
modes were closely correlated with the peak load P
max
. For high peak loads
such in series S2 and S4 only mode A occurred. For lower peak loads such in
series S1, S3, S5E in most cases mode B occurred. Nevertheless in some cases
twocracksofmodeAandmodeBweredetectedatthesametimeatastud
foot, which means, that two cracks grew directly above each other and both
could initiate forced fracture.
The investigations of the microstructure revealed that both points, P1 and
P2, show exceptionally high geometrical and metallurgical notch effect due to
welding technique. This is in no case in agreement with the requirement of
common arc-welded joints in structural steelwork regarding the quality level
according to [35]. Both sharp transitions are typical results of the drawn arc
stud welding process. The process begins with pre-setting the current time and
the welding time and placing the stud on the flange. Upon triggering a pilot
arc occurs after lifting the stud to a pre-set height. Subsequently the main arc
is ignited which melts the end of the stud and the flange on the opposite side.
By means of a spring force finally the stud is forged into the molten flange.
326 3 Deterioration of Materials and Structures
crack initiation point (P2)
corresponding crack tip
crack propagation inter- and transcristallin
voids with rough surfaces and transitions
proper stud weld
200:1
200:1
Fig. 3.153. Weld collar (exterior appearance and inner state) - Close-up view of
the crack shown in Figure 3.152 at the starting point (P2) and at the corresponding
crack tip
This forces excessive material out into the ceramic ferrule shaping the weld
collar. Due to the different aggregate states this does not lead to a fusion
between the inside of the weld collar and the outside of the stud base and
results in sharp edged transitions in P1 and P2. These two points coincide
with the points of the highest stress levels and the crack growth consequently
starts at these notches. Moreover Figure 3.153 (left) illustrates, that the drawn
arc welding process leads to an apparent faultless weld collar on the outside,
but on the inside it may contain voids due to the degassing process during
welding. So contrary to the outside appearance the weld collar is generally
not homogeneous and of lower strength compared to the stud and the base
material.
Figure 3.153 (right) shows the crack initiation point P2 and the correspond-
ing crack tip of the crack in Figure 3.152 enlarged 200 times. It illustrates,
that the transition between the weld collar and the flange is not smooth but
undercut, being an ideal condition for early crack initiation in the case of high
cycle loading. In the present case the crack propagated both transcrystalline
and intercrystalline. Beginning near the line of fusion at the transition between
the collar and the flange the crack grew through the fine grained structure of
the heat affected zone, working its way through the coarse grained structure
3.3 Modelling 327
fatigue fracture area (A
D
)
1.0
P
u
/ P
u,0
1.0
0.8
weld collar
shank
mode B
A
D
/(A
D
+A
G
)
0.0
0.6
0.4
0.2
0.80.6
0.4
0.2
failure
static
fatigue
static
fatigue
fatigue
fatigue
static
cyclic loading
constant
constant
constant
constant
variable
variable
variable
series
S2, S4
S2, S4
S1, S3, S5E
S1, S3, S5E
S5
S6
S9
62 tests
Æ
496 studs
mode A and mode B
within a specimen
mode A
crack orientation
point C
forced fracture area (A
G
)
crack front
circular
only mode A
within a specimen
0.0
A)(Eq.
AA
A
.
P
P
GD
D
u,0
u
| 601
)B.Eq(
AA
A
P
P
GD
D
u,0
u
| 1
Fig. 3.154. Correlation between reduced static strength and damage at the stud
feet for failure modes A and B based on the fatigue fracture area for a
v
<a
h
of the heat affected zone and ending at the non-affected base material of the
flange.
3.3.4.2.3 Correlation between the Reduced Static Strength and the
Geometrical Property of the Fatigue Fracture Area
In order to detail the crack development, the test specimen were released and
reloaded periodically during the cyclic loading phases. As shown in Figure
3.154 in the case of mode A it was possible to produce arrest line by means of
this test procedure, which could be used for information about the number of
load cycles causing crack initiation and about the crack propagation. Probably
due to different microstructure no usable stop marks could be observed in the
case of mode B although the testing procedure was always the same. However,
in all cases geometrical properties of each fatigue fracture area (such as outline,
size (area A
D
) , extension in the direction of the loading (crack length a
h
),
extension into the base material (crack depths a
v
)) can be used for evaluation
purposes.
The relationship between the reduced static strength and the relative size of
the fatigue fracture zone can be assumed to be linear as a good approximation
independently of the modes. This is illustrated in Figure 3.154, which shows
the result of an evaluation of 496 studs of 62 push-out tests.
328 3 Deterioration of Materials and Structures
In Figure 3.154 A
D
is the area of the fatigue cracking zone and A
G
the area
of the forced shear fracture, both taken as the horizontal projections. In the
case of mode A the whole fracture area (A
D
+ A
G
) corresponds to the stud
area, which is for this reason clearly defined. In the case of mode B due to the
crack propagation into the flange the whole fracture area can be much larger
than the stud area. In order to interpret the test results in a definite way and
additionally allow for situations, in which only the fatigue fracture area A
D
(e.g. from non-destructive measurements) is known, it is necessary to make
reasonable assumptions concerning the definition of the shape of the forced
fracture area. Based on the observations of the failure modes the size of the
forced fracture area was determined by assuming, that this area is bounded by
the crack front and by a circular border passing through the outer diameter
of the weld collar on the opposite side (given as point C in Figure 3.154). The
coefficient of correlation of the linear relationship is 0.96 for series S2 and S4,
in which due to the high peak loads of 0.70 P
u,0
exclusively mode A occurred.
Except for very high degrees of damage of more than 90 % it can be deduced
that the crack propagation in the shear stud independently of the modes has
approximately 60 percent attribution in the reduction of the static strength.
Regarding the reduced static strength the loading history during the cyclic
loading phase (force controlled, displacement controlled, one block of loading
and multiple blocks of loading) has only a minor influence. In the case of
mode B (test series S1, S3 and S5E) the reduction of the static strength is
very small for damage grades A
D
/(A
D
+ A
G
) between 35 % and 80 %. For
estimations on the safe side the dotted relationship according equation (B) in
Figure3.154 can be applied.
For practical applications in which (e.g. from non-destructive inspection
like ultrasonic) only the crack initiation point and the crack length at a stud
foot instead of the whole outline of the fatigue fracture area is known, the
relationships Eq. C and Eq. D according to Figure 3.155 can be used. If crack
initiation starts at the outer edge of the weld collar (mode B) the horizontal
crack length a
h
should be referred to the diameter d
W
of the stud weld. If
crack initiation starts at the transition between the stud shank and the inner
crack initiation
at Point P2
d
d
W
a
h
a
v
a
h
Whu,0u
da6.01PP |
a
h
da6.01PP
hu,0u
|
a
a
v
§ 0
a
h
crack initiation
at Point P1
P2
P1
P
max
, P
u
P
max
, P
u
P
max
, P
u
P
max
, P
u
C.Eq
D.Eq
Fig. 3.155. Correlation between reduced static strength and damage at the stud
feet for failure modes A and B based on crack lengths and crack initiation points
for a
v
<a
h
3.3 Modelling 329
edge of the stud weld (mode B) the crack length a (a ∼ a
h
) should be referred
to the stud shank diameter d. According to Figure 3.154 on the safe side the
coefficient 0.6 can be substituted by 1.0.
3.3.4.2.4 Lifetime - Number of Cycles to Failure Based on Force Controlled
Fatigue Tests
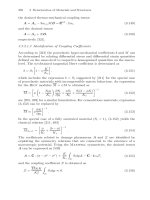
In Figure 3.156 the results of the fatigue tests of series S1 to S4 and S5E are
compared with the corresponding test results, from which the fatigue strength
curve in Eurocode 4 was derived [685]. In this concept the prediction of the
number of cycles to failure depends on the nominal shear stress in the shank
of the studs, provided that the peak load P
max
is smaller than 0.6 P
u,0
[685].
It can be seen, that the lifetimes of the fatigue tests of series S1, S3 and S5E,
which lie in the scope of application of the fatigue strength curve, are predicted
very well. One of the reason is obviously the additional lateral supporting of
the concrete slabs shown in Figure 3.100 of Chapter 3.2.3, which was not used
in the tests on which the fatigue curve is based.
However, the results of the fatigue tests clearly show the influence of the
peak load P
max
on the life time. In the case of an identical relative load range
ΔP /
P
u,0
it can be observed that if the relative peak load P
max
/ P
u,0
is
increased the number of cycles to failure decreases from 6.2 ×10
6
to 3.5 ×10
6
load cycles (series S1 and S4) and from 6.4×10
6
over 5.1×10
6
to 1.2×10
6
load
cycles (series S5E, S3 and S2), respectively. In order to develop a theoretical
model for the prediction of the fatigue life, in which not only the effect of the
load range ΔP can be taken into account, but also the effects of the static
'W
cm
= 110 N/mm²
'W
ck
= 90 N/mm²
5%-fractile
'P
'P
2
d
P4
S
'
W'
d
10
4
10
5
10
6
N
c
= 2x10
6
10
7
1000
100
10
N (log)
'W
R
(log)
S2, S4
S1, S3, S5E
(P
max
0.44 P
u,0
)
(P
max
= 0.71 P
u,0
)
test results: m = 8.658
Eurocode 4: m = 8
c
m1
c
R
N
N
W'
¸
¸
¹
·
¨
¨
©
§
W'
Fig. 3.156. Comparison of fatigue test results with the prediction in Eurocode 4
330 3 Deterioration of Materials and Structures
strength P
u,0
and the peak load P
max
, national and international fatigue tests
of push-out test specimens subjected to unidirectional cyclic loading were
reanalysed in the view of these parameters. To achieve comparable results
great importance was attached to the geometry of the specimen, the number
of welded studs and the lateral supporting condition of the concrete slabs.
In this analysis only those tests were included, in which the requirements of
the Eurocode 4 regarding geometry and test conditions were met. Thus the
specimen had to consist of one steel beam and two lateral concrete slabs with
four headed studs on each flange. The slabs had to be casted in horizontal
position and the studs had to be welded with an adequate welding procedure
ensuring the formation of weld collar in accordance with EN13918 [10] and
EN14555 [11]. These requirements were fulfilled by 26 tests. In the case of 13
specimen the concrete slabs were additionally laterally supported. Among the
group of test specimen without lateral supporting count the tests of Oehlers
[591] and Hanswille [342] of 1989 and 1999. Among the other group count the
fatigue tests listed in Table 3.6 (Chapter 3.2.3) and a fatigue test of Velkovic
et al. [809] of 2003. In the case of [342] short time static tests were not carried
out, so the reference value of the static resistance was calculated with the
model given in Figure 3.148. In the 26 tests the concrete cylinder compressive
strength f
c
according to EN 206 [12] varied between 31.0 N/mm
2
and 54.3
N/mm
2
. The range of the diameter d of the stud shanks was 13 mm to 25
mm and the tensile strength f
u
of the studs lied between 450 N/mm
2
and
528 N/mm
2
.
For evaluation purposes the test were sorted in two groups each with iden-
tical supporting condition and evaluated by means of a common theoretical
model according to Figure 3.157 giving the value of the fatigue life of a headed
shear stud embedded in solid concrete slabs subjected to unidirectional cyclic
loading. The free parameters K
1
and K
2
are to be chosen in dependence of
the lateral supporting condition. In the case of additional lateral support, the
parameters can be chosen to K
1
= 0.1267 and K
2
= 0.1344. In the case of no
lateral support the parameters are to be chosen to and to K
1
= 0.1483 and
K
2
= 0.1680.
3.3.4.2.5 Reduced Static Strength over Lifetime
As it can be seen from the tests the static strength reduces with increasing
number of cycles. The failure envelope, i.e. static strength over the number
of cycles, is characterized by a sigmoidal shape as shown in Figure 3.158 (a).
The results of the five more tests given in [809] with exact the same specimen
geometry and supporting condition and a different relative peak load show
the same characteristics and are also illustrated in Figure 3.158 (a).
The sigmoidal relationship between the relative values of the static strength
and the load cycles can be described with the equation given in Figure 3.158
(b). This equation is the result of a parametric study of totally 60 tests. It is
to mention that the relative load range chosen in the tests was between 0.2
and 0.25. If further tests with different values of the load range are available
3.3 Modelling 331
N
f,t
10
4
u,0
P
P5.0
max
P
2
K
1
K
u,0
P
max
P
1
f
10N
'
with lateral restraint
without lateral restraint
N
f,e
K
1
= 0,1267
K
2
= 0,1344
K
1
= 0,1483
K
2
= 0,1680
10
5
10
6
10
7
10
8
10
4
10
8
10
7
10
6
10
5
26 tests
theoretical model
experimental results
N
f
: number of load cycles to failure in a force-controlled push-out fatigue test
with without
lateral restraint
Fig. 3.157. Theoretical model for the prediction of the fatigue life of a headed shear
stud in a push-out test - relationship between experimental and theoretical fatigue
life
°
°
¯
°
°
®
t
d
u,0
max
P
P
1
¸
¸
¸
¹
·
¨
¨
¨
©
§
'
1
NN1
1
ln0.04-0.54
P
PP
74.0
P
P
fu,0
max
u,0
u
0.60
0.30
0.71
0.44
0.71
0.44
0.255E
0.20Vel
0.204
0.253
0.252
0.201
series
u,0
PǻP
u,0max
PP
u,0u
PP
0.2 0.4
0
0.4
0.2
1.0
0.8
0.6
0.6 0.8 1.0
1.2
0.2 0.4
0
0.4
0.2
1.0
0.8
0.6
0.6 0.8
1.0
expu,0
u
)P(P
theoru,0
u
)P(P
a) b)
0
0
60 tests
f
NN
Fig. 3.158. Analytical description of the reduced static strength over lifetime (a) -
Comparison of the theoretical and experimental values of the reduced static strength
(b)
332 3 Deterioration of Materials and Structures
the parametric study should be repeated in order to extend the scope of
application.
3.3.4.2.6 Load-Slip Behaviour
Regarding the numerical simulation of composite beams the load deflection
behaviour of headed shear studs under static and cyclic loading is of main
interest. These results should not be neglected but be comprised as fundamen-
tal research results. According to different stages of the test procedure it was
possible for the tests reported in Chapter 3.2.3 to deduce the load-deflection
behaviour of headed studs embedded in normal weight concrete during ini-
tially static loading, during cyclic loading (including phases of releasing and
reloading) and during static loading after high cycle pre-loading.
As already known the initial static load-slip behaviour of headed shear
studs embedded in normal weight concrete is characterized by a high initial
stiffness and high ductility. Based on a statistical analysis of 15 comparable
static push-out tests of the series S1-S6 and S9 the mean behaviour can be
described by the exponential function, given in Figure 3.159, which can be
applied up to mean value of the slip at ultimate load δ
u
of 7.5 mm. The
associated coefficient of variation V
x
of the slip depends on the load level and
P/P
u,0
[-]
0
1
0.2
0.4
0.6
0.8
1.0
7
8
9
10 11 12
0
G [mm]
P/P
u,0
[-]
V
x
[-]
0
0.2
0.4
0.6
0.8
1.0
0
0.1 0.2 0.3
0.4
0.5
0.6
0.7
P
G
G
u
= 7.5 mm
scatter band
)e1(PP
59.0
į22.1
0u,
|
2
3
4
56
0.6 P
Rd
= 0.41 P
u,0
(sf)
0.6 P
Rd
= 0.33 P
u,0
(cf)
P
Rd
= 0.68 P
u,0
(su)
P
Rd
= 0.55 P
u,0
(cu)
abbreviations: s: "steel failure" - c: "concrete failure" - u: ultimate limit state - f: fatigue limit state
G
sf
= 0.24 mm
G
cf
= 0.15 mm
mean behaviour
0
1
0.2
0.4
0.6
0.8
1.0
7
8
9
0
2
3
4
56
P/P
u,0
[-] P/P
u,0
[-]
G [mm]
G [mm]
GG
2. loading
G
pl
1. loading
2. loading
1. unloading
»
»
¼
º
«
«
¬
ª
KKG G
5.1
0,u11pl
)PP(
1.1
1
»
»
¼
º
«
«
¬
ª
KKG G
5.0
0,u22
loading.2
)PP(
5.7
1
1
22.1
)PP1(ln
59.0/1
0,u
G
a)
b)
Fig. 3.159. Standardised load-slip curve of headed shear studs in normal weight
concrete - load deflection behaviour after first unloading and successive reloading
3.3 Modelling 333
12
0.4
0.2
1.0
0.8
0.6
P/ P
u,0
34 11
0
56789
10
12
P
max
/ P
u,0
= 0.71
P
max
/ P
u,0
= 0.44
P
G
7.5 mm
G
[mm]
)valuemean()e1(PP/
59.0
22.1
u,0
G
G
u
Fig. 3.160. Effect of high-cycle loading on the load-slip behaviour
varies between 0.65 at low levels and 0.25 at higher levels. In addition to the
initial static behaviour the large number of tests under the same conditions
were used for the evaluation of both, the magnitude of the plastic slip after
first unloading and the magnitude of the slip after successive reloading to
the preceding load. As shown in Figure 3.159 these values can be calculated
by multiplication the initial static slip δ taken as a reference value with two
simple functions η
1
and η
2
.
Provided that the initial static load is less than the ultimate load first
unloading and successive reloading only leads to an increase of the elastic and
the accumulated plastic slip. However, high initial loading to the ultimate
load followed by a hysteresis may additionally result in a lower load bearing
capacity at the end of the reloading.
The functions η
1
and η
2
illustrate that the secant stiffness during unloading
and reloading are naturally slightly different and that their magnitudes de-
crease with increasing load level because of disproportionate increase of plastic
slip.
One additional important question in the concept of the numerical sim-
ulation of cyclic loaded beams is the influence of the cyclic loading on the
load-slip behaviour of the studs after cyclic preloading. In Figure 3.160 the
grey shaded area again shows the range of the load-slip curves of all statically
loaded push-out tests without any pre-damage. The mean value of this range
is given by the marked continuous blue line within the shaded area. All other
curves show the static behaviour after different numbers of load cycles. The
load-slip behaviour of a stud without any pre-damage can be interpreted as
an envelope for all other cases, as all other curves lie within or significantly
below the shaded area.
334 3 Deterioration of Materials and Structures
054.3
P
P5.0P
522.11
P
P5.0P
865.24D
e049.0D
N/N1
N/N
D
0,u
max
2
0,u
max
2
)
0,u
P/
max
P(04.5
1
2
D/1
f
f
1Npl,
¸
¸
¸
¹
·
¨
¨
¨
©
§
'
¸
¸
¸
¹
·
¨
¨
¨
©
§
'
¸
¸
¹
·
¨
¨
©
§
G
P = K
el,N
P
u,N
(G – G
pl,N
) for P 0.8 P
u,N
K
el,N
=1.4 [1/mm]
G
pl,N
P
u,N
P
G
K
el,N
0.8P
u,N
elastic stiffness
plastic slip
Fig. 3.161. Elastic stiffness and accumulated plastic slip after N number of load
cycles - each based on the results of test series S1 - S4 and S5E
High-cyclic loading results in a linearization of the static load-slip behaviour
up to approximately 80% of each corresponding reduced static strength. The
elastic stiffness after high cyclic preloading can be assumed as being constant
if the stiffness is determined on the basis of the reduced static strength P
u,N
.
The mathematical functions for both, the elastic stiffness and the accumulated
plastic slip δ
pl,N
after N numbers of load cycles are given in Figure 3.161.
3.3.4.2.7 Crack Initiation and Crack Development
The effect of force controlled high cyclic pre-loading on the static strength as
shown in Figure 3.104 in Chapter 3.2.3 is mainly caused by an early crack ini-
tiation followed by a long phase of crack propagation. Due to the reduction of
the static strength under cyclic loading, the mechanical properties of headed
shear studs under static loading cannot be adopted on the behaviour of studs
under fatigue loading. In order to assess existing design concepts of current
national and international codes and in order to develop new concepts based
on based on crack propagation the knowledge of the exact time of crack initia-
tion is of main interest. Another important question is the question about the
cut-off limit. In comparison with typical welding details in steel structures, the
sharp notches in the welding area lead to the conclusion that there is only a
very low load limit or no load limit, where a crack initiation can be excluded.
In the case of horizontal cracks of type A it is possible to produce system-
atically arrest lines (visible to the naked eye) on the fatigue fracture areas by
releasing and reloading the test specimens during the cycle loading phases.
As shown in Figure 3.162 for a representative stud of test specimen S2-4b
(fatigue test in series S2) the arrest lines provide important details of crack
initiation and crack growth velocity. By means of the correlation between the
reduced static strength and the damage at the stud feet given in Figure 3.154
the reduced static strength can be determined if the fatigue fracture area
A
D
is known. In the present case the crack velocity function shows a nearly
3.3 Modelling 335
A
D
(N/N
f
) [mm²]
50
100
150
200
0.60.2 0.4 0.8 1.00
0
N/ N
f
dA
D
/dN
i
[10
-3
mm²/load cycle]
0.1
0.2
0.3
0.4
0
0.60.2 0.4 0.8 1.00
N/ N
f
A
D
/(A
D
+A
G
)
1.0
0.8
0.6
0.4
0.2
0.40.30.20.1
0
0 0.5
P
u
/ P
u,0
crack type A
force fracture area (A
G
)
fatigue fracture area (A
D
)
test S2-4b
stud D2b
test S2-4b
stud D2b
P
max
load cycle
P
GD
D
u,0
u
AA
A
.~
P
P
6001
reduction of static strength crack propagation
crack velocity
4dAA
2
GD
S
0.6
0.7
arrest lines caused by unloadings and
reloadings during the cyclic loading phase
Fig. 3.162. Relationship between crack velocity, crack propagation and reduction
of static strength for test series S2
sigmoidal characteristic. Similar to the development of plastic slip the crack
velocity increases disproportionately at the end of the fatigue life reaching a
critical crack length depending on the peak load level.
The arrest lines clearly show that the start of the crack growth nearly from
the beginning of the cyclic loading is possible. This observation led to the
question whether in real composite structures significant cracking at the stud
feet due to cyclic loading can be avoided if they are designed on the basis of
current national and international codes.
Based on the results explained above [351, 354, 355], in current German
codes [27, 18, 34] the safety level for headed shear studs subjected to cyclic
loading was increased compared to the safety level in other international
codes based on Eurocode 4. The partial safety factor γ
Mf,v
was changed from
1.0 to 1.25 in the design model for the fatigue resistance of headed shear
studs by means of the characteristic value of the fatigue resistance curve (5%-
fractile) shown in Figure 3.156. The effect of this approach is summarized in
Figure 3.163. Due to the slope m = 8 an increase of the partial safety factor
from 1.0 to 1.25 results in a decrease of the design value of the fatigue life N
f
of cyclic loaded headed shear studs by factor 6 (γ
m
Mf,v
=1.25
8
). On the other
hand the characteristic value (5%-fractile) of the fatigue resistance curve used
in the codes leads to a theoretical life time which is 5-times lower than the
lifetime according to the mean value of the fatigue strength derived in [685].
Hence in current German codes in a design only 1/30 of the mean value of the
336 3 Deterioration of Materials and Structures
'W
c
= 110 N/mm²
10
4
10
5
10
6
N
c
= 2x10
6
10
7
10
3
10
2
10
1
N (log)
'W
R
(log)
c
m
R
c
c
m
c
R
NN
N
N
¸
¸
¹
·
¨
¨
©
§
W'
W'
W'
¸
¸
¹
·
¨
¨
©
§
W'
1
'W
c
= 90 N/mm²
'W
c
= 72 N/mm²
)5/1(~N/1
21,f
)30/1(~N/1
31,f
)6/1(~N/1
32,f
307297211072110
696572907290
59849011090110
8
31
8
32
8
21
~.)/(²)mm/N(N/²)mm/N(NN
~.)/(²)mm/N(N/²)mm/N(NN
~.)/(²)mm/N(N/²)mm/N(NN
cfcf,f
cfcf,f
cfcf,f
W' W'
W' W'
W' W'
curve 2
curve 3
'P
'P
2
d
P4
S
'
W'
d
curve 1: fatigue strength curve – mean value (test results m = 8.658 ~ 8)
curve 2: fatigue strength curve – characteristic value (5%-fractile) (J
Mf,v
= 1.0)
curve 3: fatigue strength curve – design value (J
Mf,v
= 1.25)
curve 1
65.76
4.1x10
6
}
design codes m = 8
(tests S13_2)
(tests S13_2)
Fig. 3.163. Fatigue strength and lifetime of cyclic loaded shear studs according
different design concepts depending on the safety levels - curve 1 [685] - curve 2
[22, 23] (European codes) - curve 3 (German codes) [27, 18, 34]
lifetime given in [685] can be adopted, whereas in international codes based
on Eurocode 4 1/5 can be adopted.
In order to investigate, if these safety margins are sufficiently high to avoid
significant cracking at the stud feet during lifetime test series S11 and S13
were performed as reported in Chapter 3.2.3. In the case of test series S13 the
cyclic loading phases were aborted just after subjecting 1/30 (N = 4.1 × 10
6
load cycles) of the mean value of the number of cycles to failure according
to [685] (Δτ = 65.76 N/mm
2
-m=8-N
f
=1.22 ×10
8
load cycles) before
determining the reduced static strength. In the cases of test specimens S11-4a
and S11-4c the cyclic loading phases were completed after applying 1/17.4
and 1/19872 of the corresponding values according [685] (m = 8). In all cases
the peak loads P
max
were lower than 0.6 P
Rd
, so that the requirement of
Eurocode 4 regarding the peak load level under service loads were fulfilled.
In Table 3.28 the experimental observed crack lengths in test series S11
and S13 are listed. In the cases of test specimens S13-2b and S13-2c, in which
the cyclic loading phase was aborted just after subjecting 1/30 of the mean
value of the number of cycles to failure according to [685] the crack length was
of remarkable size. According to Figure 3.155 the observed cracks result in a
reduction of the static strength of approximately 10-15%. This can be accepted
3.3 Modelling 337
Table 3.28. Mean values of the crack length a
h
(see Figure 3.155) in test series S11
and S13
test S11-4a S11-4b S11-4c S13-2a S13-2b S13-2c
a
h
[mm] ~ 0.8 20.7 ~ 0.7 ~ 0.8 5.3 5.4
at the end of the numerical design life. However, it must be stated, that with
the current design concepts cracks at the stud feet cannot be avoided.
3.3.4.2.8 Improved Damage Accumulation Model
Palmgren-Miner cumulative linear damage rule [611, 543] provides a simple
criterion for predicting the extent of fatigue damage induced by a particular
block of constant amplitude cyclic loads in a loading sequence with different
stress amplitudes. This linear damage rule assumes that the number of cycles
imposed on a component, expressed as a percentage of the total number of
cycles of the same amplitude to cause failure, gives the part of damage and
the order of the loading blocks does not influence the fatigue life. If N
i
is the
number of cycles corresponding to the ith block of constant loading amplitude
in a sequence of m blocks with N
f,i
as the number of cycles to failure, the
failure occurs, if condition 3.258 is fulfilled.
m
i=1
N
i
N
f,i
= 1 (3.258)
Evaluation of the tests with multiple blocks of loading on the basis of the
linear damage accumulation hypothesis of Palmgren and Miner, on which the
present design codes are based, is shown in Figure 3.164. The fatigue life N
f,i
corresponding to each block of cyclic loading is gained from the results of the
constant amplitude tests of series S1 to S4 and S5E. The missing values of
number of cycles to fatigue for the blocks 2 and 3 in the test with four blocks
of loading are determined by means of a linear interpolation from the results
of series S1 and S4. Thus, for the peak loads of 101 kN and 120 kN per stud
the fatigue life N
f
is determined as 5.3 ×10
6
and 4.4 × 10
6
number of cycles,
respectively.
It is obvious that except for one test in Figure 3.164 all results of the
lifetime prediction according to Palmgren and Miner lie on the unsafe side.
Main reason for this is neglecting of the effects due to crack propagation in the
shank of the stud and the increasing local crushing of concrete surrounding
the stud weld.
An improvement of the prediction is succeeded by the introduction of an
additional damage term Δn
fi
in equation (3.259), which considers the effects
resulting from crack propagation in the stud and steady increasing of crushing
of concrete due to cyclic loading;
338 3 Deterioration of Materials and Structures
0
N
fe
[x 10
6
]
6
2
1
N
ft
[x 10
6
]
0
damage accumulation according to Palmgren and Miner
test results
lifetime prediction
7
3
4
5
12
3
4
56 7
0.36S5-6b
0.670S6-4c1.01S5-6a
0.566S6-4a0.22S5-4c
0.564S6-3c0.22S5-4b
0.549S6-3b0.31S5-4a
0.592S6-4b0.64S5-4d
0.686S6-3a0.21S5-3a
0.75S5-6d0.33S5-2c
0.52S5-6c0.21S5-2a
K
test
K
test
¦¦
ift
fi
i
N
Ș
1
NȘ
N
N
0.1
N
N
!
fi
i
¦
Fig. 3.164. Comparison between the test results with the results of the lifetime
prediction according to Palmgren-Miner
m
i=1
N
i
N
f,i
+
m−1
i=1
Δn
f,i
= 1 (3.259)
Figure 3.165 explains this method by means of a cyclic test with two blocks
of loading where the peak load of the first block is increased in the second
block while the load range was held constant. The two curves 1 and 2 give the
relationship between the relative static strength and relative number of load
cycles and corresponding to the cyclic loading parameter of each block. After
applying N
1
number of cycles the static strength reduces to the value P
u,N1
on curve 1 (Point B).
The relative damage until this point can be expressed with the term N
1
/
N
f1
based on the Palmgren-Miner rule. The point C on curve 2 corresponds
to the same damage state, i.e. the same reduced static strength for the loading
parameters of the second block and thus points up the starting value for the
subsequent course of the reduction of the static strength along the path of
curve 2. The horizontal offset Δn
f
between the damage equivalent points B
and C can be interpreted as the loss of the lifetime and is introduced to the
damage sum in the new model. The remaining lifetime is then governed by
the value of N
2
/ N
f2
until the failure of the specimen due to the decrease of
the static strength to the value of peak load P
max,2
.
In Figure 3.165 the fatigue fracture zones corresponding to reduced static
strength are depicted for different states from points A to E. As a consequence
3.3 Modelling 339
0.2 0.4
0
0.4
0.2
1.0
0.8
0.6
2
0.6 0.8 1.0
N
i
/ N
f,i
C
P
max,1
/ P
u,0
P
max,2
/ P
u,0
P/ P
u,0
P
max,1
/ P
u,0
N
2
/N
f,2
N
1
/N
f,1
1ǻn
N
N
D
if,
if,
i
d
¦¦
'P/ P
u,0
'P/ P
u,0
D
E
A
D,A
= 0
A
D,B
A
D,C
~ A
D,B
A
D,E
A
D,D
'A
D,E-D
0
fatigue fracture area A
D
'n
f,1
B
A
1
Fig. 3.165. Damage accumulation considering the load sequence effects
of the correlation between the fatigue fracture area A
D
and the relative value
of the reduced static strength P
u,N
/ P
u,0
the fracture areas in states D and
E differ from each other due to different peak loads. Due to the raising of the
peak load in the second block of loading, fatigue fracture area at the end of the
lifetime can not be shaped corresponding to the fatigue fracture area A
D,E
of the first block of loading. The fatigue failure occurs by a rather smaller
fatiguefractureareaA
D,D
. In this case the damage term Δn
f,1
considers the
shortening of the fatigue life in consequence of the reduction of the fatigue
fracture area to an extent of ΔA
D,E−D
.
The results of the tests S5-2, S5-3 and series S6 showed that the loading
sequence (i.e. increasing of decreasing the peak load) has a subsidiary effect on
the fatigue life of a cyclic test with multiple blocks of loading. For an improved
damage accumulation hypothesis before the analysis the load collectives with
decreasing loadings must be resorted to collectives with increasing loadings.
This procedure is shown exemplarily for the tests S6-4 in Figure 3.166.
In such case the additional damage terms Δn
f,i
can be interpreted as the
effect of concrete damage on the extent of the crack velocity. In test with
increasing peak load the failure occurs by a fatigue fracture area A
D,A
and
in the case of decreasing peak load by a fatigue fracture area A
D,B
which
is greater then the A
D,A
by an extent of ΔA
D,B−A
. Considering identical
lifetimes due to bending stresses in the stud shank resulting from local concrete
damage and consequential high notch stresses at the crack tip, in the case of
decreasing peak load the crack velocity isgreaterthaninthecase of increasing
peak load.
340 3 Deterioration of Materials and Structures
0
0.4
0.2
1.0
0.8
0.6
1
P
u
/ P
u,0
0.8
1.0
4
0.44
0.54
0.64
0.74 ~ 0.71
0.2 0.4 0.6
Mittelwerte
Nf
,
4=
3533300
N
f,3
=441
99
1
5
Nf,2=
530653
1
6
1
93
14
6
=Nf,1
(0.20/0.64)
(0
.2
0/0
.71
)
~
(0
.2
0/0
.74
)
(0.20/0.54)
(0.20/0.44)
0
1.0
0.9
0.8
0.7
0.6
0.5
0.4
0.3
0.2
0.1
00.10.20.30.40.50.6
0
.7
0
.
8
0
.
9
1.
0
S4
"S3"
"S2"
S1
0.1220.146
0.1760.155
0.145PPu
fNN
(e
x
p)
(e
x
p)
(ca
l
)(ca
l
)
(cal)
(exp)
V
e
r
suc
h
eS6
-
3
:
0
.122+
0
.14
6
+
0
.17
6
+
0
.1
55
0.122+0.146+0.176+0.145
512328
758405+776794 +768358+547265=2850822
758405+776794 +768358+512328=2815885
0.2380.174
P
max,1
P
max,4
N
1
N
2
N
3
N
4
P
max,4
P
max,4
'P konst.
N
4
N
3
N
2
N
1
P
u,0
P
u,0
PP
GG
A
B
N
2
/ N
f,2
N
3
/ N
f,3
N
4
/ N
f,4
N
1
/ N
f,1
1
1
4
'n
f,1
A
D,B
A
D,A
'A
D,B-A
'n
f,2
'n
f,3
4
N
i
/ N
f,i
0
Fig. 3.166. Damage accumulation in the case of multiple block loading tests with
decreasing peak loads
N
fe
[x 10
6
]
0
12
3
4
567
6
2
1
0
7
3
4
5
N
ft
[x 10
6
]
new damage accumulation rule
predicted lifetimes – single values
experimental results
0
N
fe
[x 10
6
]
6
2
1
N
ft
[x 10
6
]
0
predicted lifetimes – mean values
7
3
4
5
12
3
4
567
1n
N
N
D
if,
if,
i
d'
¦¦
(1)
(3)
(3)
(3)
(4)
(1)
(2)
( ) number of tests
experimental results
Fig. 3.167. Comparison between the test results with the results of the lifetime
prediction according to the improved damage accumulation hypothesis
In Figure 3.167 the comparison of the results of multiple block loading
tests with the theoretical values according the improved damage accumulation
method is illustrated. With the exception of two tests nearly all single values
3.3 Modelling 341
G
u, 0.9 Pu
[mm]
0.2 1.20.4 0.6 0.8 1.0
0
30
20
10
35
25
15
N/ N
f
3
2
1
0.9 P
u
G
u, 0.9Pu
P
P
u
d
4
type A
type B
5
0
type B
type A
P
max
/ P
u,0
= 0.71
P
max
/ P
u,0
0.44
Fig. 3.168. Ductility after high cycle loading
of the test results are well predicted. In these two tests presumably due to
worse compaction of the concrete a larger slip development at the stud feet was
noticed. This shows the importance of the detailing of the shear connection as
given in Eurocode 4 [22, 23]. Looking at similar tests it can be observed that
the prediction matches the mean values leading to a significant improvement
compared with the Palmgren-Miner rule.
3.3.4.2.9 Ductility and Crack Formation
High initial stiffness and high ductility are main advantages of headed studs
embedded in normal weight concrete. From the static tests carried out after
cyclic preloading it could be found, that the load deflection behaviour is sig-
nificantly affected by the crack formation, which is itself closely correlated to
the peak load level. Very high peak loads cause horizontal cracks through the
stud foot like crack type A shown in Figure 3.154. As shown in Figure 3.168
this formation results in a gradual decrease of ductility during lifetime and
the values may fall below the target values of the codes. In the case of lower
peak loads the cracks propagate into the flange like crack type B and ductility
increases. This behaviour is of great importance regarding the capability of
redistribution of shear forces in the interface between steel and concrete of
composite beams subjected to fatigue loading.
3.3.4.2.10 Finite Element Calculations of the (Reduced) Static Strength of
Headed Shear Studs in Push-Out Specimens
The experimental results of the push-out tests can be taken as the basis for
further theoretical investigations regarding the effect of cracks at the stud feet
on the static strength of headed shear studs given in Figure 3.154. As shown
342 3 Deterioration of Materials and Structures
local deformation of concrete and steel at the stud feet at ultimate limit state
with pre-damage (here: crack
of type B at each stud foot)
Distribution of main material properties at the stud feet
1400
1000
600
200
1
23
4
5
1600
1200
800
400
0
67
8
P [kN]
G [mm]
'P
u,FEM
~ 0.26 P
u
P
u
= 1440 kN
FEM
test
f
c
= 30 N/mm² E
cm
= 27960 N/mm²
f
u
= 528 N/mm
f
u
= 235 N/mm
f
u
= 528 N/mm
f
y
= 337 N/mm - f
u
= 448 N/mm
crack pattern
(here: type B)
FEM,uexp,u
GD
D
P30.0P5.0
AA
A
'||'|
without pre-damage
FE-model of a push-out
test specimen (quarter)
crack pattern
(here: type B)
P = 0.2
P = 0.1
E = 210000 N/mm²
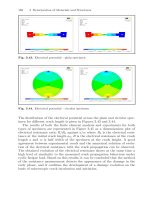
Fig. 3.169. Comparison between test results and finite element calculations of
statically loaded push-out test specimens
in Figure 3.169 for this purpose a comprehensive three-dimensional
FE-Model - using the finite element programme ANSYS - of a statically
loaded push-out test specimen with lateral support of the concrete slabs
according to Figure 3.100 of Chapter 3.2.3 has been built up in order to
simulate he load-deflection behaviour of headed shear studs embedded in
solid slabs without any pre-damage.
Concerning the numerical simulation the material properties of the steel
members and the concrete members are of main interest. So far no detailed
information about the precise material properties of the steel in the heated
affected zones, in the weld collar and in the melted zone at each stud are avail-
able. For this reason the material properties of the steel beam and the studs
(determined by means of tensile tests) were taken as the basis of the material
properties of the steel affected by the welding process. Microscopic examina-
tions of the steel structure at the stud feet given in Figures 3.151 - 3.153 were
performed in order to consider sufficiently the weld formations regarding the
assignment of the main material properties in the FE-model. Metal plastic-
ity behaviour of the steel was simulated by using the von-Mises criterion. The
concrete behaviour was modelled elastic - perfectly plastic taking into account
a yielding surface according to Drucker-Prager (DP) with an associated flow
rule. The two parameters of the DP-yield surface were adjusted to the uni-
axial (1.0 f
c
) and to the biaxial compressive strength (taken as 1.2 f
c
)ofthe
concrete, obtained from concrete cylinders cured at air as the corresponding
test specimens. As shown in Figure 3.153 the weld collar is commonly non