Handbook of Multimedia for Digital Entertainment and Arts- P13 pps
Bạn đang xem bản rút gọn của tài liệu. Xem và tải ngay bản đầy đủ của tài liệu tại đây (563.58 KB, 30 trang )
354 K. Brandenburg et al.
Zero Crossing Rate
The Zerocrossing Rate (ZCR) simply counts the number of changes of the signum
in audio frames. Since the number of crossings depends on the size of the examined
window, the final value has to be normalized by dividing by the actual window size.
One of the first evaluations of the zerocrossing rate in the area of speech recogni-
tion have been described by Licklider and Pollack in 1948 [63]. They described the
feature extraction process and resulted with the conclusion, that the ZCR is use-
ful for digital speech signal processing because it is loudness invariant and speaker
independent. Among the variety of publications using the ZCR for MIR are the
fundamental genre identification paper from Tzanetakis et al. [110] and a paper
dedicated to the classification of percussive sounds by Gouyon [39].
Audio Spectrum Centroid
The Audio Spectrum Centroid (ASC) is another MPEG-7 standardized low-level
feature in MIR [88]. As depicted in [53], it describes the center of gravity of the
spectrum. It is used to describe the timbre of an audio signal. The feature extraction
process is similar to the ASE extraction. The difference between ASC and ASE
is, that the values within the edges of the logarithmically spaced frequency bands
are not accumulated, but the spectrum centroid is estimated. This spectrum centroid
indicates the center of gravity inside the frequency bands.
Audio Spectrum Spread
Audio Spectrum Spread (ASS) is another feature described in the MPEG-7 standard.
It is a descriptor of the shape of the power spectrum that indicates whether it is con-
centrated in the vicinity of its centroid, or else spread out over the spectrum. The
difference between ASE and ASS is, that the values within the edges of the loga-
rithmically spaced frequency bands are not accumulated, but the spectrum spread is
estimated, as described in [53]. The spectrum spread allows a good differentiation
between tone-like and noise-like sounds.
Mid-level Audio Features
Mid-level features ([11]) present an intermediate semantic layer between well-
established low-level features and advanced high-level information that can be
directly understood by a human individual. Basically, mid-level features can be
computed by combining advanced signal processing techniques with a-priori mu-
sical knowledge while omitting the error-prone step of deriving final statements
about semantics of the musical content. It is reasonable to either compute mid-level
16 Music Search and Recommendation 355
features on the entire length of previously identified coherent segments (see section
“Statistical Models of The Song”) or in dedicated mid-level windows that virtu-
ally sub-sample the original slope of the low-level features and squeeze their most
important properties into a small set of numbers. For example, a window-size of
of approximately 5 seconds could be used in conjunction with an overlap of 2.5
seconds. These numbers may seem somewhat arbitrarily chosen, but they should
be interpreted as the most suitable region of interest for capturing the temporal
structure of low-level descriptors in a wide variety of musical signals, ranging from
slow atmospheric pieces to up-tempo Rock music.
Rhythmic Mid-level Features
An important aspect of contemporary music is constituted by its rhythmic content.
The sensation of rhythm is a complex phenomenon of the human perception which
is illustrated by the large corpus of objective and subjective musical terms, such as
tempo, beat, bar or shuffle used to describe rhythmic gist. The underlying principles
to understanding rhythm in all its peculiarities are even more diverse. Nevertheless,
it can be assumed, that the degree of self-similarity respectively periodicity inherent
to the music signal contains valuable information to describe the rhythmic quality
of a music piece. The extensive prior work on automatic rhythm analysis can (ac-
cording to [111]) be distinguished into Note Onset Detection, Beat Tracking and
Tempo Estimation, Rhythmic Intensity and Complexity and Drum Transcription.A
fundamental approach for rhythm analysis in MIR is onset detection, i.e. detection
of those time points in a musical signal which exhibit a percussive or transient event
indicating the beginning of a new note or sound [22]. Active research has been go-
ing on over the last years in the field of beat and tempo induction [38], [96], where
a variety of methods emerged that aim intelligently estimating the perceptual tempo
from measurable periodicities. All previously described areas result more or less
into a set of high-level attributes. These attributes are not always suited as features
in music retrieval and recommendation scenarios. Thus, a variety of different meth-
ods for extraction of rhythmic mid-level features is described either frame-wise [98],
event-wise[12] or beat-wise [37]. One important aspect of rhythm are rhythmic pat-
terns, which can be effectively captured by means of an auto-correlation function
(ACF). In [110], this is exploited by auto-correlating and accumulating a number of
successive bands derived from a Wavelet transform of the music signal. An alterna-
tive method is given in [19]. A weighted sum of the ASE-feature serves a so called
detection function and is auto-correlated. The challenge is to find suitable distance
measures or features, that can further abstract from the raw ACF-functions, since
they are not invariant to tempo changes.
Harmonic Mid-level Features
It can safely be assumed that the melodic and harmonic structures in music are
a very important and intuitive concept to the majority of human listeners. Even
356 K. Brandenburg et al.
non-musicians are able to spot differences and similarities of two given tunes. Sev-
eral authors have addressed chroma vectors, also referred to as harmonic pitch class
profiles [42] as a suitable tool for describing the harmonic and melodic content of
music pieces. This octave agnostic representation of note probabilities can be used
for estimation of the musical key, chord structure detection [42] and harmonic com-
plexity measurements. Chroma vectors are somewhat difficult to categorize, since
the techniques for extraction are typical low-level operations. But the fact that they
already take into account the 12-tone scale of western tonal music places them half-
way between low-level and mid-level. Very sophisticated post-processing can be
performed on the raw chroma-vectors. One area of interest is the detection and align-
ment of cover-songs respectively classical pieces performed by different conductors
and orchestras. Recent approaches are described in [97] and [82], both works are
dedicated to matching and retrieval of songs that are not necessarily identical in
terms of their progression of their harmonic content.
A straightforward approach to use chroma features is the computation of different
histograms of the most probable notes, intervals and chords that occur through-
out a song ([19]). Such simple post-processing already reveals a lot of information
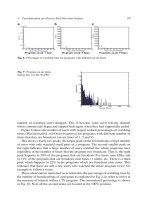
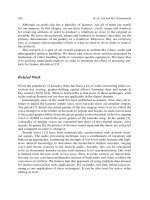
contained in the songs. As an illustration, Figure 3 shows the comparison of chroma-
based histograms between the well known song “I will survive” by “Gloria Gaynor”
and three different renditions of the same piece by the artists “Cake”, “Nils Land-
gren” and “Hermes House Band” respectively. The shades of gray in the background
indicate the areas of the distinct histograms. Some interesting phenomena can be ob-
served when examining the different types of histograms. First, it can be seen from
the chord histogram (right-most), that all four songs are played in the same key. The
interval histograms (2nd and 3rd from the left) are most similar between the first
Gloria Gaynor − I will survive
0
0.2
0.4
Cake − I will survive
0
0.2
0.4
Nils Landgren − I will survive
0
0.2
0.4
Hermes House Band − I will survive
Probability of Notes, Intervals and Chords
0
0.2
0.4
Fig. 3 Comparison of chroma-based histograms between cover songs
16 Music Search and Recommendation 357
and the last song, because the last version stays comparatively close to the original.
The second and the third song are somewhat sloppy and free interpretations of the
original piece. Therefore, their interval statistics are more akin.
High-level Music Features
High-level features represent a wide range of musical characteristics, bearing a close
relation to musicological vocabulary. Their main design purpose is the development
of computable features being capable to model the music parameters that are ob-
servable by musicologists (see Figure 1) and that do not require any prior knowledge
about signal-processing methods. Some high-level features are abstracted from fea-
tures on a lower semantic level by applying various statistical pattern recognition
methods. In contrast, transcription-based high-level features are directly extracted
from score parameters like onset, duration and pitch of the notes within a song,
whose precise extraction itself is a crucial task within MIR. Many different algo-
rithms for drum [120], [21], bass [92], [40], melody [33], [89] and harmony [42]
transcription have been proposed in the literature, achieving imperfect but remark-
able detection rates so far. Recently, the combination of transcription methods for
different instrument domains has been reported in [20] and [93]. However, model-
ing the ability of musically skilled people to accurately recognize, segregate and
transcribe single instruments within dense polyphonic mixtures still bears a big
challenge.
In general, high-level features can be categorized according to different musical
domains like rhythm, harmony, melody or instrumentation. Different approaches
for the extraction of rhythm-related high-level features have been reported. For in-
stance, they were derived from genre-specific temporal note deviations [36](the
so-called swing ratio), from the percussion-related instrumentation of a song [44]
or from various statistical spectrum descriptors based on periodic rhythm patters
[64]. Properties related to the notes of single instrument tracks like the dominant
grid (e.g. 32th notes), the dominant feeling (down- or offbeat), the dominant char-
acteristic (binary or ternary) as well as a measure of syncopation related to different
rhythmical grids can be deduced from the Rhythmical Structure Profile ([1]). It pro-
vides a temporal representation of all notes that is invariant to tempo and the bar
measure of a song. In general, a well-performing estimation of the temporal posi-
tions of the beat-grid points is a vital pre-processing step for a subsequent mapping
of the transcribed notes onto the rhythmic bar structure of a song and thereby for a
proper calculation of the related features.
Melodic and harmonic high-level features are commonly deduced from the
progression of pitches and their corresponding intervals within an instrument
track. Basic statistical attributes like mean, standard deviation, entropy as well as
complexity-based descriptors are therefore applied ([25], [78], [74] and [64]).
Retrieval of rhythmic and melodic repetitions is usually achieved by utilizing
algorithms to detect repeating patterns within character strings [49]. Subsequently,
358 K. Brandenburg et al.
each pattern can be characterized by its length, incidence rate and mean temporal
distance ([1]). These properties allow the computation of the pattern’s relevance as a
measure for the recall value to the listener by means of derived statistical descriptors.
The instrumentation of a song represents another main musical characteristic which
immediately affects the timbre of a song ([78]). Hence, corresponding high-level
features can be derived from it.
With all these high-level features providing a big amount of musical information,
different classification tasks have been described in the literature concerning meta-
data like the genre of a song or its artist. Most commonly, genre classification is
based on low- and mid-level features. Only a few publications have so far addressed
this problem solely based on high-level features. Examples are [78], [59] and [1],
hybrid approaches are presented in [64]. Apart from different classification meth-
ods, some major differences are the applied genre taxonomies as well as the overall
number of genres.
Further tasks that have been reported to be feasible with the use of high-level
features are artist classification ([26], [1]) and expressive performance analysis
([77], [94]). Nowadays, songs are mostly created by a blending of various musical
styles and genres. Referring to a proper genre classification, music has to be seen
and evaluated segment-wise. Furthermore, the results of an automatic song segmen-
tation can be the source of additional high-level features characterizing repetitions
and the overall structure of a song.
Statistical Modeling and Similarity Measures
Nearly all state-of-the-art MIR systems use low-level acoustic features calculated in
short time frames as described in Section “Low-level Audio Features”. Using these
raw features results in an K N dimension feature matrix X per song, where K
is the number of the time frames in the song, and N is the number of feature di-
mensions. Dealing with this amount of raw data is computationally very inefficient.
Additionally, the different elements of the feature vectors could appear strongly cor-
related and cause information redundancy.
Dimension Reduction
One of the usual ways to suppress redundant information in the feature matrix is uti-
lization of dimension reduction techniques. Their purpose is to decrease the number
of feature dimension N while keeping or even revealing the most characteristic data
properties. Generally, all dimension reduction methods can be divided into super-
vised and unsupervised ones. Among the unsupervised approaches the one most
often used is Principal Component Analysis (PCA). The other well-established un-
supervised dimension reduction method is Self-Organizing Maps (SOM), which is
often used for visualizing the original high-dimensional feature space by mapping
16 Music Search and Recommendation 359
it into a two dimensional plane. The most often used supervised dimension reduc-
tion method is Linear Discriminant Analysis (LDA), it is successfully applied as a
pre-processing for audio signal classification.
Principal Component Analysis
The key idea of PCA [31] is to find a subspace whose basis vectors correspond
to the maximum-variance directions in the original feature space. PCA involves
an expansion of the feature matrix into the eigenvectors and eigenvalues of its
covariance matrix, this procedure is called the Karhunen Lo´eve expansion.IfX is
the original feature matrix, then the solution is obtained by solving the eigensystem
decomposition
i
v
i
DCv
i
, where C is a covariance matrix of X, and
i
and v
i
are
the eigenvalues and eigenvectors of C. The column vectors v
i
form the PCA trans-
formation matrix W. The mapping of original feature matrix into new feature space
is obtained by the matrix multiplication Y DX W. The amount of information of
each feature dimension (in the new feature space) is determined by the correspond-
ing eigenvalue. The larger the eigenvalue the more effective the feature dimension.
Dimension reduction is obtained by simply discarding the column vectors v
i
with
small eigenvalues
i
.
Self-Organizing Maps
SOM are special types of artificial neural networks that can be used to gener-
ate a low-dimensional, discrete representation of a high-dimensional input feature
space by means of unsupervised clustering. SOM differ from conventional artificial
neural networks because they use a neighborhood function to preserve the topo-
logical properties of the input space. This makes SOM very useful for creating
low-dimensional views of high-dimensional data, akin to multidimensional scaling
(MDS). Like most artificial neural networks, SOM need training using input exam-
ples. This process can be viewed as vector quantization. As will be detailed later
(see 16), SOM are suitable for displaying music collections. If the size of the maps
(the number of neurons) is small compared to the number of items in the feature
space, then the process essentially equals k-means clustering. For the emergence of
higher level structure, a larger so-called Emergent SOM (ESOM) is needed. With
larger maps a single neuron does not represent a cluster anymore. It is rather an
element in a highly detailed non-linear projection of the high dimensional feature
space to the low dimensional map space. Thus, clusters are formed by connected
regions of neurons with similar properties.
Linear Discriminant Analysis
LDA [113] is a widely used method to improve the separability among classes while
reducing the feature dimension. This linear transformation maximizes the ratio of
360 K. Brandenburg et al.
between-class variance to the within-class variance guaranteeing a maximal sepa-
rability. The resultant N N matrix T is used to map an N -dimensional feature
row vector x into the subspace y by a multiplication. Reducing the dimension of the
transformed feature vector y from N to D is achieved by considering only the first
D column vectors of T (now N D) for multiplication.
Statistical Models of The Song
Defining a similarity measure between two music signals which consist of multi-
ple feature frames still remains a challenging task. The feature matrices of different
songs can be hardly compared directly. One of the first works on music similarity
analysis [30] used MFCC as a feature, and then applied a supervised tree-structured
quantization to map the feature matrices of every song to the histograms. Logan
and Salomon [71] used a song signature based on histograms derived by unsuper-
vised k-means clustering of low-level features. Thus, the specific song character-
istics in the compressed form can be derived by clustering or quantization in the
feature space. An alternative approach is to treat each frame (row) of the feature
matrix as a point in the N -dimensional feature space. The characteristic attributes
of a particular song can be encapsulated by the estimation of the Probability Density
Function (PDF) of these points in the feature space. The distribution of these points
is a-priori unknown, thus the modeling of the PDF has to be flexible and adjustable
to different levels of generalization. The resulting distribution of the feature frames
is often influenced by the various underlying random processes. According to the
central limit theorem, the vast class of acoustic features tends to be normally dis-
tributed. The constellation of these factors leads to the fact, that already in the early
years of MIR the Gaussian Mixture Model (GMM) became the commonly used sta-
tistical model for representing a feature matrix of a song [69], [6]. Feature frames
are thought of as generated from various sources and each source is modeled by a
single Gaussian. The PDF p.x j / of the feature frames is estimated as a weighted
sum of the multivariate normal distributions:
p.x j / D
M
X
iD1
!
i
1
.2/
N=2
j
˙
j
1=2
exp
Â
1
2
.x
i
/
T
˙
1
i
.x
i
/
Ã
(1)
The generalization properties of the model can be adjusted by choosing the number
of Gaussian mixtures M . Each single i-th mixture is characterized by its mean vec-
tor
i
and covariance matrix ˙
i
. Thus, a GMM is parametrized in D
f
!
i
;
i
;˙
i
g,
i D1; M , where !
i
is the weight of the i -th mixtures and
P
i
!
i
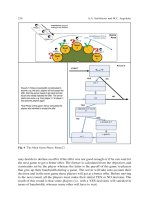
D1. A schematic
representation of a GMM is shown in Figure 4. The parameters of the GMM can
be estimated using the Expectation-Maximization algorithm [18]. A good overview
of applying various statistical models (ex. GMM or k-means) for music similarity
search is given in [7].
16 Music Search and Recommendation 361
Fig. 4 Schematic
representation of Gaussian
Mixture Model
The approach of modeling all frames of a song with a GMM is often referred
as a “bag-of-frames” approach [5]. It encompasses the overall distribution, but the
long-term structure and correlation between single frames within a song is not taken
into account. As a result, important information is lost. To overcome this issue,
Tzanetakis [109] proposed a set of audio features capturing the changes in the mu-
sic “texture”. For details on mid-level and high-level audio features the reader is
referred to the Section “Acoustic Features for Music Modeling”.
Alternative ways to express the temporal changes in the PDF are proposed in
[28]. They compared the effectiveness of GMM to Gaussian Observation Hidden
Markov Models (HMM). The results of the experiment showed that HMM better
describe the spectral similarity of songs than the standard technique of GMM. The
drawback of this approach is a necessity to calculate the similarity measure via log-
likelihood of the models.
Recently, another approach using semantic information about song segmenta-
tion for song modeling has been proposed in [73]. Song segmentation implies a
time-domain segmentation and clustering of the musical piece in possibly repeat-
able semantically meaningful segments. For example, the typical western pop song
can be segmented into “intro”, “verse”, “chorus”, “bridge”, and “outro” parts. For
similar songs not all segments might be similar. For the human perception, the songs
with similar “chorus” are similar. In [73], application of a song segmentation al-
gorithm based on the Bayesian Information Criterion (BIC) has been described.
BIC has been successfully applied for speaker segmentation [81]. Each segment
state (ex. all repeated “chorus” segments form one segment state) are modeled with
one Gaussian. Thus, these Gaussians can been weighted in a mixture depending on
the durations of the segment states. Frequently repeated and long segments achieve
higher weights.
Distance Measures
The particular distance measure between two songs is calculated as a distance be-
tween two song models and therefore depends on the models used. In [30]the
362 K. Brandenburg et al.
distance between histograms was calculated via Euclidean distance or Cosine dis-
tance between two vectors. Logan and Salomon [71] adopted the Earth mover’s
distance (EMD) to calculate the distance between k-means clustering models.
The straight forward approach to estimate the distance between the song mod-
eled by GMM or HMM is to rate the log-likelihood of feature frames of one song
by the models of the others. Distance measures based on log-likelihoods have been
successfully used in [6] and [28]. The disadvantage of this method is an over-
whelming computational effort. The system does not scale well and is hardly usable
in real-world applications dealing with huge music archives. Some details to its
computation times can be found in [85].
If a song is modeled by parametric statistical model, such as GMM, a more
appropriate distance measure between the models can be defined based on the pa-
rameters of the models. A good example of such parametric distance measure is
a Kullback-Leibler divergence (KL-divergence) [58], corresponding to a distance
between two single Gaussians:
D.f kg/ D
1
2
Â
log
j˙
g
j
j˙
f
j
CTr
˙
1
g
˙
f
C
f
g
T
˙
1
g
f
g
N
Ã
(2)
where f and g are single Gaussians with the means
f
and
g
and covariance
matrices ˙
f
and ˙
g
correspondingly, and N is the dimensionality of the feature
space. Initially, KL-divergence is not symmetric and needs to be symmetrized
D
2
.f
a
kg
b
/ D
1
2
ŒD.f
a
kg
b
/ CD.g
b
kf
a
/ : (3)
Unfortunately, the KL-divergence for two GMM is not analytically tractable. Para-
metric distance measures between two GMM can be expressed by several approxi-
mations, see [73] for an overview and comparison.
“In the Mood” – Towards Capturing Music Semantics
Automatic semantic tagging comprises methods for automatically deriving mean-
ingful and human understandable information from the combination of signal pro-
cessing and machine learning methods. Semantic information could be a description
of the musical style, performing instruments or the singer’s gender. There are dif-
ferent approaches to generate semantic annotations. Knowledge based approaches
focus on highly specific algorithms which implement a concrete knowledge about a
specific musical property. In contrast, supervised machine learning approaches use
a large amount of audio features from representative training examples in order to
implicitely learn the characteristics of concrete categories. Once trained, the model
for a semantic category can be used to classify and thus to annotate unknown music
content.
16 Music Search and Recommendation 363
Classification Models
There are two general classification approaches, a generative and a discriminative
one. Both allow to classify unlabeled music data into different semantic categories
with a certain probability, that depends on the training parameters and the under-
lying audio features. Generative probabilistic models describe how likely a song
belongs to a certain pre-defined class of songs. These models form a probability
distribution over the classes’ features, in this case over the audio features presented
in Section “Acoustic Features for Music Modeling”, for each class. In contrast, dis-
criminative models try to predict the most likely class directly instead of modeling
the class’ conditional probability densities. Therefore, the model learns boundaries
between different classes during the training process and uses the distance to the
boundaries as an indicator for the most probable class. Only two classifiers that
are most often used in MIR will be detailed here, since space is not enough to de-
scribe the large number of classification techniques which has been introduced in
the literature.
Classification Based on Gaussian Mixture Models
Apart from song modeling described in 16, GMM are successfully used for proba-
bilistic classification because they are well suited to model large amounts of training
data per class. One interprets the single feature vectors of a music item as random
samples generated by a mixture of multivariate Gaussian sources. The actual clas-
sification is conducted by estimating which pre-trained mixture of Gaussians has
most likely generated the frames. Thereby, the likelihood estimate serves as some
kind of confidence measure for the classification.
Classification Based on Support Vector Machines
A support vector machine (SVM) attempts to generate an optimal decision margin
between feature vectors of the training classes in an N -dimensional space ([15]).
Therefore, only a part of the training samples is taken into account called support
vectors. A hyperplane is placed in the feature space in a manner that the distance
to the support vectors is maximized. SVM have the ability to well generalize data
actually in the case of few training samples. Although the SVM training itself is
an optimization process, it is common to accomplish a cross validation and grid
search to optimize the training parameters ([48]). This can be a very time-consuming
process, depending on the number of training samples.
In most cases classification problems are not linear separable in the actual fea-
ture space. Transformed into a high-dimensional space, non-linear classification
problems can become linear separable. However, higher dimensions deal with an
increase of the computation effort. To overcome this problem, the so called kernel
trick is used to get non-linear problems separable, although the computation can
364 K. Brandenburg et al.
be performed in the origin feature space ([15]). The key idea of the kernel trick is
to replace the dot product in a high-dimensional space with a kernel function in a
original feature space.
Mood Semantics
Mood as an illustrative example for semantic properties describes a more subjective
information which correlates not only to the music impression but also to individ-
ual memories and different music preferences. Furthermore, we need a distinction
between mood and emotion. Emotion describes an affective perception in a short
time frame, whereas mood describes a deeper perception and feeling. In the MIR
community sometimes both terms are used for the same meaning. In this article the
term mood is used to describe the human oriented perception of music expression.
To overcome the subjective impact, generative descriptions of mood are needed
to describe the commonality of different user’s perception. Therefore, mood char-
acteristics are formalized in mood models which describe different peculiarities of
the property “mood”.
Mood Models
Mood models can be categorized into category-based and dimension-based descrip-
tions. Furthermore, combinations of both descriptions are defined to combine the
advantages of both approaches. The early work on music expression concentrates
on category based formalization e.g. Hevner’s adjective circle [45] as depicted in
Fig. 5(a). Eight groups of adjectives are formulated whereas each group describes
valence
aggressive
dramatic
agitated
euphoric
happy
playful
calm
soothing
dreamy
melancholy
sad
depressing
merry
joyous
gay
happy
cheerful
bright
humorous
playful
whimsical
fanciful
quaint
spreghtly
delicate
light
graceful
lyrical
leisurely
satisfying
serene
tranquil
quiet
soothing
dreamy
yielding
tender
sentimental
langing
yearning
pleading
plaintive
pathetic
doleful
sad
mournful
tragic
melancholy
frustrated
depressing
gloomy
heavy
dark
spiritual
lofty
awe-inspiring
dignified
sacred
solemn
sober
serious
vigorous
robust
emphatic
martial
ponderouse
majestic
exalting
exhilarated
soaring
triumphant
dramatic
passionate
agitated
exciting
impetuous
restless
arousal
(1)
(2)
(3)
(4)
(5)
(6)
(7)
(8)
a
b
Fig. 5 Category and Dimension based Mood Models based on [45]
16 Music Search and Recommendation 365
a category or cluster of mood. All groups are arranged on a circle and neighbored
groups are consisting of related expressions. The variety of adjectives in each group
gives a better representation of the meaning of each group and depicts the different
user perceptions. Category based approaches allow the assignment of music items
into one or multiple groups which results in a single- or multi-label classification
problem.
The dimension based mood models focus on the description of mood as a point
within a multi-dimensional mood space. Different models based on dimensions such
as valence, arousal, stress, energy or sleepiness are defined. Thayers model [103]
describes mood as a product of the dimensions energy and tension. Russels circum-
plex model [91] arrange the dimensions pleasantness, excitement, activation and
distress in a mood space with 45
ı
dimension steps. As base of its model, Russel
defines the dimensions pleasantness and activation. The commonality of different
theories on dimension based mood descriptions is the base on moods between pos-
itive and negative (valence) and intensity (arousal) as depicted in Fig. 5(b). The
labeled area in Fig. 5(b) shows the affect area which was evaluated in physiological
experiments as the region that equates a human emotion [41]. Mood models that
combine categories and dimensions, typically place mood adjectives in a region of
the mood space, e.g. the Tellegen-Watson-Clark model [102]. In [23] the valence
and arousal model is extend with mood adjectives for each quadrant, to give a tex-
tual annotation and dimensional assignment of music items.
Mood Classification
Scientific publications on mood classification use different acoustic features to
model different mood aspects, e.g. timbre based features for valence and tempo
and rhythmic features for high activation.
Feng et al. [27] utilize an average silence ratio, whereas Yang et al. [117]usea
beats per minute value for the tempo description. Lu et al. [72] incorporate various
rhythmic features such as rhythm strength, average correlation peak, average tempo
and average onset frequency. Beyond others Li [62] and Tolos [105] use frequency
spectrum based features (e.g. MFCC, ASC, spectral flux or spectral rolloff) to de-
scribe the timbre and therewith the valence aspect of music expression. Furthermore,
Wu and Jeng [116] setup a complex mixture of a wide range of acoustical features
for valence and arousal expression: rhythmic content, pitch content, power spectrum
centroid, inter-channel cross correlation, tonality, spectral contrast and Daubechies
wavelet coefficient histograms.
Next to the feature extraction process the introduced machine learning algorithms
GMM and SVM are often utilized to train and classify music expression. Examples
for GMM based classification approaches are Lu [72] and Liu [68]. Publications that
focus on the discriminative SVM approach are [61, 62, 112, 117]. In [23] GMM and
SVM classifiers are compared with a slightly better result of the SVM approach. Liu
et al. [67] utilize a nearest-mean classifier. Trohidis et al. [107] compare different
multi-label classification approaches based on SVM and k-nearest neighbor.
366 K. Brandenburg et al.
One major problem of the comparison of different results for mood and other
semantic annotations is the lack on a golden standard for test data and evaluation
method. Most publication use an individual test set or ground-truth. A specialty of
Wu and Jeng’s approach [116] is based on the use of mood histograms in the ground
truth and the results beeing compared by a quadratic-cross-similarity, which leads
to a complete different evaluation method then a single label annotation.
A first international comparison of mood classification algorithms was performed
on the MIREX 2007 in the Audio Music Mood Classification Task. Hu et al.[50]
presented the results and lessons learned from the first benchmark. Five mood clus-
ters of music were defined as ground truth with a single label approach. The best
algorithm reach an average accuracy in a three cross fold evaluation of about 61 %.
Music Recommendation
There are several sources to find new music. Record sales are summarized in music
charts, the local record dealers are always informed about new releases, and radio
stations keep playing music all day long (and might once in a while focus on a
certain style of music which is of interest for somebody). Furthermore, everybody
knows friends who share the same musical taste. These are some of the typical ways
how people acquire recommendations about new music. Recommendation is rec-
ommending items (e.g., songs) to users. How is this performed or (at least) assisted
by computing power?
There are different types of music related recommendations, and all of them use
some kind of similarity. People that are searching for albums might profit from
artist recommendations (artists who are similar to those these people like). In song
recommendation the system is supposed to suggest new songs. Playlist generation
is some kind of song recommendation on the local database. Nowadays, in times of
the “social web”, neighbor recommendation is another important issue, in which the
system proposes other users of a social web platform to the querying person - users
with a similar taste of music.
Automated systems follow different strategies to find similar items[14].
Collaborative Filtering. In collaborative filtering (CF), systems try to gain infor-
mation about similarity of items by learning past user-item relationships. One
possible way to do this is to collect lots of playlists of different users and then
suggesting songs to be similar, if they appear together in many of these playlists.
A major drawback is the cold start for items. Songs that are newly added to
a database do not appear in playlists, so no information about them can be col-
lected. Popular examples for CF recommendation are last.fm
1
and amazon.com
2
.
1
2
16 Music Search and Recommendation 367
Content-Based Techniques. In the content-based approach (CB), the content of
musical pieces is analyzed, and similarity is calculated from the descriptions as
result of the content analysis. Songs can be similar if they have the same timbre
or rhythm. This analysis can be done by experts (e.g., Pandora
3
) , which leads to
high quality but expensive descriptions, or automatically, using signal process-
ing and machine learning algorithms (e.g., Mufin
4
). Automatic content-based
descriptors cannot yet compete with manually derived descriptions, but can be
easily created for large databases.
Context-Based Techniques. By analyzing the context of songs or artists, similari-
ties can also be derived. For example, contextual information can be acquired as a
result of web-mining (e.g., analyzing hyperlinks between artist homepages) [66],
or collaborative tagging [100].
Demographic Filtering Techniques. Recommendations are made based on clus-
ters that are derived from demographic information, e.g. “males at your age from
your town, who are also interested in soccer, listen to ”.
By combining different techniques to hybrid systems, drawbacks can be compen-
sated, as described in [95], where content-based similarity is used to solve the item
cold start of a CF system.
A very important issue within recommendation is the user. In order to make per-
sonalized recommendations, the system has to collect information about the musical
taste of the user and contextual information about the user himself. Two questions
arise: How are new user profiles initialized (user cold start), and how are they main-
tained? The user cold start can be handled in different ways. Besides starting with a
blank profile, users could enter descriptions of their taste by providing their favorite
artists or songs, or rating some exemplary songs. Profile maintenance can be per-
formed by giving feedback about recommendations in an explicit or implicit way.
Explicit feedback includes rating of recommended songs, whereas implicit feedback
includes information of which song was skipped or how much time a user spent on
visiting the homepage of a recommended artist.
In CB systems, recommendations can be made by simply returning the most sim-
ilar songs (according to computed similarity as described in 16) to a reference song.
This song, often called “seed song” represents the initial user profile. If we just use
equal weigths of all features, the same seed song will always result in the same rec-
ommendations. However, perceived similarity between items may vary from person
to person and situation to situation. Some of the acoustic features may be more
important than others, therefore the weighting of the features should be adjusted
according to the user, leading to a user-specific similarity function.
Analyzing user interaction can provide useful information about the user’s pref-
erences and needs. It can be given in a number of ways. In any case, usability issues
should be taken into account. An initialization of the user profile by manually label-
ing dozens of songs is in general not reasonable. In [10], the music signal is analyzed
3
4
fin.com
368 K. Brandenburg et al.
with respect to semantically meaningful aspects (e.g., timbre, rhythm, instrumen-
tation, genre etc.). These are grouped into domains and arranged in an ontology
structure, which can be very helpful for providing an intuitive user interface. The
user now has the ability to weight or disable single aspects or domains to adapt the
recommendation process to his own needs. For instance, similarities between songs
can be computed by considering only rhythmic aspects. Setting the weights of as-
pects or domains by for example adjusting the corresponding sliders is another way
to initialize a user profile.
The settings of weights can also be accomplished by collecting implicit or ex-
plicit user feedback. Implicit user interaction can be easily gathered by, e.g., tracing
the user’s skipping behavior ([86], [115]). The recommendation system categorizes
already recommended songs as disliked songs, not listened to, or liked songs. By
this means, one gets three classes of songs: songs the user likes, songs the user
dislikes and songs, that have not yet been rated and therefore lack a label. Ex-
plicit feedback is normally collected in form of ratings. Further information can
be collected explicitly by providing a user interface, in which the user can arrange
already recommended songs in clusters, following his perception of similarity. Ma-
chine learning algorithms can be used to learn the “meaning” behind these clusters
and classify unrated songs following the same way. This is analogous to 16, where
semantic properties are learned from exemplary songs clustered in classes. In [76],
explicit feedback is used to refine the training data. An SVM classifier is used for
classification. The user model, including seed songs, domain weighting or feed-
back information, can be interpreted as a reflection of the user’s musical taste. The
primary use is to improve the recommendations. Now songs are not further recom-
mended solely based on a user-defined song, instead the user model is additionally
incorporated into the recommendation process. Besides, the user model can also
serve as a base for neighbor recommendation in a social web platform.
Recommendation algorithms should be evaluated according to their usefulness
for an individual, but user-based evaluations are rarely conducted since they require
a lot of user input. Therefore, large scale evaluations are usually based on similarity
analysis (derived from genre similarities) or the analysis of song similarity graphs.
In one of the few user-based evaluations [14] is shown that CF recommendations
score better in terms of relevance, while CB recommendations have advantages re-
garding to novelty. The results of another user-based evaluation [75] supports the
assumption that automatic recommendations are yet behind the quality of human
recommendations.
The acceptance of a certain technique further depends on the type of user. Peo-
ple who listen to music, but are far from being music fanatics (about 3/4 of the
16-45 year old, the so called “Casuals” and “Indifferents”, see [54]) will be fine
with popular recommendations from CF systems. By contrast the “Savants”, for
which “Everything in life seems to be tied up with music” ([54]) might be bored
when they want to discover new music.
Apart from that, hybrid recommender systems, which combine different tech-
niques and therefore are able to compensate for some of the drawbacks of a
standalone approach, have the largest potential to provide good recommendations.
16 Music Search and Recommendation 369
Visualizing Music for Navigation and Exploration
With more and more recommendation systems available, there is a need to visualize
the similarity information and to let the user explore large music collections. Often
an intuitively understandable metaphor is used for exploration. As already illustrated
in Section “Music Recommendation”, there are several ways to obtain similarities
between songs. The visualization of a music archive is independent from the way
the similarity information was gathered from the recommenders. There exist visu-
alization interfaces that illustrate content-based, collaborative-based or web-based
similarity information or that combine different sources for visualization.
This section deals with approaches and issues for music visualization. First, a
brief overview of visualizing musical work is given. The next subsection deals with
visualizing items in music archives followed by a description of browsing capabili-
ties in music collections.
Visualization of Songs
Early work on visualizing songs was performed by [29]. Self-similarity matrices
are used to visualize the time structure in music. Therefore, the acoustic similarity
between any two instances of a musical piece is computed and plotted as a two-
dimensional graph. In [65], Lillie proposes a visualization technique based on
acoustic features for the visualization of song structure. The acoustic features are
computed based on the API of EchoNest
5
. In the 2-dimensional plot, the x-axis rep-
resents the time of the song and the y-axis the chroma indices. Additionally, the
color encodes the timbre of the sound. An example is given in Figure 6. The acous-
tic features for the Moonlight Sonata of Beethoven are displayed on the left and the
song Cross the Breeze from Sonic Youth is displayed on the right.
Fig. 6 Visualizing the structure of songs. Left: Visualization of the Moonlight Sonata of
Beethoven, Right: Visualization of the song Cross the Breeze from Sonic Youth (http://www.
flyingpudding.com/projects/viz music/)
5
/>370 K. Brandenburg et al.
In [118], Yoshii et al. propose the visualization of acoustic features through im-
age thumbnails to let the user guess the music content through the appearance of the
thumbnail and decide if he wants to listen to it. The mapping between the acoustical
space and the visual space is performed via an optimization method, additionally
taking some constraints into account. Hiraga et al. [47] propose a 3-D visualiza-
tion technique for MIDI data. They visualize the performance of musical pieces by
focusing on the musical expression like articulation, tempo, dynamic change and
structure information. For further reading, the interested reader is referred to [52],
where an overview of visualization techniques for musical work with MIR methods
is given.
Most work done in song visualization is independent of the work performed in
visualization of music archives. From the next subsection it becomes apparent, that
visualization of music archives mainly concentrates on the arrangement of songs
in the visualization space. One main focus is to realize the paradigm of closeness
encodes similarity rather than a sophisticated visualization of the song itself. Nev-
ertheless one has to keep in mind that music archives consist of songs. Combined
visualization techniques that also stress the musical characteristics of each song in
a music archive are still an open research issue.
Visualization of Music Archives
The key point when visualizing music archives is how to map the multidimensional
space of music features per song to a low dimensional visualization space.Usu-
ally a 2-D plot or a 3-D space are used as visualization spaces. The placement of a
song in the visualization space is depending on the similarity of this song to neigh-
bored songs. Therefore a mapping of the acoustic features to a spatial distance is
performed. For the user it is intuitive and easy to understand that closely positioned
songs have similar characteristics. Next to the placement of the songs in this visu-
alization space, additional features can be encoded via the color or the shape of the
song icon.
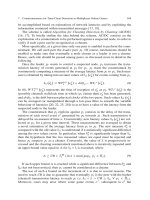
Islands of Music [87] is a popular work for visualizing music archives. The sim-
ilarities are calculated with content-based audio features and organized in a SOM.
Continents and islands in the geographic map represent genres. The MusicMiner
system [80] uses ESOM to project the audio features onto a topographic map. An
example is illustrated in Figure 7.
Kolhoff et al. [57] use glyphs to represent each song based on its content. The
songs are projected into a 2-D space by utilizing a PCA for dimension reduction
with a special weighting and relaxation for determining the exact position. Also in
[84], a PCA is used to determine the three most important principal components
and project the feature vectors onto the three resulting eigenvectors. The feature
vectors are deskewed and the resulting vectors are reduced to two dimensions via a
second PCA. Torrens et al. [106] propose different visualization approaches based
on metadata. Interesting is their disc visualization. Each sector of the disc represents
16 Music Search and Recommendation 371
Fig. 7 MusicMiner: 700 songs are represented as colored dots
a different genre. The songs are mapped to the genres while tracks in the middle are
the oldest. They use this visualization technique to visualize playlists.
Requirements for the visualization of music archives are the scalability to large
numbers of songs and computational complexity. Even for music archives contain-
ing hundreds of thousands of songs, the algorithm has to be able to position every
song in the visualization space quickly.
Navigation and Exploration in Music Archives
Digital music collections are normally organized in folders, sorted corresponding
to artists or genres, forcing the user to navigate through the folder hierarchy to
find songs. They only allow for a text-based browsing in the music collection. A
completely different paradigm for exploring music collections is the comprehen-
sive search for similar music by browsing through a visual space. In this section,
a short review about navigation and browsing capabilities is given. There are some
overlaps to the section about visualization of music archives since most visualiza-
tion scenarios also offer a browsing possibility. Here the focus is on approaches that
concentrate more on browsing.
A popular method is the use of metaphors as underlying space for visualization.
A metaphor provides an intuitive access for the user and an immediate understand-
ing of the dimensions. There were already examples of geographic metaphors in
the previous section. In [35] the metaphor of a world of music is used. The au-
thors focus on compactly representing similarities rather than on visualization. The
similarities are obtained with collaborative filtering methods, a graph from pair-
wise similarities is constructed and mapped to Euclidean space while preserving
distances. [46]usesaradar system to visualize music. Similar songs are located
372 K. Brandenburg et al.
closely to each other and the eight directions from the radial plot denote different
oppositional music characteristics like calm vs. turbulent or melodic vs. rhythmic.
The actual chosen song is placed in the middle of the radar. MusicBox is a music
browser that organizes songs in a 2D-space via a PCA on the music features [65]. It
combines browsing techniques, visualization of music archives and visualization of
the song structure in one application.
In Figure 8 we show an example of the metaphor stars universe. The 2-D uni-
verse is representing the musical space and stars are acting as visual entities for the
songs. The user can navigate through this universe finding similar songs arranged
closely to each other, sometimes even in star concentrations. The visualization space
is subdivided into several semantic regions. On the x-axis there are the rhythmic
characteristics from slow to fast subdivided in five gradations and the y-axis con-
tains the instrument density from sparse to full in three gradations. To position a
song in the universe, a similarity query on a rhythmic and an instrument density
reference set is performed. Each reference set contains the feature vectors of three
songs per gradation. For both reference sets the winning song determines the subre-
gion in the visualization space, the rhythmic one for the x-axis and the other for the
y-axis. The exact position in the subregion is influenced by locally translating each
song in the subspace in dependence from the mean and standard deviations of the
song positions belonging to the same region (cp. [84]).
A quite different approach is performed in [9]. Here, the collaging technique,
emerged from the field of digital libraries, is used to visualize music archives and
enable browsing based on metadata. Other research focuses on visualizing music
archives on mobile devices, e.g., [83]. In [17] a music organizer and browser for
children is proposed. The authors stress the needs from children for music browsing
and provide a navigation software.
Fig. 8 Semantic browsing in a stars universe. The x-axis encodes the rhythm of the songs and the
y-axis the instrument density. For illustration purposes the semantic regions are marked in yellow
16 Music Search and Recommendation 373
Summary and Open Issues
We presented a number of approaches for visualizing the song structure, music
archives and browsing. They all offer the user a different insight into his music
collection and allow for a discovery of new, unknown songs, that match to the pref-
erences of the user. The main drawback of visualization and browsing methods that
project the high-dimensional feature space of acoustic features into a low (2-D or
3-D) visualization space with dimension reduction methods, is the lack of semantic
browsing. For the user it is not apparent which semantic entity changes by navigat-
ing along one axis. Although nearly located songs are most similar to each other,
it is not intuitive which musical characteristic changes when browsing through the
visualization space. As a solution many approaches introduce semantic entities like
genre mountains. These can serve as a landmark for the user and describe which
musical characteristics are typical for a specific direction. Another possibility is
the use of high-level features. One example from Section “Navigation and Explo-
ration in Music Archives” is the radar system, where each radial direction refers to
a change in a special semantic characteristic. Another example is the stars universe,
also presented in Section “Navigation and Exploration in Music Archives”. Prob-
lems with these approaches are due to the fact that music is not eight-dimensional
or two-dimensional, but multidimensional. So it is not possible to define the holistic
impression of music along a few semantic dimensions. One has to abstract that the
songs are similar in the mentioned dimensions but regarding other musical aspects,
neighbored songs can sound very differently.
Applications
Today both physical products (records and CDs) as well as virtual goods (mu-
sic tracks) are sold via Internet. To find the products, there is an increasing need
for search functionalities. This need has been addressed by a number of search
paradigms. Some just work, even without scientific foundation, others use elabo-
rated models like the ones described in this book.
During the last years, a large amount of MIR-based applications and services ap-
peared. Some of them generated quite some attention in online communities. Some
of the underlying techniques are still subject to basic research and not yet under-
stood to the utmost extent. However, the competition for unique features incited
many small start-up companies as well as some innovation-oriented big players to
push immature technologies to the market. Below we list some applications, that
integrate automatic CB methods to enable retrieval and recommendation of music.
The focus is clearly on CB based systems. Beyond the applications below, there are a
large number of strictly CF-based systems around. Applications that are merely sci-
entific showcases without significant commercial ambitions will not be mentioned
here. Furthermore, a distinction is made between projects that make their applica-
tions publicly available and companies that approach other entities and offer them
their services. In the latter case, it is difficult to assess whether the capabilities of
374 K. Brandenburg et al.
the real product can live up to their marketing promises. It should be noted, that this
section does not claim to be absolutely comprehensive. There are probably some
more projects and companies on the Asian market which we do not know due to
language-barriers. Furthermore, the market for MIR-applications is quite volatile,
so the examples in the following sections can only provide a snapshot of the current
situation.
Business to Business Applications
The American company Gracenote
6
is probably best known for providing the
CDDB CD identification service. Today, they have added different solutions for
music identification and recommendation to their portfolio. Their recommendation
service “Discover” is based on editorial recommendations, content-based and col-
laborative filtering.
The Canadian company Double V3
7
provides audio identification services to the
music and entertainment industry.
The US-based company One Llama
8
can rely on a core team with long experi-
ence in academic MIR research. One Llama’s flagship is called ’Artificial Ear’ and
is said to have extracted hundreds of music features from millions of songs. Their
music discovery tools are based on a combination of CB and CF techniques.
The Echo Nest’s
9
APIs are based on the so-called “Musical Brain”. Follow-
ing their description, the MIR-platform combines CB-recommendation with web-
crawling and knowledge extraction. The founders of the company have a history
with the MIT Media Lab.
The San Francisco based company Music Intelligence Solutions
10
and its Bar-
celona based predecessor Polyphonic Human Media Interface (PHMI) are offering
diverse solutions for music discovery. They are especially well known for the “Hit
Song Science” tool that claims to reliably measure the hit potential of novel songs.
The New York based company Music Xray
11
has a common history with afore-
mentioned Music Intelligence Solutions. Their portfolio comprises a web service
that allows artists and music industry professionals to measure, monitor, stimulate
the demand for novel artists and their songs. They have teamed up with Queen Mary
University’s Centre For Digital Music.
The Spanish company BMAT
12
is a commercial spin-off of the Music Technol-
ogy Group, the music and audio research lab of the Universidad Pompeu Fabra in
6
solutions/discover/
7
/>8
/>9
/>10
/>11
/>12
/>16 Music Search and Recommendation 375
Barcelona. BMAT generated quite some public attention when they powered the
casting of a Spanish idol show with a web application that automatically evaluated
the singing.
The Norwegian company Bach Technology
13
benefits from a long tradition with
related projects in the digital content domain. Bach Technology develops and dis-
tributes audio search and annotation technology to stimulate sales in the “Long Tail”
of music catalogues.
Business to Consumer Applications
The goal of the German company mufin
14
is to foster music consumption and sales
by helping end-users to discover new music that is relevant to their personal pref-
erences. Their products enable discovery and management in large-scale music
collections. In addition, mufin delivers several applications for free download, such
as a recommender Plug-In for Apple iTunes and a stand-alone media player.
The California based company MusicIP
15
was one of the pioneers that made
MIR-applications accessible to end users. Their flagship application is called
“MyDJ Desktop”. It allows the creation of CB based similarity playlists. Addi-
tionally, their music identification service “MusicDNS” has an extensive database
of reference music fingerprints available. It is the basis for the community music
metadatabase MusicBrainz
16
.
Midomi
17
is a melody search engine combined with a community portal. Midomi
circumvents the typical problems of how to acquire melody information in a clever
way. They let their end-users maintain and update the melody database. The input
can be either singing, humming or whistling. The company behind the service is
MELODIS, based in Silicon Valley. Their goal is the development of next generation
of search and sound technologies for global distribution on a wide range of mobile
platforms and devices.
The U.K. based company Shazam
18
started their business in audio identification
in 2002 and emerged as the leading mobile music identification service provider.
They claim to have a fingerprint database of over 6 million tracks. The integration
of their service into the Apples iPhone 3G made the service very well known among
technology-affine communities.
The Berlin based company aupeo
19
is one of the first that combine a music-
lovers social network with a mood-based personalized internet radio. The mood
13
/>14
fin.com/us/software
15
/>16
/>17
/>18
/>19
/>376 K. Brandenburg et al.
annotations of their music catalogue are computed by CB methods. Their unique
business idea is the integration of their service into hardware devices, such as inex-
pensive internet-radios.
Future Directions and Challenges
The former chapters of this article presented important aspects and first results of
state-of-the-art MIR research. However, it seems that many available technologies
are just in their infancy as it was summarised in a mentionable survey by Lew [60]
for the whole multimedia information retrieval sector. Despite considerable research
progress and the astonishing amount of different projects and applications already
on the market, there is no final solution to be seen that would solve the aforemen-
tioned problems related to music recommendation sufficiently. Even worse, there
is a lack of adequate business models to make MIR-technologies an indispensible
helper for modern and technology-oriented lifestyle. The very first MIR-based ap-
plications to become publicly available seemed like toys. This situation is changing
slowly with the integration of recommendation technologies into mobile devices and
other consumer electronics hardware. This takes originally strictly web-based appli-
cations directly into everybodies living room or car. This article shall be concluded
with a brief overview of possible future directions and challenges.
Context-Sensitivity: Purely content based methods for music recommendation
and retrieval know very little about the real world. Learning systems can be taught
some semantics about music, styles and moods. But there are complex interde-
pendencies between sociocultural aspects, the users’ current condition as well as
environmental factors. In [16] some future directions are proposed that are promis-
ing with respect to mobile applications. In fact, new interactive devices (positional
tracking, health, inclination sensors) may provide new possibilities, such as human
emotional state detection and tracking.
Semantic Web and Music Ontologies: A body of formally represented knowl-
edge is based on a conceptualization: the objects, concepts, and other entities that
exist in some area of interest and the relationships that hold among them. A con-
ceptualization is an abstract, simplified view of the world. Every knowledge-based
system is committed to some conceptualization, explicitly or implicitly. An ontol-
ogy is an explicit specification of a conceptualization. The term is borrowed from
philosophy, where an Ontology is a systematic account of Existence. The Music On-
tology Specification
20
provides main concepts and properties for describing music
(i.e. artists, albums, tracks, but also performances, arrangements, etc.) on the Se-
mantic Web. This initiative shall enable the interlinking of music related databases
on the semantic level [90].
Folksonomies: It’s unnecessary to state once again how difficult it is to extract de-
scriptive and relevant information from music content. Consequently, the majority
20
/>16 Music Search and Recommendation 377
of the existing search engines are using simple keyword based approaches. Large
heterogeneous collections of music can probably not be sufficiently described using
a rigid, pre-defined taxonomy. Since it is easier to develop inverted file structures to
search for keywords in large collections, tagging became more attractive. By freely
assigning tags, unstructured files can be made searchable. This is strongly connected
to concepts like wisdom of the crowds or crowd-sourcing. This is based on the as-
sumption that tags assigned by a number of human listeners will result in “wise tags”
(because they are assigned by the crowd) and this will be a better approach than the
rigid taxonomy defined by experts. This idea is appealing and made LastFM
21
and
MP3.com
22
useful and popular. In [101], it can be found that taxonomies created by
experts are useful for cataloguing and hierarchical browsing while the flat view of
folksonomies allows better organization and access of a personal collection. Thus, it
can be assumed that a combination of taxonomy and folksonomy will be a promis-
ing future direction. Furthermore, adaptive MIR models can be trained using the
music examples labeled with tags in order to assign such tags automatically after-
wards [24]
Hybrid Systems: According to first published work ([119], [104]) the combi-
nation of automatic content based and collaborative filtering methods might be
beneficial for the further developments of music retrieval and recommendation
systems. One intuitive advantage is the possibility to avoid the cold-start problem in-
herent to collaborative filtering based systems, by recommending novel or unknown
songs based on their acoustic properties. More advantages are to be expected from
merging social and content-based music metadata with musicological knowledge
as introduced before. Such systems should then be able to derive the importance
of given or computed information for a certain task in a certain context in order to
optimise the decision process or to assess the precision of data sources in order to
autonomousely suppress uncertain information. As another example content-based
similarity measures can probably utilised to automatically correlate the meaning of
differnt tags given by users.
Scaleability: There are different approaches to deal with large amounts of music
content in identification scenarios which have proven to work reliably in real-world
applications. However, it is still an open problem how to deal with millions of songs
in more fuzzy retrieval and recommendation tasks. As an example, currently music
similarity lists in catalogues of several million songs have to be pre-computed. This
however collides with the demand for personalized music recommendations tuned
to the listeners very own preferences. It is an interesting question whether the con-
sideration of musical knowledge in hybrid recommenders will be able to improve
the scalability problem.
Scientific exchange: For the future development of the MIR research scientific
exchange is an essential issue. In that regard the Music Information Retrieval Eval-
uation eXchange (MIREX)
23
is a very commendable initiative of the University
21
/>22
23
Page
378 K. Brandenburg et al.
Urbana at Champaign, Illinois, USA. The big problem for such contests is the
struggle with the limited availability of common music test beds. In the past
some independent labels have released content for certain competitions, but most
researchers have originally started with their own test sets, often ripped from com-
mercial CDs. These sets are annotated, but may not be shared due to copyright
issues. There exists some databases (e.g., [34], [32]) that are intended to be shared
among researchers. Unfortunately, their usage is not as widespread as it could be.
Both, content of a song and context of the user are important to understand why a
user likes or dislikes a song. The decoding of this relation will indeed require lots of
further research. And once it is done, it remains to be shown that knowledge about
the “why” will help finding other songs that satisfy these conditions. This will be
a step towards high-quality individual recommendations that are independent from
what other users feel. As a conclusion it can be clearly stated, that most problems
in content-based MIR are still far from being finally solved. The only task that has
matured to real-world applicability is probably the audio identification task, as the
very successful examples in Section on “Applications” show. Generally speaking,
all of the tasks described in this chapter need significant further research.
References
1. Abeßer, J., Dittmar, C., Großmann, H.: Automatic genre and artist classification by analyz-
ing improvised solo parts from musical recordings. In: Proceedings of the Audio Mostly
Conference (AMC). Pite
˚
a, Sweden (2008)
2. Allamanche, E., Herre, J., Hellmuth, O., Kastner, T., Ertel, C.: A multiple feature model
for music similarity retrieval. In: Proceedings of the 4th International Symposium of Music
Information Retrieval (ISMIR). Baltimore, Maryland, USA (2003)
3. Allamanche, E., Herre, J., Helmuth, O., Froba, B., Kastner, T., Cremer, M.: Content-based
identification of audio material using MPEG-7 low level description. In: Proceedings of
the 2nd International Symposium of Music Information Retrieval (ISMIR). Bloomington,
Indiana, USA (2001)
4. Anderson, C.: The Long Tail: Why the Future of Business is Selling Less of More. Hyperion,
New York, NY, USA (2006)
5. Aucouturier, J.J., Defreville, B., Pachet, F.: The bag-of-frame approach to audio pattern
recognition: A sufficient model for urban soundscapes but not for polyphonic music. Journal
of the Acoustical Society of America 122(2), 881–891 (2007)
6. Aucouturier, J.J., Pachet, F.: Music similarity measures: What’s the use? In: Proceedings
of the 3rd International Conference on Music Information Retrieval (ISMIR). Paris, France
(2002)
7. Aucouturier, J.J., Pachet, F.: Improving timbre similarity: How high is the sky? Journal of
Negative Results in Speech and Audio Sciences 1(1), 1–13 (2004)
8. Aucouturier, J.J., Pachet, F., Sandler, M.: The way it sounds: timbre models for analysis and
retrieval of music signals. IEEE Transactions on Multimedia 7(6), 1028–1035 (2005)
9. Bainbridge, D., Cunningham, S., Downie, J.: Visual collaging of music in a digital library.
In: Proceedings of the International Conference on Music Information Retrieval (ISMIR).
Barcelona, Spain (2004)
10. Bastuck, C., Dittmar, C.: An integrative framework for content-based music similarity re-
trieval. In: Proceedings of the 35th German Annual Conference on Acoustics (DAGA).
Dresden, Germany (2008)