Recent Developments of Electrical Drives - Part 3 ppt
Bạn đang xem bản rút gọn của tài liệu. Xem và tải ngay bản đầy đủ của tài liệu tại đây (669.73 KB, 10 trang )
I-1. CORE LOSS IN TURBINE
GENERATORS: ANALYSIS OF NO-LOAD
CORE LOSS BY 3D MAGNETIC FIELD
CALCULATION
A. Nakahara
1
, K. Takahashi
1
,K.Ide
1
, J. Kaneda
1
, K. Hattori
2
,
T. Watanabe
2
,H.Mogi
3
, C. Kaido
3
, E. Minematsu
4
, and K. Hanzawa
5
1
Hitachi Research Laboratory, Hitachi, Ltd., 7-1-1, Omikacho, Hitachi, Ibaraki 319-1292, Japan
,
2
Hitachi Works, Power Systems, Hitachi Ltd., 3-1-1, Saiwaicho, Hitachi, Ibaraki 317-8511, Japan
kenichi
,
3
Steel Research Laboratories, Nippon Steel Corp., 20-1, Shintomi, Futtsu, Chiba 293-8511, Japan
4
Flat Products Division, Nippon Steel Corp., 6-3, Otemachi, 2-chome, Chiyoda-ku,
Tokyo 100-8071, Japan
5
Yawata Works, Nippon Steel Corp., 1-1, Tobihatacho, Tobata-ku, Kitakyusyu,
Fukuoka 804-8501, Japan
Abstract. Magnetic field analysis of no-load core loss in turbine generators is described. The losses
in laminated steel sheets are calculated from the results of finite element magnetic field analysis. The
additional losses in metal portions other than the steel sheets are also calculated. The sums of these
losses were compared with the measured values for two generators and found to be 88% and 96% of
the measured values. The results revealed that the additional losses made up a considerable part of
the core losses.
Introduction
Turbine generators have been developed by using various design technologies to meet the
needs of customers. Reliable estimation of losses is essential in designing highly efficient
turbine generators [1–3].
Among various losses, core loss is one of the most difficult to estimate for two reasons:
1. The cataloged data of electrical steel sheets are measured for a rectangular shape in
a uniform magnetic field. Electrical steel sheets in an actual machine, however, are
processed into complex shapes, and the induced field is not uniform.
2. The measured core loss of a turbine generator seems to include additional losses. One
of them is eddy current loss in the electrical steel sheets due to the axial magnetic flux.
Others include losses in metal parts other than the steel sheets.
S. Wiak, M. Dems, K. Kom
˛
eza (eds.), Recent Developments of Electrical Drives, 3–12.
C
2006 Springer.
4 Nakahara et al.
This paper presents an analysis of the core losses under no-load conditions in turbine
generators by utilizing a three-dimensional magnetic field calculation based on a finite
element method. The analysis consists of two steps. First, we calculate the loss in laminated
steel sheets from experimental data obtained with an Epstein frame. In this calculation,
we take into account differences between the actual core loss and cataloged data. Second,
we calculate the additional losses in metal parts other than the steel sheets. Based on the
analysis results, we also compare the total calculated core losses with measured values for
two turbine generators.
Calculation method
As noted above, the core losses are calculated in a two-step procedure. First, we calculate
the loss in the laminated steel sheets by using the experimental data obtained with an
Epstein frame. In this calculation, we take into account the rotational magnetic field and the
harmonics.
Second, we calculate the additional losses. For metal parts other than the laminated steel
sheets, we calculate the losses by three-dimensional finite element analysis. We also use
the finite element method to calculate the losses due to the axial flux in the laminated steel
sheets, because the data obtained with the Epstein frame do not include these losses.
Loss in laminated steel sheets
The loss due to the alternating field in the laminated steel sheets can be calculated from the
experimental data with the following equation:
W
i
= W
h
+ W
e
= K
h
B
α
max
f + K
e
B
2
max
f
2
(1)
where W
i
is the loss per weight of the sheets, W
h
and W
e
are the hysteresis and eddy current
losses per weight, respectively, K
h
and K
e
are coefficients obtained with the Epstein frame,
f is the frequency of the alternating magnetic field, and B
max
is the maximum magnetic
flux density occurring in one cycle.
Although the magnetic field in an Epstein frame is a static alternating field, the magnetic
field in an actual generator is a rotational field with harmonics. Thus, the rotational and
harmonic effects must be taken into account, and to calculate these effects, we apply two
methods. We utilize the method proposed by Yamazaki [4] to calculate the hysteresis loss,
and the Fourier series expansion method to calculate the eddy current loss.
In equation (1), it is assumed that W
h
and W
e
are proportional to f and f
2
respectively
for any level of the magnetic flux density, B. The core loss, however, actually includes the
excess loss due to the microstructure of a steel sheet [5–7]. In addition, the B-dependency
of the hysteresis loss varies according to the level of B [8].
To consider the excess loss andthe B-dependency of thehysteresis loss, various methods
have been proposed. Though the eddy current loss is expressed by one term in equation
(1), it is expressed by two terms in the methods proposed to consider the excess loss [4–6].
One term expresses the classical eddy current loss and is proportional to B
2
f
2
. The other
term expresses the excess loss and is assumed proportional to B
1.5
f
1.5
. On the other hand,
a method proposed to express the B-dependency of the hysteresis loss changes the values
of the exponent α and of K
h
for different levels of B in equation (1) [8]. Different levels
defined in this method are from 0 to 1.4 T, from 1.4 to 1.6 T, and from 1.6 to 2.0 T.
I-1. Core Loss in Turbine Generators 5
8 10
–5
0.0001
0.00012
0.00014
0.00016
0.00018
0.002
0.003
0.004
0.005
0.006
0.007
0 0.5 1 1.5 2
Ke
Kh
B [T]
Figure 1. B-dependency of K
h
and K
e
.
These methods consider the B-or f -dependency of the core loss by changing the com-
ponents of B or f . Nevertheless, it is difficult to completely express these complex depen-
dencies. Additionally, the dependencies differ according to the kind of steel sheet.
Consequently, we propose a method to reflect the B- and f -dependencies of K
h
and K
e
.
In equation (1), we assume that α = 1.6, based on tests by Steinmetz [9]. Fig. 1 shows an
example of the B-dependencies of K
h
(circles) and K
e
(triangles) obtained with an Epstein
frame. In this case, the maximums of K
h
and K
e
are roughly twice and three times as large,
respectively, as their minimums.
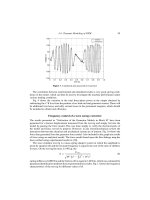
In Fig. 2, the dots represent the ratio, W
i
/ f , at different frequencies, where W
i
is the loss
in electrical steel sheets measured with an Epstein frame at 0.5 T for 50, 60, 100, 200, and
400 Hz. Dividing equation (1) by f gives the following equation:
W
i
/ f = K
h
B
1.6
max
+ K
e
B
2
max
f (2)
K
h
and K
e
can thus be derived from the slope and intercept of a line connecting two points,
as shown in Fig. 2. For example, K
h
(50–60 Hz) indicates the value of K
h
derived from the
0 100 200 300 400 500
Frequency [Hz]
Ke(200–400Hz)
Ke(100–200Hz)
Ke(60–100Hz)
Kh(50–60Hz)
Ke(50–60Hz)
Wi/f
Figure 2. Derivation of K
h
and K
e
.
6 Nakahara et al.
0
0.2
0.4
0.6
0.8
1
1.2
1.4
1.6
0 0.5 1 1.5 2
Measured
Proposed
Fixed at 1.0T
Core Loss [W/kg]
B [T]
Figure 3. Core loss reproduced by proposed method.
points corresponding to 50 and 60 Hz, and it is applied over the range from 50 to 60 Hz in
the calculation. By repeating this operation for each level of B, tables showing the values
of K
h
and K
e
for various values of B and f can be constructed.
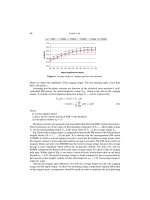
Fig. 3 shows the core loss data, with the line representing measured results. The circles
representvaluesobtainedbyequation(1)intheproposedmethod,whilethesquaresrepresent
values obtained by equation (1) with K
h
and K
e
derived at 1.0 T and 50–60 Hz. As seen
from the data, the approximation is not good enough. On the other hand, the measured
values are accurately reproduced by the proposed method. Thus, the complex dependency
can be expressed by generating sufficient quantities of data for B and f.
It is difficult to experimentally evaluate the genuine loss of the laminated steel sheets in
an actual generator because the measured loss inevitably includes the additional losses in
metal parts other than the steel sheets. For this reason, we compared the calculated values
with theexperimental resultsfor astatorcore modelto verify theaccuracyof thecalculation.
The results are plotted in Fig. 4. The difference between the calculated and measured values
is within 10%.
0
0.5
1
1.5
2
0 0.3 0.6 0.9 1.2 1.5
Measured
Calculated
Core Loss [W]
B [T]
Figure 4. Core loss of the model core.
I-1. Core Loss in Turbine Generators 7
Rotor
(6) Pole surface
Laminated steel sheet
Duct
Stator core segment
(2) Stator end structures
(3) Armature coil strand
(4) Core end
(5) Duct structures(1) Flux transition at the segment gap
Axial
Circumferential
Segment gap
Packet
(1) Flux transition at the segment gap
Figure 5. Causes of additional losses.
Additional losses
Wecannowcalculatetheadditionallosses,whichareillustratedinFig.5.Theyare calculated
with a local model for each portion, because calculating the additional losses with a whole
generator model would take too long during the design phase. Fig. 6 depicts an example
of a whole generator model for a two-pole machine, so the modeled region is half of the
generator.The magnetic flux levels inthe local models are coordinatedto match the levels in
the whole generator model. The local models separately account for the following portions
of the generator:
1. Flux transition at the segment gap. There are gaps between two core segments in the
laminated steel sheets, so the magnetic flux transfers from one layer to another at these
gaps. As a result, eddy current losses due to the axial magnetic flux arise in the laminated
steel sheets. These losses are calculated with a local model for several layers of steel
sheets.
2. Stator end structures. The eddy current losses in the clamping flanges and the shields
are calculated for each local model.
3. Armature coil strand. After calculating the magnetic flux density incoming to the arma-
ture end winding, the loss in the coil strand is calculated by a analytical formula.
Clamping flange
Stator core
(Laminated steel sheets)
Rotor
Shield
Armature winding
Figure 6. Whole generator model.
8 Nakahara et al.
Table 1. Specifications of turbine generators
Rating 220 MVA 170 MVA
Voltage 18,000 13,200
Power factor 0.9 0.85
No. of poles 2 2
Frequency 50 50
Coolant Air H
2
Core material NO GO
4. Core end. The eddy current loss due to the axial magnetic flux is calculated for a local
model of this portion.
5. Duct structures. The eddy current loss in the duct pieces is calculated.
6. Pole surface. The eddy current loss at the pole surface is calculated.
Results
Table 1 shows the specifications of the two turbine generators that we analyzed. These two
generatorshaveatypicaldifferenceintheircorematerials:oneis made of non-grain-oriented
steel sheets (NO), while the other’s core is grain-oriented (GO).
Loss in laminated steel sheets
The stator core of a turbine generator has cooling ducts, as shown in Fig. 7. This causes the
magnetic flux toconcentrate atthe corners ofthe steelsheets. To consider thisconcentration,
we calculate the magnetic flux density of a one-packet model by using three-dimensional
finite element analysis.
Fig. 8 shows the axial distributions of the radial magnetic flux. The triangles represent
the magnetic flux density in the stator teeth, while the squares represent that in the stator
Rotor
Radial
Axial
Magnetic
flux
Modelled area
Packet
Cooling duct
Stator
Coil
Teeth
Yoke
Stator core
Figure 7. Cooling ducts.
I-1. Core Loss in Turbine Generators 9
Packet
Axial
0.8
0.9
1
1.1
Axial Position
Magnetic flux density
[p.u.]
Teeth Yoke
Packet
Teeth Yoke
Center of packetCooling duct
Radial
Figure 8. Concentration of magnetic flux at duct area.
yoke. The magnetic flux density in the yoke is constant in the region from the duct side to
the center of the packet. On the other hand, the magnetic flux density in the teeth at the end
is about 5% larger than that at the center. The eddy current loss due to the axial magnetic
flux is calculated by using another model with finer elements.
The magnetic flux vectors and the distributions of the core loss density in the laminated
steel sheets for the 220 MVA and 170 MVA machines are depicted in Figs. 9 and 10, res-
pectively. The magnetic flux vectors are shown by the blue arrows in Figs. 9(a) and 10(a).
In Figs. 9(b) and 10(b), the red and blue areas represent regions of higher and lower loss
density, respectively. The loss density is especially high at the tooth tips in both machines. It
Radial
(a)
(b)
Axial
High
Low
Loss density
Figure 9. Lossdensityin laminated steel sheets (220MVA).(a) Magneticflux vectors. (b) Distribution
of loss density.
10 Nakahara et al.
Radial
Axial
High
Low
Loss density
(a) (b)
Figure 10. Loss density in laminated steel sheets (170 MVA). (a) Magnetic flux vectors. (b) Distri-
bution of loss density.
is also high at the inner area of the stator yoke. The differences in loss distribution between
the two machines are due to the different stator core materials.
The loss density in the stator yoke of the 170 MVA machine is lower than that of the
220 MVA machine because its stator core material is GO steel. In contrast, the loss density
at the teeth of the 170 MVA machine is higher than that of the other machine due to the
properties of the electrical steel sheets.
Additional losses
The eddy current loss densities in the clamping plate and shield are shown in Fig. 11. The
red and blue areas represent high and low density, respectively. The loss is concentrated at
the inner area in both parts because of the concentration of the magnetic flux there.
The additional losses as percentages of the total core losses are shownin Fig. 12. Reflect-
ing the different characteristics, the percentages differ between the two generators. Several
Local model
Shield
Clamping flange
Clamping flange
Shield
Whole generator model
Figure 11. Eddy current loss of the shield.
I-1. Core Loss in Turbine Generators 11
0
5
10
15
20
25
30
35
40
45
220MVA 170MVA
Additional losses [% in total core loss]
(6)Pole Surface
(5)Duct Structures
(4)Core end
(3)Coil End Strand
(2)End Structures
(1)Segment gap
Figure 12. Calculation results of additional losses.
factors influence the additional losses, including the electrical design, the structure, and the
materials.
Fig. 13 shows the calculation results for the total core losses. The calculated losses
were 88% and 96% of the measured values for the 220 MVA and 170 MVA machines,
respectively. In both cases, the additional losses make up a considerable part of the core
losses. This confirms the necessity of calculating the additional losses when estimating the
total core losses of turbine generators.
Conclusions
We have shown that the so-called core loss of a turbine generator includes various losses
besides those produced in the laminated steel sheets of the core. We have also analyzed the
causes of the losses in these sheets. Part of these losses can be calculated by considering the
rotational field andthe harmonics. Anotherpart isdue tothe axialflux orfield concentration.
Additional losses result from the metal parts other than the steel sheets. By considering all
of these losses, the total core losses of two different types of generators were calculated.
0
20
40
60
80
100
220MVA 170MVA
Core Losses [% in measured core loss]
Additional losses
Laminated Steel Sheets
Figure 13. Calculated total core losses.
12 Nakahara et al.
The differences between the calculated and measured total core losses were within 12%.
This technique can thus contribute to the design of highly efficient turbine generators.
References
[1] K. Takahashi, K. Ide, M. Onoda, K. Hattori, M. Sato, M. Takahashi, “Strand Current Dis-
tributions of Turbine Generator Full-Scale Model Coil”, International Conference Electrical
Machines 2002 (ICEM 2002), Brugge, Belgium, August 25–28, 2002.
[2] K. Ide, K. Hattori,K. Takahashi,K. Kobashi,T. Watanabe,“ASophisticated Maximum Capacity
Analysis for Large Turbine Generators Considering Limitation of Temperature”, International
Electrical Machines and Drives Conference 2003 (IEMDC 2003), June 1–4, 2003, Madison,
Wi.
[3] K. Hattori, K.Ide, K. Takahashi, K. Kobashi,H. Okabe, T. Watanabe, “Performance Assessment
Study of a 250MVA Air-CooledTurbo Generator”, International Electrical Machines and Drives
Conference 2003 (IEMDC 2003), June 1–4, 2003, Madison, Wi.
[4] K. Yamazaki,“StrayLoad Loss Analysisof InductionMotors Due to Harmonic Electromagnetic
Fields of Stator and Rotor”, International Conference Electrical Machines 2002 (ICEM 2002),
Brugge, Belgium, August 25–28, 2002.
[5] G. Bertotti, General properties of power losses in soft ferromagnetic materials, IEEE Trans.
Magn., Vol. 24, pp. 621–630, 1988.
[6] P. Beckley, Modern steels for transformers and machines, Power Eng. J., Vol. 13, pp. 190–200,
1999.
[7] J. Anuszczyk, Z. Gmyrek, “The Calculation of Power Losses Under Rotational Magnetization
Excess Losses Including”, International Conference Electrical Machines 2002 (ICEM 2002),
Brugge, Belgium, August 25–28, 2002.
[8] H. Domeki, Y. Ishihara, C. Kaido, Y. Kawase, S. Kitamura, T. Shimomura, N. Takahashi, T.
Yamada, K. Yamazaki, Investigation of benchmark model for estimating iron loss in rotating
machine, IEEE Trans. Magn., Vol. 40, pp. 794–797, 2004.
[9] C.P. Steinmetz, On the law of hysteresis, AIEE Trans., Vol. 9, 1892, pp. 3–64. Reprinted under
the title “A Steinmetz contribution to theAC power revolution” introduced by J.E. Brittain, Proc.
IEEE, Vol. 72, pp. 196–221, 1984.