Recent Developments of Electrical Drives - Part 6 doc
Bạn đang xem bản rút gọn của tài liệu. Xem và tải ngay bản đầy đủ của tài liệu tại đây (966.42 KB, 10 trang )
34 P´erez-Donsi´on
Figure 13. Graphic representation of speed vs. time for different inertia torque (M) with Tl = 0 and
Sl = 1.
The permanent magnets influence about the transient behavior of the PMSM is very
important. As higher are the equivalent currents of the magnets as lower are the slips of
the transient response. In Fig. 18 we can observe that if the current of the magnet decrease
below a certain value the motor is not capable of take up the overload and the motor lost
the synchronism. The optimum value of this current depends, amount other factors, of the
magnets braking torque at the synchronous speed proximity. If this value is overcome they
will appear higher oscillations during the transient operation.
The rotor geometry and in consequence the relationship between the d-axis and q-axis
reactances, also modify the PMSM behavior, as in the same way that for the equivalent
current we must obtain an optimum value for the relation Xd/Xq and also it is important to
obtain the most appropriate squirrel cage resistance value.
Figure 14. Graphic representation of the torque of the squirrel cage vs. time for a sudden decrease
of the load.
I-3. Coupled Model for PMSM 35
Figure 15. Graphic representation of the torque of the squirrel cage vs. time for a sudden increase of
the load.
Really thenumber of variables that have influence about the starting and synchronization
processesof aPMSM,takeinto account themotorand alsotheload,isvery higherandthen it
isvery difficultknowin advanceaset of necessaryconditionsforthe correctsynchronization
of the PMSM. Then for develop an analyze of this type it is necessary take into account the
parametric variation of the main magnitudes that have influence about the synchronization
process.
Inthisparticularcasewehaveanalyzedthisprocessintermof his synchronization energy,
specially we have considered the property “capacity of synchronization” of the motor, that
Figure 16. Graphic representation of the magnets and reluctance torques vs. time during a sudden
increase of the load.
36 P´erez-Donsi´on
Figure 17. Graphic representation of the magnets and reluctance torques vs. time during a sudden
decrease of the load.
we can defined it like a set of critical combinations of inertia and load torque in which the
PMSM is capable to obtain the synchronization.
For obtain the synchronization energy we use a set of simple expressions that permit
determine this magnitude in the last stage of the synchronous operation of the motor just
when the machine describe a limit circle.
Figure 18. Graphic representation of speed vs. time for different values of the equivalent current of
the magnets with Sl = 1 and Tl = 0.
I-3. Coupled Model for PMSM 37
The dynamic equation expressed in the torque-slip plane is, (8):
−
1
p
J ·w
2
0
· s
ds
dδ
= Ts(δ) + Ta(s) − Tc(s) (8)
Where: J is the combination inertia of the motor and the load, Ts is the sum of all the
synchronization torques, Ta include all the asynchronous average torques, and Tc is the sum
of the load, slip, and ventilation torques.
The equation (8) describe the critical trajectories of the polar slips on the load angle-slip
plane.
Conclusions
We have developed along this paper a coupled model for accurate representation of the
characteristics of permanent magnet synchronous motors and we have proposed the de-
termination of the direct axis reactance, “Xd,” and the quadrature axis reactance, “Xq,” by
calculus and texts with the permanent magnet synchronous machine under generator duty.
We also have analyzed the starting and synchronization processes of the PMSM and the
influence that on transient behavior of the motor produce different values of the main motor
parameters.
References
[1] J. Salo, T. Heikkil¨a, H.T. Pyrh¨onen, “New Low-Speed High-Torque Permanent Magnet Syn-
chronous Machine With Buried Magnets”, International Conference on Electrical Machines
(ICEM 2000), Espoo, Finland, 2000, pp. 1246–1250.
[2] F.Parasiliti, P.Poffet, A model forsaturationeffects in high fieldpermanent magnet synchronous
motors, IEEE Trans. Energy Convers., Vol. 4, No. 3, pp. 487–494, 1989.
[3] M.P. Donsion, M.F. Ferro, Motores sincronos de imanes permanentes, Research book published
by the University of Santiago de Compostela, Spain.
[4] M.P. Donsi´on, J.F. Manzanedo, C. Iglesias, “Coupled Model of the Interior Type Permanent
Magnet Synchronous Motor. Application to a Siemosyn Motor”, International Conference on
Electrical Machines (ICEM’94), Par´ıs, France, 1994, pp. 144–147.
[5] M.F. Ferro, M.P. Donsion, “Torques Analysis in Permanent Magnet Synchronous Motors”,
IASTED Power High Tech’89, Valencia, Spain, 1989, pp. 271–275.
[6] M.F.Ferro, M.P. Donsi´on“TransientBehaviorofPermanentMagnetSynchronousMotorsUnder
Sudden Change in Load”, IASTED Ninth International Symposium, Modelling, Identification
and Control, Innsbr uck, Austria, pp. 406–410.
[7] M.F. Ferro, M.P. Donsi´on, “Specific Characteristics of the Interior Type Permanent Magnet
Synchronous Motors. Aplication so a Siemosyn1FU3134”,International AEGEAN Conference
on Electrical Machines and Power Electronics, Turkey, Vol. 2, pp. 378–382.
I-4. DYNAMIC MODELING OF A LINEAR
VERNIER HYBRID PERMANENT
MAGNET MACHINE COUPLED TO A
WAVE ENERGY EMULATOR TEST RIG
M.A. Mueller
1
, J. Xiang
2
, N.J. Baker
2
, and P.R.M. Brooking
2
1
Institute for Energy Systems, School of Engineering and Electronics, University of Edinburgh,
Edinburgh, EH9 3JL, UK
2
School of Engineering, University of Durham, Science Site, South Road, Durham, DH1 3LE, UK
, ,
Abstract. A vernier hybrid machine has been developedforuse as a linear generatorina wave energy
converter. Accurate predictions for power capture require testing this machine in a nonsinusoidal
manner. A dynamic model capable of predicting the machine’s behavior for this kind of mechanical
excitation is presented. Simple equivalent circuit models have been found to be unsuitable for these
machines and a flux-linkage map approach is instead used. Experimental results are used to verify
this approach and the functioning of a unity power factor controller.
Introduction
The vernier hybrid permanent magnet machine (VHM) is a member of the family known as
variable reluctance permanent magnet machines. These machines are known to produce air
gap shear stresses significantly higher than conventional machines. Weh et al. [1] measured
a shear stress in the transverse flux machine (TFM) of the order of 200 kN/m
2
. However,
the TFM is a very complex machine to construct. Mecrow and Jack [2] investigated the
use of VRPM topology in a more conventional machine structure and demonstrated that
improvements over conventional machines could be made. Spooner and Haydock [3] de-
veloped the VHM, which is easier to construct than the TFM, but also benefits from high
shear stress. A shear stress of 106 kN/m
2
has been measured for a prototype linear VHM
[4]. Combined with the high shear stress capability and the effect of magnetic gearing the
VHM is a suitable machine for low speed high torque (or force) applications. One such
application is in direct drive wave energy converters as proposed by Mueller and Baker [5].
In this applicationa linear generatoris directlycoupled tothewaveenergydevice, suchas
aheavingbuoyor the ArchimedesWaveSwing [6] sothatthegeneratorexperiencesthesame
displacement as the device. Ideal waves are monochromatic resulting in sinusoidal motion.
Under this condition the displacement of the generator is well known, but the induced
voltage is variable in both frequency and magnitude. In real sea conditions waves from
different frequencies combine to give a very random motion. Wave data has been collected
S. Wiak, M. Dems, K. Kom
˛
eza (eds.), Recent Developments of Electrical Drives, 39–49.
C
2006 Springer.
40 Mueller et al.
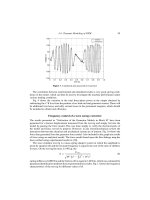
Figure 1. Open circuit voltage in a linear VHM.
over many years using instrumentation buoys, and data from one particular buoy has been
collated to demonstrate the nature of the actual displacement a direct drive generator will
experience. The data is stored as one dimensional wave data, a compact form summarizing
the displacement characteristics of the sea surface [7]. Fig. 1 shows the recreation of typical
displacementand velocitywaveformobtained from thedataofonesuchbuoy. The amplitude
and period of the signal have been scaled down to preserve the shape of the signal whilst
allowing for a manageable sized test rig [8].
It is quite clear that the machine is expected operate in a very dynamic environment.
Hence a dynamic model of the VHM has been developed to investigate its performance
and how it interacts with the wave energy device. The model can be used to investigate
the use of the electrical generator itself to control and tune the actual characteristics of
the device. An indication of how this can be achieved is given in the paper. In addition the
model has been developed to enable the designer to investigate the conditions under which
the machine has to operate to overcome the inherent high inductance and hence to extract
maximum power. Based upon the displacements in Fig. 1 the power output is likely to be
random and pulsating. Output from the dynamic model can be used to investigate control
strategies for energy storage to smooth the power.
The model is described in the paper and results are presented to verify it and to illustrate
its use withthisapplication in mind.It has beendevelopedusing MATLABand incorporated
into SIMULINK such that it can be represented as a block to enable it to be connected to
models of different marine energy prime movers.
Experimental machine and test rig
A prototype linear VHM has been designed and built, details of which are given in [9], and
a photo is shown in Fig. 2. Table 1 summarizes the main geometrical data. The translator
is driven via a crank mechanism connected to a variable speed drive via a 14:1 step down
gearbox. In this way the translator can be driven at frequencies typical of those expected in
I-4. Dynamic Modeling of VHM 41
Figure 2. Linear VHM prototype.
a direct drive wave energy converter. The output of the generator is fed into a three-phase
ac/ac converter, the details of which can be found in reference [4].
Model description
Fig.3shows a blockdiagram ofthecomplete generator modelincludingablockto maximize
the power output of the electrical generator and the prime mover. The complete electrome-
chanical model consists of three blocks, A, B, and C, corresponding to the prime mover,
generator, and power conversion equipment, respectively. The contents of each block will
be described in this section.
Block A: Prime mover model
In this application the prime mover is a marine energy device, which could be a wave or
tidal stream energy converter. The inputs to the model are the force imparted by the waves
Table 1. Main dimensions of the prototype
Magnet pitch (mm) 12
Magnet thickness (mm) 4
Air gap (mm) 1
Core length (mm) 100
Magnets per pole 6
Rotor pole pitch (mm) 24
Rotor slot depth (mm) 10
C-core slot depth (mm) 100
C-core slot width (mm) 144
Core back (mm) 50
Turns per coil 240
Coil resistance () 0.3
Coil inductance (H) 0.14
42 Mueller et al.
F
gen
F
wave
x(t)
(i,x)
desire
d
Î
i(t)
Generator
circuit model
V(t)
Block A
Block B
Block C
Prime
mover
Y
Y
-I
map
UPF
model
Force
model
Figure 3. Model block diagram.
say and the generator reaction force, with displacement being the output. A wave energy
device is simply modeled as a mass-spring damper system according to equation (1).
F
wave
− F
gen
= Kx+ B
˙
x + M
¨
x (1)
where F
wave
is the force on the device from the incident wave, F
gen
is the generator reaction
force, M is the device mass, K is the buoyancy force, and B is the mechanical resistance.
The buoyancy force is essentially a springforce. The mechanicalresistance is the sum of the
radiation resistance due to waves being created by motion of the device and any mechanical
and viscous losses.
A test righas beendeveloped toemulate the mass-springdamper systemin awaveenergy
device. The structure of the rig is shown in Fig. 4 and has a similar response to equation (1).
An induction motor stepped down through a gearbox drives the crank which drives
the rotor (or translator) of the linear generator via the springs and steel cables. Without
the springs the amplitude of the rotor is 0.2 m, but with the additional energy from the
springs the rotor can achieve much greater amplitudes, depending upon the choice of spring
Rotor
Springs
Crank
Pulleys
x
x
x
a
a2x
a
o
a
2r
x
r
o
o
o
K
1
K
2
r
l
x
l
x
B
a
r
w
0
D
r
R
DA
Rotor
Figure 4. Wave energy emulator.
I-4. Dynamic Modeling of VHM 43
Flux Linkage (WB T)
0
-15
-10
-5
0
5
10
15
5
10
15
20
25
-8
-6
-4
-2
0
2
4
6
8
Current (A)
Position (mm)
Figure 5. Flux-linkage map for the VHM prototype.
stiffness and the friction. The displacement, x(t), is nearly sinusoidal, thus representing
monochromatic waves. In this case F
wave
is now the force imparted to the crank by the
drive motor, K is the spring stiffness, M is the mass of the translator, and B represents the
mechanical losses in the rig, which are principally in the pulleys.
Block B: Generator flux-linkage model
The flux-linkage-position map provides a complete electromagnetic description of the ma-
chine. Because of the small magnet pitch in the VHM it was found that a simple equivalent
circuit approach used for PM synchronous machines was not accurate enough. 2D finite
element analysis was used to generate the flux-linkage map, which is essentially used as
a look-up table in the model. Knowing the position and current the flux-linkage is then
determined, which is used in the force and circuit models. Fig. 5 shows the flux-linkage
map generated from a 2D finite element model [9].
Block B: Generator force model
The flux-linkage map generated from 2D finite element analysis is used to determine the
co-energy at a particular position and coil current. Force is then calculated from the rate of
change of co-energy with displacement according to equation (2):
F =
∂W
∂x
(2)
Block B: Generator circuit model
The generator circuit model is shown in Fig. 6, in which the no-load induced emf and
inductance are lumped into one represented by the rate of change in flux linkage. The
44 Mueller et al.
R
V(t)
dt
dΨ(i, x)
Figure 6. Phase equivalent circuit for the VHM.
terminal voltage is described in equation (3).
V(t) =
d(x, i)
dt
−i(t)R (3)
Block C: Unity power factor correction model
A three-phase active rectifier connected to the terminals of the VHM is controlled to ensure
that the generator current is in phase with the induced emf in order to maximize the power
generated at the terminals. By controlling the machine in this way reactive power flows
from the active rectifier to compensate for the high inductance in the machine. This has
been implemented and demonstrated on the prototype machine [4]. A measure of the no-
load induced emf is required so that PWM signals can be generated to control the switches
in the active rectifier and thus ensuring the current tracks the emf exactly. Search coils
are used on the rig to achieve this, but in the simulation the induced emf is obtained from
the flux-linkage map at zero armature current (equation (4)). The desired armature current
is simply scaled from the no-load induced emf according to the ratio of the peak desired
current and the peak no-load induced emf as shown in equation (5).
E(t) =
d(x, i = 0)
dt
. (4)
i(t) =
ˆ
I
desired
ˆ
E
no load
E(t). (5)
The generator current then feeds the force model and the flux-linkage model and hence
used to calculate the new position, the next value of flux linkage, and so on.
Verification of the generator models in block B
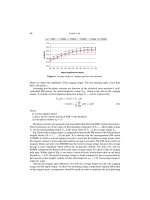
Experimental results were used to verify the model and algorithm developed. Displacement
measurements taken from the test rig were fed into the model to generate these results.
Fig. 7 shows the no-load emf.
Fig. 8(a,b) shows experimental and computed results for the prototype machine, when
operating in unity power factor mode.

