Recent Developments of Electrical Drives - Part 7 ppt
Bạn đang xem bản rút gọn của tài liệu. Xem và tải ngay bản đầy đủ của tài liệu tại đây (1022.26 KB, 10 trang )
I-4. Dynamic Modeling of VHM 45
150
100
50
-50
-100
-150
0 0.1 0.2 0.3 0.4 0.5
time (s)
0.6 0.7 0.8 0.9 1.0
voltage (v)
0
predicted
experimental
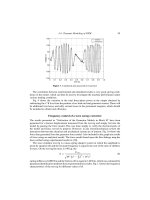
Figure 7. Calculated and measured no-load emf.
The correlation between experimental and simulated results is very good, giving confi-
dence in the model, which can then be used to investigate the machine performance under
various loading conditions.
Fig. 9 shows the variation in the total three-phase power at the output obtained by
subtracting the I
2
R loss from the product of no-load emf and generator current. There will
be additional iron losses and eddy current losses in the permanent magnets, which should
be included to obtain total efficiency.
Frequency control of a wave energy converter
The results presented in “Verfication of the Generator Models in Block B” have been
generated for a known displacement measured from the test rig and simply fed into the
model by-passing the force model. This was done simply to verify the electrical parts of
the model and hence served its purpose. However, in any electromechanical system the
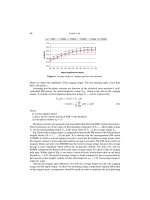
interaction between the electrical and mechanical system are of interest. Fig. 10 shows the
force data generated from the generator force model. Also included in the graph are results
of force using an analytical model. The force model based upon the flux-linkage map has
been verified using experimental results in [10].
The wave emulator test rig is a mass-spring damper system in which the amplitude is
given by equation (6) and the resonant frequency is equal to the root of the ratio of stiffness
to mass. On the test rig the mass is 190 kg, the
X =
F
wave
M
2
ω
2
−
K
M
2
+ B
2
ω
2
(6)
spring stiffnessis 8,000Nm andthe friction(B)isequal to148 N/m,which wasestimated by
parameteridentification methodsfromexperimentaltestresults.Fig.11shows thefrequency
characteristics of the test rig for different values of B.
46 Mueller et al.
(a)
(b)
Figure 8. (a) Calculatedand measuredterminal voltage. (b)Calculatedand measuredgeneratorphase
current.
In a wave energy device active power is absorbed from the sea by its damping compo-
nents. These are divided into mechanical, viscous, and radiation loses in addition to the
electrical damping force providing the electrical power conversion. In addition some of the
incident wave energy is used to supply the energy stored in the device mass and device
spring stiffness. The electrical analogy of this would be reactive power. At resonance no
reactive power is supplied to the device from the sea. When the device is operating at off-
resonance pointsa method ofsupplying thereactive power externallyis required tooptimize
the energy captured. Externally applied forces that modify the stiffness of the system have
been proposed as a means of frequency control. In order to investigate how the generator
Figure 9. Total three-phase output power.
4000
3000
2000
1000
0
-1000
-2000
-3000
-4000
5
10
15
20
25
Force (N)
I=-15A
I=-10A
I=-5A
I=15A
I=10A
I=5A
I=0A
force data; Red:FE Blue Simple Force model; Black: nth Force model
x (mm)
Figure 10. Generator force data for one phase.
Figure 11. Frequency characteristics of the test rig.
48 Mueller et al.
reactive force could be utilized it is represented as the sum of two forces: a damping force
and an equivalent stiffness force.
F
g
= B
g
˙
x − K
g
x (7)
where B
g
is the equivalent electrical damping and K
g
is the equivalent generator stiffness.
The frequency response is modified to include the generator reaction force (equation (8))
and the resulting resonant frequency is given in equation (9).
X =
F
wave
M
2
ω
2
−
K
w
−K
g
M
2
+
B
w
+ B
g
2
ω
2
(8)
ω
0
=
K
w
− K
g
M
(9)
By controlling the stiffness component of force in equation (7) it is possible to modify
the frequency characteristics of the device. The two components of forces in equation (7)
are perpendicular to one another. Resolving the currents into components 90 degrees to
one another will enable control of the generator damping and stiffness force. Control of
the latter will enable the frequency characteristics of the device to be modified and hence
optimize the energy captured.
Discussion
Marine energy converters, in particular wave energy devices, are highly dynamic devices.
Directly coupling a linear electrical generator to the device requires adynamicmodelof the
generator in question in order to investigate performance under realistic conditions. Such a
modeling tool enables the designer to compare and assess electrical generator technology
before going to the next stage of production.
As expected the output power from the device shown in Fig. 8 is pulsating due to the
reciprocating nature of the motion. Energy storage is required to ensure smooth power flow
from a single device whichcouldbe investigated by includingan energy storage and control
block in the overall model.
This paper has described in detail a generator model for the VHM represented by block
B in Fig. 3. It forms the basis of a system model including any prime mover model or
control models to optimize performance of the whole systems. An indication of how the
model might be used to control the frequency characteristics has been given in “Frequency
Control of a Wave Energy Converter.” Since the generator model is the basic building
block in the system, the designer must have confidence in it. The model has been verified
using experimental results obtained from the prototype in Fig. 2. A sample of experimental
and calculated results is shown in Fig. 8(a,b), which shows very good correlation giving
confidence in the electrical generator model.
Conclusion
A dynamic model of the VHM has been presented and verified in this paper using near
sinusoidal displacement data. The model forms the basic building block to investigate the
performance and control of direct drive wave energy converters.
I-4. Dynamic Modeling of VHM 49
Acknowledgements
The authors would like to thank Durham University for providing facilities to do this work
and theEngineering andPhysical SciencesResearch Councilfor funding(Grant no. 38299).
References
[1] H. Weh, H. Hoffman, J. Landrath, “New Permanent Magnet Excited Synchronous Machine
with High Efficiency at Low Speeds”, Proceedings of the International Electrical Machines
Conference, Pisa, Italy, September 1988, pp. 35–40.
[2] B.C. Mecrow, A.G. Jack, “A New High Torque Density Permanent Magnet Machine Config-
uration”, Proceedings of the International Electrical Machines Conference, Cambridge, MA,
USA, September 1990.
[3] E. Spooner, L. Haydock, Vernier hybrid machines, IEE Proc. Part B Electr. Power Appl., Vol.
150, No. 6, pp. 655–662.
[4] M.A. Mueller, N.J. Baker, P.R.M. Brooking, J. Xiang, “Low Speed Linear Electrical Gen-
erators for Renewable Energy Applications”, Proceedings of the Linear Drives in Industrial
Applications Conference, Birmingham, UK, September 2003.
[5] M.A. Mueller, N.J. Baker, “A Low Speed Reciprocating Electrical Generator”, IEE Power
Electronics, Machines and Drives Conference, Bath, April 2002.
[6] H. Polinder, B.C. Mecrow, A.G. Jack, P. Dickinson, M.A. Mueller, “Linear Generators for
Direct Drive Wave Energy Converters”, Proceedings of the International Electrical Machines
and Drives Conference, Madison, WI, 2003.
[7] M.J. Tucker, Waves in Ocean Engineering: Measurement, Analysis, Interpretation, Ellis Hor-
wood Series in Marine Science, 1991, ISBN 0-13-932955-2.
[8] N.J. Baker, M.A. Mueller, P.J. Tavner, “Development of Reciprocating Test-Rig for Wave and
Tidal Power at the New and Renewable Energy Centre”, Proceedings of Marine Renewable
Energy Conference, Newcastle, July 2004.
[9] M.A. Mueller, N.J.Baker,Modelling theperformance ofthe vernier hybridmachine, IEEProc.
Part B Electr. Power Appl., Vol. 150, No. 6, pp. 649–654, 2003.
[10] J. Falnes, Ocean Wave and Oscillating Systems: Linear Interactions Including Wave-Energy
Extraction, Cambridge University Press, London, 2002, ISBN 0521782112.
I-5. FINITE ELEMENT ANALYSIS OF TWO
PM MOTORS WITH BURIED MAGNETS
J. Kolehmainen
ABB Oy, Electrical Machines, FI-65101 Vaasa, Finland
jere.kolehmainen@fi.abb.com
Abstract. In this paper, a permanent magnet synchronous motor (PMSM) with buried V-shape
magnets is compared to a motor with unusual design with buried U-shape magnets in every second
pole. It is shown that the motor design with U-shape magnets has same electrical properties than the
design with V-shape magnets.
Introduction
Permanent magnetsynchronous motors(PMSM) withburied magnetshavebeen considered
in a wide range of variable speed drives. A buried magnet design has many advantages
compared to designs with surface mounted and inset magnets. Flux concentration can be
achieved which induces higher air gap flux density. Higher air gap flux density give a
possibility to raise torque of a machine. The buried magnets construction also gives a
possibility to form air gap and get smoother torque [1]. The rotor can also be produced
easier. Some of the different rotor with buried magnets types are presented in Fig. 1.
Buried magnetdesigns give thepossibility to reducereluctance by narrowingand length-
eningthemagnetsbut keepingthe amountof themagnetsthe same.Byusingburiedmagnets
in V-shape or radial magnets, there are limits to reducing reluctance. Designs with U-shape
magnets inevery polehave goodproperties of bothdesigns withV-shape andradial magnets
[2]. However, with a design with U-shape magnets in every second pole it is possible to
reduce reluctance further.
In this paper two buried magnet machines are compared, one with V-shape magnets
and another with U-shape magnets in every second pole. The analysis is done by using
time stepping and static calculations with Finite Element Method (FEM) [3]. Also these
machines with different magnetic width and length are considered.
Motor designs
Both designs with buried magnets inside the rotor make the assembly of the rotor easier
comparedto theotherdesigns.Rotordisks keepthemagnets inplaceandnoextrareinforcing
bandage is needed. The magnets are inserted into punched slots in the laminated rotor iron.
The example of design with buried magnets in V-shape is shown in Fig. 2 and with buried
U-shape magnets in every second pole in Fig. 3.
S. Wiak, M. Dems, K. Kom
˛
eza (eds.), Recent Developments of Electrical Drives, 51–58.
C
2006 Springer.
52 Kolehmainen
a) b) c)
Figure 1. Rotor constructions of buried permanent magnet motors with (a) tangential magnets, (b)
radial magnets, and (c) V-shape magnets.
Figure 2. 12-pole PM motor design with magnets in V-shape.
Figure 3. 12-pole PM motor design with magnets in U-shape in every second pole.
I-5. Finite Element Analysis of PMSM with Buried Magnets 53
The only difference of these two motors is in their internal rotor structure. Areas of the
magnets are same and in the str ucture of Fig. 3 magnets per one pole are thinner and longer.
Also, a structure where magnets per one pole have same width and length is considered. In
addition, all sizes of the iron bridges between the magnets and air gap are the same.
The number of magnet pieces in U-shape design is also reduced to 3/4 of number in
V-shape design. This saves time for inserting magnets to rotor.
Calculation results
The electrical properties of the motors with V-shape and the U-shape designs are studied.
Studied motordata isshownin Table 1.Calculations aredone withthe time steppingmethod
with FEM [3]. Properties are studied with different loads.
In calculations voltage source and delta connection is used. Because of the different
structure of rotors, two poles of each construction are modeled. Circuit of calculations
is shown in Fig. 4. In the circuit there are three voltage sources, six winding connection
and three end winding resistances and three end winding inductances. In all time stepping
calculations, voltage angle of the stator and amplitude are same. Calculations are started
with different rotor angles and stopped when transient phenomena is over. Constant rotor
speed is used.
The flux lines of three example designs with nominal load are shown in Figs. 5–7. The
packing of the flux can also be seen. Every second pole in the U-shape designs is different
which means that the structure between two poles is not symmetric. In Figs. 5 and 6, total
length, width, and area of magnets per one rotor pole are same.
Fig. 8 shows flux densities in the stator teeth as a function of time with nominal load
calculations of V-shape and U-shapeA designs. The effect of difference of designs can be
Table 1. Motor data
Shaft height 280 mm
Power 27.5 kW
Voltage 370 V
Current 45 A
Pole number 12
Speed 300 rpm
Figure 4. Circuit used in calculations.
54 Kolehmainen
Figure 5. Packing of flux with nominal load and original design (V-shape).
seen. It is relatively small. It can also be seen that absolute value of flux is periodically
symmetric between two poles in our U-shapeA design. Flux is also symmetric with U-
shapeB design. No deviation of symmetry can be seen.
Fig. 9 shows flux densities of V-shape and U-shapeA designs produced only by magnets
in the stator teeth with different rotor angles. Length and width of magnets per one rotor
pole are same. Maximum and average flux densities of V-shape and U-shapeA designs are
1.463 T, 1.420 T and 0.932 T, 0.926 T. Flux densities with U-shapeA design is slightly
smaller because of small effect of gaps between the magnets.
Nominal and maximum loads of our three example designs are calculated with time
stepping calculations. In Table 2, the calculation results are compared to experimental
results of V-shape design. It can be seen that calculation of V-shape design gives a correct
Figure 6. Packing of flux with nominal load and new design A (U-shapeA).
I-5. Finite Element Analysis of PMSM with Buried Magnets 55
Figure 7. Packing of flux with nominal load and new design B (U-shapeB).
Figure 8. Flux densities of V-shape and U-shapeA designs in the stator teeth on one period with
nominal loads.
Figure 9. Flux densities of V-shape and U-shapeA designs produced only by magnets in the stator
teeth with different rotor angles.