Recent Developments of Electrical Drives - Part 12 docx
Bạn đang xem bản rút gọn của tài liệu. Xem và tải ngay bản đầy đủ của tài liệu tại đây (380.78 KB, 10 trang )
I-9. Torque Ripple in Inverter Driven Induction Motors 97
V
C
A
B
C
H
V
A
V
B
E/2
E/2
Figure 3. A basic inverter-induction motor drive.
Drive system model
An inverter driven inductionmotor canbe modeledby combiningthe spacephasor model of
the machine with the supply model representing the non-sinusoidal voltage source inverter.
Fig. 3 illustrates the ensuing model.
All electromagnetic terms in (15) and (16) are expressed as space phasors by advancing
from the actual three-phase machine model to an orthogonal model with alpha-beta and
d-q windings, the voltages and currents of which are combined to give a deceptively simple
representation of the drive system. Furthermore, it becomes possible to assess the effects of
supply harmonics by simply including (or injecting) the significant supply harmonics into
˜
U
S
of (15).
Simulation results
The simulated alpha-beta terminal voltages containing the significant harmonics have been
drawn into the simulation. With these voltages the ripple torque for no-load and load con-
ditions shown in Figs. 4 and 5 are predicted, obtained by solving the system equations of
(15) to (17).
The simulation results show that the torque ripple is already of a considerable magnitude
when the motor is not loaded. Under load, the ripple band is seen to widen. Electromagnetic
quantities not shown here provide supportive evidence for the deterioration. The results are
significant in that they indicate that the simulation method used is capable of estimating
parasitic torque behavior in advance.
Experimental verification
The validity of the approach was tested experimentally for an inverter driven three-phase
cage induction motor of 1.5 kW rating. Field orientation control with strong overmodula-
tion was employed, resulting in supply harmonics both the order and magnitude of which
resembled that of the six-step inverter at the motor terminals. Table 1 gives the relevant data
for the test motor with which the foregoing simulations were conducted.
Fig. 6 depicts the measured torque ripple band under steady state operating conditions
with full load. As can be seen, both the behavior and the relative magnitude of the torque
reflect strongly those of the simulation. Fig. 7 gives the torque ripple at no load. The ripple
magnitude is seen to have increased with load when compared with the no-load regime: an
observation which is also supported by simulation.
98 G¨ol et al.
0 0.01 0.02 0.03 0.04 0.05 0.06 0.07 0.08 0.09 0.1
–1
–0.5
0
0.5
1
1.5
2
2.5
3
T
el
[Nm]
t
[s]
Figure 4. Torque ripple at no load (simulated).
0 0.01 0.02 0.03 0.04 0.05 0.06 0.07 0.08 0.09 0.1
8
8.5
9
9.5
10
10.5
11
11.5
12
12.5
13
T
el
[Nm]
t
[s]
Figure 5. Torque ripple at full load (simulated).
I-9. Torque Ripple in Inverter Driven Induction Motors 99
Table 1. Data for the test motor
Number of pole pairs (P)2
Rated voltage (U
N
) 380/220 Y/ V
Rated frequency (F)50Hz
Rated power (P
N
) 1.5 kW
Rated speed (n
N
) 1,405 rpm
Rated current (I
N
) 3.7 A
Main inductance (L
1h
) 382 mH
Stator inductance (L
s
) 396 mH
Rotor inductance (L
r
) 393 mH
Stator resistance (22
◦
C) (R
s
) 5.0
Rotor resistance (22
◦
C) (R
r
) 4.1
Rotor inertia (J
r
) 0.008 kgm
2
0 0.01 0.02 0.03 0.04 0.05 0.06 0.07 0.08 0.09 0.1
–1
0
1
2
3
t
[s]
T
el
[Nm]
Figure 6. Torque ripple at no load (measured).
0 0.01 0.02 0.03 0.04 0.05 0.06 0.07 0.08 0.09 0.1
8
9
10
11
12
13
t
[s]
T
el
[Nm]
Figure 7. Torque ripple at full load (measured).
100 G¨ol et al.
Evidently, the simple model representation does not allow the fine detail in the ripple
band to be predicted in detail including the measured swings in the torque fluctuations.
However the approximation achieved is satisfying.
Conclusion
The intuitive method of analysis based on the space phasor concept yields adequately ac-
curate information about the nature of possible ripple torque generation in inverter driven
induction motors. It is easy to assimilate and produces credible results with minimal com-
putational effort. Although the approach has beendemonstrated for a six-step inverter drive,
it is equally applicable to more sophisticated drive systems.
References
[1] T. Lipo, P.C. Krause, H.E. Jordan, Harmonic torque and speed pulsations in a rectifier-inverter
induction motor drive, IEEE Trans., Vol. PAS-88, No. 5, pp. 579–587, 1969.
[2] S.T.D. Robertson, K.M. Hebbar, Torque pulsations in induction motors with inverter drives,
IEEE Trans. Ind. Gen. Appl., Vol. IGA-7, No. 2, pp. 318–323, 1971.
[3] G.B. Klimann, A.B. Plunkett, Modulation strategy for a PWM inverter drive, IEEE Trans. Ind.
Appl., Vol. IA-15, No.1, pp. 72–79, 1979.
[4] K.P. Kovacs, J. Racz, Transiente Vorg¨ange in Wechselstrommaschinen, Budapest: Academiai
Kiado, 1959.
[5] R.J.W. Koopman, Direct simulation of AC machinery including third-harmonic effects, IEEE
Trans. Power Apparatus Syst., Vol. PAS 88, No. 4, pp. 465–470, 1969.
[6] R.H. Park, Two-reaction theory of synchronous machinery—Part I, AIEE Trans., Vol. 48,
pp. 716–730, 1929.
I-10. VIBRO-ACOUSTIC OPTIMIZATION
OF A PERMANENT MAGNET
SYNCHRONOUS MACHINE USING THE
EXPERIMENTAL DESIGN METHOD
S. Vivier
1
, A. Ait-Hammouda
1
, M. Hecquet
1
, B. Napame
1
,
P. Brochet
1
and A. Randria
2
1
L2EP—Ecole Centrale de LILLE Ecole Centrale de Lille, Cit´e scientifique, B.P. 48, 59651
Villeneuve D’Ascq Cedex, France
, ,
, ,
2
Alstom—2 Av de Lattre de Tassigny, 25290 Ornans, France
Abstract. The aim of this paper is to use an analytical multi-physical model—electromagnetic,
mechanic, and acoustic—in order to predict the electromagnetic noise of a permanent magnet syn-
chronous machine (PMSM). Afterward, the experimental design method, with a particular design:
“trellis design,” is used to build response surfaces of the noise with respect to the main factors. These
surfaces can be used to find the optimal design or more simply, to avoid unacceptable designs of the
machine, in term of noise for a variable speed application.
Introduction
The majority of the electric machines operate at variable speed. In most of cases, it involves
a generation of noise and vibrations, for a given speed and frequency.
For industries of manufacture, but also with the increasingly rigorous European stan-
dards, it is necessary to take into account the noise and the vibrations from the design
stage.
Aclassicalmethod used to studyelectromagneticphenomena is the finiteelementmethod
(FEM) in magneto-dynamics including the coupling with electrical circuits. However, in
the case of strong coupling, taking into account the electromagnetic, vibro-acoustic, and
thermic models in the same time would need a considerable computing effort. This would
make the structure optimization practically impossible. In order to solve this problem, an
analytical approach is considered instead.
The aim of this work is to develop and use an analytical multi-physical model—
electromagnetic, mechanic, and acoustic—of a synchronous machine with permanent mag-
nets. The complete model is coded using the data-processing tool MATLAB
R
, making
possible the determination of fast and simple prediction models of the acoustic noise.
S. Wiak, M. Dems, K. Kom
˛
eza (eds.), Recent Developments of Electrical Drives, 101–114.
C
2006 Springer.
102 Vivier et al.
–600000.0–800000.0
0.0
0.2
0.4
0.6
0.8
1.0
1.2
1.4
1.6
B [T]
–400000.0 –200000.0
H [A m
–1
]
Figure 1. 1/8 of synchronous machine with magnet characteristic.
In order to reduce noises and vibrations, two main ways can be considered: by the control
of the machine excitation [1], or by modifying the system structure. In this work, only the
second solution is explored.
Three models are presented: electromagnetic, mechanical of vibration, and acoustic. For
each of them, comparisons with FEM and experiments have been made.
Lastly, a study of sensitivity is presented in order to deduce the influential—or
significant—factors on the noise. For that, the technique of the experimental designs is
used. More particularly, the modeling of the noise will be achieved thanks to the new “trel-
lis” designs. Several response surfaces are given; they represent the noise according to
influential factors, with respect to different speeds of the machine.
These surfaces are useful to deduce the parts of the design space to avoid.
Presentation of the synchronous machine
This machine is composed of eight rotor poles and 48stator slots. The powerof this machine
is about 250 kW (Fig. 1).
Analytical models
The vibration analysis of electrical machines is a rather old problem. During the 40s and 50s,
itwasdeeplystudiedbyvariousresearchers[2to5].Vibrationsofelectromechanicalsystems
are due to excitation forces. Some of them have a magnetic origin. Other sources of vibra-
tions, such as aerodynamic conditions, bearings, etc., will not be considered in this paper.
An analytical model, considering electromagnetic phenomena, mechanical vibrations,
and acoustic noises, was developed to take into account the overall noise produced by a
variable induction in the air-gap [6 to 9] and by forces applied to the various structures.
I-10. Permanent Magnet Synchronous Machine 103
0 10 20 30 40 50 60 70 80 90
-1
-0.8
-0.6
-0.4
-0.2
0
0.2
0.4
0.6
0.8
1
Amplitude [Tesla]
Angle [°]
0 5 10 15 20 25 30
0
0.1
0.2
0.3
0.4
0.5
0.6
0.7
0.8
Amplitude [tesla]
Spectrum of Induction
F.E.M
Analytical Model
F.E.M
Analytical model
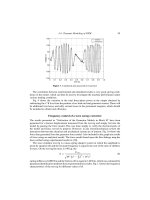
Figure 2. Comparison of the form induction and FFT.
Electromagnetic model
It is assumed that forces in the air-gap of the machine are the main mechanical excitation.
To characterize induction in the air-gap, the proposed method is based on the calculation of
the air-gap permeance (P
e
) and the magnetomotive force (mmf ) [6 to 8]. To establish the
analytical expression of the permeance, some assumptions are made:
r
the magnetic circuit has a high permeability and a linear characteristic,
r
the tangential component of the air-gap flux density is negligible relative to the radial
component.
Results are given in Ref. [10] and just a comparison is recalled by Fig. 2.
Using the finite element software OPERA-2D [11], the air-gap induction created by
the magnet rotor as a function of space and time has been also calculated. In Fig. 2, a
comparison on induction wave shapes vs. the angle is presented. The comparison results are
very satisfactory, the induction distribution and the harmonic values determined analytically
are validated numerically, as shown in Refs. [6,12].
The FFT of the radial forces vs. time (t) and angle (θ ) is presented below in Fig. 3.
Vibratory model
Vibrations are the consequence of the excitation of the mechanical system by electro-
magnetic forces. Once the forces applied to the stator have been determined, the study of
vibrations is possible. They correspond to the deformations whose amplitudes have to be
calculated. For that purpose, some parameters have to be determined:
r
the damping,
r
the mode shapes and resonance frequencies for each mode.
104 Vivier et al.
(2p,2fr) (4p,4fr) (8p,8fr)
t
θ
Amplitude
Figure 3. FFT 2D of radial force ( f
r
= p
N).
For the damping coefficient, we have used the experimental measurements and the software
PULSE [13] to determine the resonance frequencies, the mode shapes, and the damping.
For example, some results are detailed in Fig. 4.
The studied analytical model takes into account the yoke, the frame, the teeth, and
the winding. The self vibration modes of the stator structure are determined, in various
configurations: yoke only, yoke + teeth, yoke + teeth + carcass, and yoke + teeth +
winding + carcass [14].
Mode 2
376 Hz (3.32%)
Mode 3
1004 Hz (1.44%)
Mode 4
1720 Hz (1.31%)
Mode 5
2870 Hz (1.54%)
Figure 4. Mode shape, resonance frequencies with (damping coefficient) obtained by measurements.
I-10. Permanent Magnet Synchronous Machine 105
Table 1. Resonance frequencies (Hz) for each mode
No. mode Analytical model FEM No. mode Analytical model Experimental
0 3,063 3,151 0 2,736 2,855 (1.46)
2 243 268 2 308 376 (3.32)
416 (3.22)
3 688 732 3 871 1,004 (1.44)
1,140 (1.74)
4 1,319 1,349 4 1,670 1,720 (1.31)
1,968 (2.44)
5 2,134 2,078 5 2,702 2,870 (1.54)
2,944 (1.46)
(yoke and teeth only) (Complete stator: yoke + teeth + winding + carcass)
Some results are presented in Table 1, with an experimental comparison.
Resonance frequencies of the stator have been obtained by impact testing measurements,
realized thanks to the impact test method. The comparison of the results with the analytical
model are very satisfactory.
Let us note that the damping coefficient ξ
a
cannot be given theoretically. However,
Jordan [4] considers that for a synchronous machine, it stands between 0.01 and 0.04
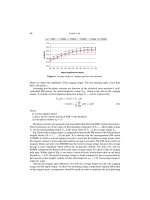
(Table 2). The total vibratory spectrum obtained by our analytical model is presented in
Fig. 5.
The simulation results agree well with the theory. In addition, the proximity of the fre-
quencyofexcitationmode0withthefrequencyoftheresonantmode0(at2,844Hz) explains
the vibration peak located around 2,900 Hz. However let us point out that precautions must
be taken when analyzing the results.
The model giving the induction values is not perfect (the saturation phenomenon is
neglected) and the formulae of Timar [3] giving the vibrations are also approximated. What
is of interest is to determine the frequency of the main peaks and to be able to range their
amplitudes.
In order to study the vibrations generated by the operating conditions, an accelerometer
is positioned on the frame of the machine. It measures the deformations of the frame. The
vibratory spectrum gives lines identical to those obtained by the noise measurement; it
displays a dominant line situated at 2,900 Hz, that corresponds to the theoretical excitation
mode 0 predicted at 2,844 Hz (Fig. 6).
Table 2. Main characteristics of the machine
Speed 3,555 rpm
Frequency of the supply f
r
237
Rotational frequency f
rot
237/p
Frequencies of components of forces h ∗ 237(h = 2, 4, 6, )
(multiple of 2 f )
106 Vivier et al.
0 1000 2000 3000 4000 5000 6000
0
20
40
60
80
100
120
474 Hz
945 Hz
2844 Hz
3318 Hz
Figure 5. Total analytical vibratory spectrum with 3,555 rpm.
In order to study the vibrations generated by the operating conditions, an accelerometer
is positioned on the frame of the machine. It measures the deformations of the frame. The
vibratory spectrum gives lines identical to those obtained by the noise measurement; it
displays a dominant line situated at 2,900 Hz, that corresponds to the theoretical excitation
mode 0 predicted at 2,844 Hz (Fig. 6).
486
244
58
23
5158
2900
0
20
40
60
80
100
120
140
Frequency Hz
Amplitude dB
Figure 6. Vibratory spectrum measured with 3,555 rpm with 1/12 of octave.