Recent Developments of Electrical Drives - Part 13 ppsx
Bạn đang xem bản rút gọn của tài liệu. Xem và tải ngay bản đầy đủ của tài liệu tại đây (653.68 KB, 10 trang )
I-10. Permanent Magnet Synchronous Machine 107
Acoustic model
Acoustic intensity I(x) can be written as a function of the frequency, the amplitude of
vibrations, the mode order and the stator surface [5,9].
I(x) =
σ 8200 f
2
r
Y
2
md
S
e
4π x
2
(2m + 1)
The coefficient σ is called factor of radiation. It represents the capacity of a machine to
be a good sound generator and can be calculated through two different ways according
to whether one assumes the machine to be a sphere or a cylinder. σ is a factor which
varies with λ (wavelength) and the diameter of the machine. It also depends on the mode
shape [3]:
σ = f
π
D
λ
,λ=
c
f
r
c: Traveling speed of sound (344 m/s); f
r
:Vibration frequency.
It appears that I(x) is inversely proportional to the order of the mode, in addition the
acoustic intensity is proportional to the square of the vibration amplitude. In general, we
define I and W in decibels. We thus definethe levels of acoustic pressure, acoustic intensity,
and sound power as follows:
L
p
= 20 log
P
P
0
, L
i
= 10 log
I
I
0
, L
w
= 10 log
W
W
0
with:
P
0
= 20 μPa, I
0
= 10
−12
W/m
2
, W
0
= 10
−12
W
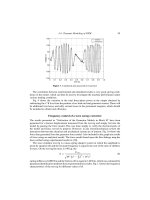
The spectrum of the total noise obtained by our analytical model is presented below (Fig. 7).
0 1000 2000 3000 4000 5000 6000
0
20
40
60
80
100
120
2844 Hz
3318 Hz
5688 Hz
Frequency Hz
12f
14f
m=0
m=8
Figure 7. Spectrum of the noise of the simulated PMSM.
108 Vivier et al.
24
2900
459
58
4597
244
91
183
15
25
35
45
55
65
75
85
95
0,37 0,82 1,83 4,1 9,17 20,54 45,97 102,92 230,41 515,82 1154,78 2585,23
Frequency Hz
Amplitude dB
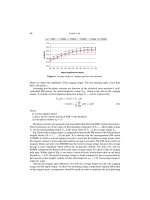
122f
f
Figure 8. Spectrum of the noise of PMSM measured with 3,555 rpm (1/12 octave).
Fig. 8 presents the measured acoustic noise spectrum at the same speed (3,555 rpm).
Lines are located at the same frequencies as in the vibration spectrum.
The first line determined by measurements is located at 2,900 Hz (12 f ). In theory, the
harmonic of teeth (12 f ) is located at 2,844 Hz.
The lines at low frequencies (between 24 and 459 Hz) are not found in theory, because
they are mainly related to the background noise. They are not generated by the PMSM, but
by the driving motor and the ventilator (Fig. 9).
23
434
183
91
52
15
25
35
45
55
65
75
85
95
0,37
0,87
2,05
4,87
11,55
27,38
64,94
153,99
365,17
865,96
2053,5
4869,7
Frequency Hz
Amplitude dB
Figure 9. Spectrum of the noise of driving motor and ventilator measured with 3,555 rpm (1/12
octave).
I-10. Permanent Magnet Synchronous Machine 109
1894 rpm
860 rpm
2469 rpm
3555 rpm
3165 rpm
3945 rpm
860 rpm
3555 rpm
3945 rpm
3165 rpm
1894 rpm 2469 rpm
0
10
20
30
40
50
60
70
80
90
100
110
120
130
140
0 300 600 900 1200 1500 1800 2100 2400 2700 3000 3300 3600
simulations
measures
Experimental frequency of
resonance F
0
= 2855 Hz
Frequency Hz
Amplitude dB
Figure 10. Level of the 12th harmonic vs. rotation speed. Vibratory comparisons.
After this comparison,the permanent magnet synchronousmachine was tested at various
speeds, that allowed us to highlight a particularly dangerous speed. Moreover, some results
are overestimated but the quality of those is respected (Fig. 10). In spite of the inaccuracies,
major lines appear, which is of primary importance in view of noise reduction.
To know which lines to reduce does not require to know its amplitude precisely. Its
frequency, on the other hand, must be well given. Lastly, taking into account the complexity
of the studied phenomena and the many steps of calculations making it possible to lead to
the results, the latter seem very satisfactory.
Screening analysis
Once the differentmodels finalized and assembled into a single “coupled model,” it becomes
possibleto studythe variations of the mainvariables representing the vibrationsources. This
is achieved by the building of response surfaces, and by the launching of optimizations. The
privileged tool employed is the Experimental Design Method [15,16].
First of all, a sensibility analysis using the global coupled model is described.
The overall audible noise produced by the synchronous machine stands as the studied
variable (the response). An analytical relation linking the noiseamplitude withfive variation
sources (the factors) has been established:
r
the stator slot opening (l
se
);
r
the height of the yoke (h
yoke
);
r
the opening of permanent magnet (alp);
r
the width of the air-gap (e);
r
the height of the permanent magnet (h
mag
).
A screening design [17] is calculated. It gives the ability to determine the influent factors,
with respect to the response, inside the design space. This domain is implicitly defined by
the intervals of variation, for the five factors (Table 3).
The Fig. 11 gives a representation of the influence of each factor on the noise.
Firstly, it shows that the opening of the permanent magnets (alp) is a very influential
factor, since its variation from its middle value (31
◦
) to its upper limit (32
◦
) makes the noise
increase by about 15 dB.
110 Vivier et al.
Table 3. Intervals of variation—screening analysis
Factors Lower bound Upper bound
l
se
l
se
min l
se
min + 20%
h
yoke
h
yoke
min h
yoke
min + 20%
Alp 30
◦
32
◦
Ee
min
e
min
+ 20%
h
mag
10 mm 12 mm
0
2
4
6
8
10
12
14
Effects
0.2147895%
h
yoke
h
mag
e alp lse
Figure 11. Factor influences on the noise amplitude.
The height of the yoke (h
yoke
), the width of the air-gap (e), and the stator slot opening
(l
se
) are also significant factors according to this figure, since they all exceed the two 95%
significance levels. It means that the probability to declare these factor influential although
they are not, is equal to 5%. They all have a negative influence on the noise variations: their
values have to be increased to reduce the noise amplitude.
The height of the magnets (h
mag
) is not considered as an influent factor, if the same
significance level is used.
It isimportant to keep in mind that these conclusions only hold inside the design domain.
The previous results have been obtained for a fixed rotor speed (3,000 rpm). Imposing
different speeds do not change the relative influence of the factors. However, one can say
that effect values increase for speeds around 3,000 rpm. This aspect will be confirmed by
the following study.
Research of optimal conditions
In a second stage, our purpose was to “model” the part of the conception domain in which
the global audible noise produced by the PMSM was smaller than a predefined limit: 80
I-10. Permanent Magnet Synchronous Machine 111
Table 4. Intervals of variation—modeling stage
Factors Lower bound Upper bound
l
se
l
se
min l
se
min + 20%
h
yoke
h
yoke
min h
yoke
min + 50%
alp 26
◦
34
◦
ee
min
e
min
+ 50%
N 3,500 rpm 4,500 rpm
dB was considered as the maximal admissible noise intensity. This frontier for the noise—
the response—has been computed with respect the same factors except the height of the
permanent magnet (h
mag
) and in addition, the motor speed (N).
These factors have been selected thanks to screening analyses realized with the complete
coupled model. Their intervals of variation are given by Table 4.
Since we want to have a good description of the variations of the noise with respect to
the five factors, it is necessary to increase the number of the different levels taken by each
factor. Considering five levels is in general enough. Such a configuration leads to 5
5
=
3,125 experiments with the use of a grid design—that is a multi-level full factorial design.
This number of evaluations of the coupled model is relatively large, and it can be interesting
to take advantage of the new “trellis” deigns [17].
Trellis designs canbe describedas multi-level fractional grid design. They are buildfrom
fractional two-levelfactorial designs judiciouslysuperposed (Fig.12). For this reason, under
important hypotheses, they keep their interesting mathematical characteristics, such as for
instance the orthogonality property.
When five factors are present, it is possible to usethe two-level fractional factorial design
defined as 2
5−2
, that is the quarter (2
2
= 4) of the corresponding full factorial design 2
5
.
When this design is used to build the trellis design, it leads to definition of a five-level
incomplete grid, with only 795 experiments—instead of 3,125 with a complete grid. It
takes approximately 16 h to compute this trellis design on a PC.
Instead of using the 795 values of noise directly, we have exploited the interesting
relative location of the experiments inside the design domain: an iterative procedure has
been applied to estimate the noise values for each of the 3, 125 − 795 = 2,330 initially
nonevaluated experiments. It has been shown that the overall error made for these 2,330
interpolations, realized thanks to the 795 initial experiments, is lower than 0.8%.
Figure 12. Example of experiment sharing between two fractional designs (2
3−1
).
112 Vivier et al.
26
28
30
32
34
2500
3000
3500
4000
4500
50
55
60
65
70
75
80
85
alp (°)
Noise (dB)
N (rpm)
Figure 13. Noise variations vs. “alp” and “N.”
The differentresults that followare deducedfrom the 795first experimental points mixed
with the estimated ones.
It quickly appeared that the opening of the permanent magnets (alp) and the motor
speed (N) were the two most influential variables over the noise production. The following
response surface shows the corresponding variations, as shown in Fig. 13.
It is very clear that the noise is strongly reduced when the permanent magnet area—
in fact the corresponding angular opening—is equal to 30
◦
. This result is confirmed by
practical considerations.
The rotor speed has also a neat influence over the noise production. A reso-
nance phenomenon is visible near the speed value 3,500 rpm, whatever the factor alp
values.
The influence of the three other factors are relatively small in comparison. However, we
can notice that the decrease of h
yoke
leads to move the resonance point toward lower rotation
speed values.
The 80 dB limit can be graphically represented with respect to alp, N, and h
yoke
, thanks
to iso-value surfaces (Fig. 14).
Two iso-value surfaces are represented: one showing the noise equal to 80 dB, and the
other to 84 dB. The graphic is nearly symmetrical: 30
◦
standing as the central value for the
magnet opening (alp). Then, the admissible subspace of the conception domain is modeled
by the zone delimited by the two central 80 dB surfaces. This indicates that it is always
possibleto conceive a PMSM.generating anoise lowerthan 80 dB,providedthat the magnet
I-10. Permanent Magnet Synchronous Machine 113
Figure 14. Noise iso-value surfaces (80 and 84 dB) vs. “N,” “h
yoke
”, and “alp.”
opening is chosen between 28.5
◦
and 31.5
◦
. This interval can be extended for particular
rotor speeds greater than 4,000 rpm or lower than 2,700 rpm.
Conclusion
The purpose of this work is to present some results obtained from the exploitation of a
complete coupled model of a permanent magnet synchronous machine. Different multi-
physical aspects are considered: electromagnetic, mechanic, and acoustic phenomena are
taken into account thanks to a single analytical model.
The Experimental Design Method is the privileged tool used to make the complex rela-
tionships between the main variables appear.
The first study—a screening analysis—shows that, whatever the rotor speed considered,
the angular opening is a very influential factor: the particular value 30
◦
is certainly the best
choice. It is more difficult to set the other factors, since the rotor speed interacts with them.
However, the height of thepermanent magnets is declared nonsignificant in term of acoustic
noise.
The second study is designed to work on more precise data. For that purpose, a trellis
design with five levels per factor and only 795 experiments, is computed. The advantageous
properties of this typeof design allow the subsequent evaluations of 2,330 other points, with
an excellent accuracy, leading to practical design choices for lowering the limited noise.
114 Vivier et al.
References
[1] M. Gabsi, “Conception de machines sp´eciales et de leurs alimentations. R´eduction du bruit
d’origine ´electromagn´etique”, Habilitation `a diriger des recherches, Juillet 1999.
[2] S. Timochenko, Th´eorie des vibrations, Librairie Polytechnique CH Beranger, 1939.
[3] P.L. Timar, Noise and Vibration of Electrical Machines, Elsevier, 1989.
[4] H. Jordan, Electric Motor Silencer—Formation and Elimination of the Noises in the Electric
Motors, W. Giradet-Essen Editor, 1950.
[5] S.J. Jang, Low-Noise Electrical Motors, Oxford: Clarendon Press, 1981.
[6] N. Boules, Predictionof no-load flux density distribution in permanent magnet machines,IEEE
Trans. Ind. Appl., Vol. IA 21, No. 4, pp. 121–124, 1985.
[7] J.D.L. Ree, N. Boules, Torque production in permanent magnet synchronous motors, IEEE
Ind. Appl. Soc. Conf. Rec., Vol. 87, pp. 15–20, 1987.
[8] Z.Q. Zhu, D. Howe, Instantaneous magnetic field distribution in brushless permanent mag-
net DC motors. Part III: Effect of stator slotting field, IEEE Trans. Magn., Vol. 29, No. 1,
pp. 143–151, 1993.
[9] R. Corton, Bruit magn´etique des machines asynchrones, proc´edure de r´eduction passive et
active, th`ese, 2000, Universit´e d’Artois, France.
[10] A. Ait-hammouda, M. Hecquet, M. Goueygou, P. Brochet, A. Randria, “Analytical Approach
to Study Noise and Vibration of a Synchronous Permanent Magnet Machine”, ISEF’2003,
Maribor, September 18, 2003, CD.
[11] OPERA
2D, Reference Manual, VECTOR FIELDS, tor-field.co.uk.
[12] R.Breahna, P. Viarouge, “Space and Time Harmonics Interactions in SynchronousMachines”,
Proceedings of Electrimacs, 1999, pp. 45–50.
[13] Br¨uel and Kjaer, PULSE System: Modal Test Consultant, .
[14] S.P. Verma, L. Wen, “Experimental Procedures for Measurement of Vibration and Radiated
Acoustic Noise of Electrical Machines”, Power System Research Group 2002, ICEM 2002,
p. 432.
[15] J.J. Droesbeke, J. Fine, G. Saporta, Plans d’exp´eriences—Applications `a l’entreprise, Ed.
TECHNIP, 1997.
[16] J. Goupy, La M´ethode des plans d’Exp´eriences, Paris: Dunod, 1988.
[17] S. Vivier, “Strat´egies d’optimisation par plans d’exp´eriences et Application aux dispositifs
´electrotechniques mod´elis´es par ´el´ements finis”, Th`ese de doctorat, Universit´e des Sciences et
Techniques de Lille, July 2002.
I-11. ELECTROMAGNETIC FORCES AND
MECHANICAL OSCILLATIONS OF THE
STATOR END WINDING OF TURBO
GENERATORS
A. Gr¨uning and S. Kulig
Institute of Electrical Drives and Mechatronics, University of Dortmund,
D-44227 Dortmund, Germany,
,
Abstract. Numerical methods of calculating the electromagnetic forces and of simulating the oscilla-
tion behavior of the stator end winding are introduced. The end winding oscillations of different turbo
generators under forced vibrations are computed in a combined simulation. Also eigenfrequencies
and eigenmodes are determined. The obtained results are surveyed by measurements. Numerical sim-
ulation of oscillation behavior is found a useful tool in end winding design although model parameter
identification still offers improvement potential.
Introduction
Due to the complex structure, the design of the stator end winding of large turbo generators
and especially of the appendant support fixture still offers a huge potential for optimization.
Primarily the capability of the stator end winding to perform oscillations owing to the
operant electromagnetic forces and the resultant eventuality of damages like fatigue or even
cracks of the insulation gives reason to accomplish improvements [1].
When optimizing the end winding support fixture in order to reduce the occurring os-
cillations and therewith the risk of damages, detailed knowledge of the vibration behavior
under steady-state as well as under transient conditions is very beneficial.
The most viable method to obtain this knowledge is the accomplishment of numerical
computer simulations, whereas detailed measurements aredifficult to perform and therefore
only sometimes used to verify the simulation results. As can be seen in Fig. 1, the stator end
winding of a turbo generator is a very complex entity with a huge number of components
of different mechanical properties. But due to the support fixture it is also acting as a
complex composite structure. Therefore the appliance of simulation methods using a three-
dimensional model of the complete end winding is precondition for obtaining reliable and
useful results.
In this connectionnumerical simulation methodsbased on a three-dimensional modeling
of the end region and facilitating investigations of the vibration behavior under various
operation modes become increasingly the aim of development.
S. Wiak, M. Dems, K. Kom
˛
eza (eds.), Recent Developments of Electrical Drives, 115–126.
C
2006 Springer.
116 Gr¨uning and Kulig
Figure 1. Stator end winding.
In terms of the impact on the stator end winding a certain mode of operation can be
characterized by the currents in the windings and, if the influence of the rotor winding is
taken into account, the rotor movement, which determines the position of the rotor winding.
On this account the procedure of investigating the vibration behavior of the stator end
winding comprises the electromagnetic computation of the three-dimensional distribution
of the forces generated by the currents and afterwardthe three-dimensional simulationof the
mechanical oscillation dueto these forces. The implementationof such a simulation method
represents an interdisciplinary task combining electromagnetic and mechanical problems
[2].
The present paper summarizes the results of an investigation, which was performed by
a team of mechanical and electrical engineers over a period of about five years, concerned
with the development and coupling of three-dimensional numerical electromagnetic and
mechanical simulation methods.
Electromagnetic simulation
A numerical simulation method based on the application of Biot-Savart’s law to line circuit
segments was used to compute the three-dimensional distribution of electromagnetic forces
acting on the stator end winding.
Computing the magnetic flux density B by Biot-Savart’s law, materials with non-linear
magnetization characteristics like iron cannot be considered directly. A practicable way
to use this method nevertheless is to replace all iron parts by additional fictive current
distributions emulating the influence of the iron parts on the magnetic field, according to