Recent Developments of Electrical Drives - Part 14 pptx
Bạn đang xem bản rút gọn của tài liệu. Xem và tải ngay bản đầy đủ của tài liệu tại đây (1.54 MB, 10 trang )
I-11. Electromagnetic Forces and Mechanical Oscillations 117
the method of images. The consideration of both the original circuits and the additional
fictive current distributions as line circuits enables the application of Biot-Savart’s law in
the following form:
→
B =
μ
0
I
4π
·
→
dl ×
→
r
r
3
(1)
In a numerical computation of the flux density B generatedby a three-dimensional assembly
of line circuits, these can be modeled by discrete line circuit segments. B is obtained using
the principle of superposition after applying a discrete form of (1) to each segment.
The three-dimensional distribution of electromagnetic forces can afterward be obtained
by computing the vector of force acting on each discrete line circuit segment of the length
l and carrying the current I using Lorentz’ law [3]:
→
F = I · (
→
l ×
→
B ) (2)
By using line circuits instead of conductors with a finite cross section and a given current
density it may be expected that the forces will be computed up to 25% to high [3]. But due to
the fact that both the modeling effort and the computing time could be reduced substantially
this simplification was found admissible.
Thedescribedmethodwasimplemented inanumerical computationprogram andapplied
to calculate the three-dimensional distribution of electromagnetic forces acting on the stator
end winding of different turbo generators.
A typical three-dimensional model of the end region used in the computation is shown
in Fig. 2. It consists predominantly of the line circuit segments modeling the bars of the
stator end winding.
The influence of the rotor end winding is not directly taken into account. Instead of
that the magnetic flux generated by the rotor is emulated by line circuits in the area of the
retaining ring. The assumption underlying this simplification is, that the stator flux during
transients is approximately mirrored by the rotor. Therefore the currents in these additional
line circuits are equal to the currents in the stator windings but have opposite direction.
Figure 2. End winding model for electromagnetic force computation.
118 Gr¨uning and Kulig
The influence of the stator core is considered according to the method of images by
mirroring the complete model of line circuits at the end core plane. The impact of other
magnetizable parts in the end region, like the rotor shaft, is neglected [3].
Additional investigations performed in [4] and also by the authors showed that both the
influence of the rotor shaft and the influence of the end core plane are of minor importance.
By repeated computations the applied method is able to calculate discrete time functions
of the electromagnetic forces using discrete time functions of currents as input data. Thus
it was possible to investigate the transient behavior of the electromagnetic forces, like for
example during a three-phase terminal short circuit, which represents the standard check of
large electrical machines previous to initial operation.
Before accomplishing the force computation the discrete time functions of the currents
in the stator windings have to be determined. Due to the fact that measurements with a
sufficient time resolution are rare, the currents were computed using the numerical net-
work simulation program NETOMAC [5], based on the Park transformation. As a likewise
practicable method to obtain discrete time functions of currents, also a two-dimensional
finite-difference time-stepping method as described in [6] was applied. Using the finite-
difference method more accurate results with differences to measurements of less than 5%
can be obtained, but at the price of an extensively longer computation time [1].
In order to be impressed on the nodes of the mechanical finite-element model, the results
of the electromagnetic force computation are given by force vectors instead of uniform
loads. The magnitude of the force vector acting on a certain node is therefore dependent on
the length of the respective line circuit segment, whichhastobeconsideredwhen discussing
the force distribution. Depending on the treated generator the number of nodes differs from
about 500 to about 2,000, with three time functions of the force components at each node.
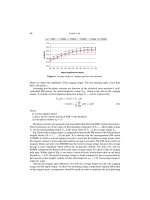
The electromagnetic forces acting on the end winding of a 90 MVA two-pole turbo
generator during a three-phase short circuit are given in Fig. 3, Fig. 4 shows the forces on
the end winding of a 1,500 MVA four-pole generator.
Figure 3. Forces on the end winding of a two-pole generator.
I-11. Electromagnetic Forces and Mechanical Oscillations 119
Figure 4. Forces on the end winding of a four-pole generator.
Both figures show the force distribution at a moment 10 ms after short circuit occur-
rence, when the currents in the stator windings approximately reach their maximum values.
Whereas the maximum forces on the end winding of the two-pole generator occur approxi-
mately at the same time, the maximum forces on the four-pole generator end winding occur
earlier, approximately 8 ms after short circuit occurrence.
The highest magnitudes in the force distribution occur in the area of the involute parts of
the windingcoilsnearertothe end core plane.Inbothforcedistributions the number ofpoles
of the corresponding generator is visible. Beside radial and tangential force components
also strong axial force components occur.
The maximumuniformloadsactingon the endwindingofthetwo-polegeneratoramount
to approximately 40,000 N/m, in the four-pole generator the uniform loads reach val-
ues around 70,000 N/m. This corresponds to the higher power density of the four-pole
generator.
Figs. 5 and 6 show the force distribution of both the two-pole and the four-pole generator
in a plane parallel to the end core plane at different moments around the occurrence of
the force maximum. In both figures the force distribution enables the classification of the
winding coils corresponding to the respective phase. Indeed the force distribution is non-
sinusoidal [1].
As can be seen in Fig. 6, the tangential components in the force distribution of the four-
pole generator are much more pronounced than in the force distribution of the two-pole
generator.
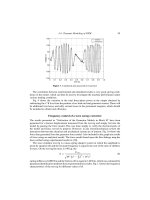
Fig. 7 shows the time functions of the force components acting on a location in the
middle of the involute part of the upper layer bar of the first coil of phase a of the two-pole
generator, which has to sustain the largest electromagnetic forces during the three-phase
terminal short circuit.
All components consist of a fraction oscillating with the system frequency and
a constant fraction, both decaying exponentially. With the constant fraction decreas-
ing the time functions are increasingly dominated by a fraction of twice the system
frequency [1].
120 Gr¨uning and Kulig
Figure 5. Plane force distribution in the two-pole generator end region at different moments.
Figure 6. Plane force distribution in the four-pole generator end region at different moments.
Alternative computation
In the case of the two-pole generator the determination of the electromagnetic forces during
a three-phase terminal short circuit was also accomplished using an alternative numerical
computation method described in [4].
This method is characterized by a modeling of the stator end winding coils with a finite
cross section. Furthermore this method considers the magnetizable rotor shaft using the
integral equation method based on the separation of the magnetic field H into a zero-
divergence fraction and an irrotational fraction [4]. Compared to the computation method
introduced above, the rotor end winding is explicitly modeled and the rotor movement is
I-11. Electromagnetic Forces and Mechanical Oscillations 121
Figure 7. Time function of force.
taken into account. The influence of the stator core is considered similarly by the method
of images. The model underlying this computation method is shown in Fig. 8.
Duetothefact thatthecomputationtime isextensivelylongerwhenapplyingthismethod,
the results of both methods were compared at a single moment 10 ms after short circuit
occurrence. In Fig. 9 the force distribution along the upper layer bar of the first coil of phase
a calculated by both methods is compared.
Regarding the characteristic distribution of electromagnetic forces both methods pro-
vide comparable results. The differences correspond widely to the differences between the
two end region models like for example the way of modeling the bars of the stator end
winding.
Figure 8. End winding model for alternative electromagnetic force computation.
122 Gr¨uning and Kulig
Figure 9. Comparison of force distribution.
Mechanical simulation
The simulation method used to compute the vibration behavior of the stator end winding is
based on the application of mechanical finite-elements using the results of the electromag-
netic simulation as input data [1].
Depending on the manufacturer and the cooling principle the construction of the stator
end winding varies. The subsequently introduced mechanical finite-element model of the
stator end winding of a 170 MVA air-cooled turbo generator, which represents a character-
istic construction, is shown in Fig. 10.
The finite-element model comprises the bars of the upper layer and the lower layer which
are connected in pairs at the coil nose, the pressure ring which borders the stator core and
represents the boundary of the simulation area and the coil support brackets mounted on the
pressure ring. The model is completed by the support rings surrounding the end winding
and the bandages, which fix the bars to each other, the bars to the support rings and also the
Figure 10. Mechanical finite-element model of the stator end winding [2].
I-11. Electromagnetic Forces and Mechanical Oscillations 123
support rings to the support brackets [2]. The components of the model are determined by
their masses, stiffness, and damping characteristics. The complete model consists of about
20,000 bricks [1].
Both the bars of the stator end winding and the bandages have a very complex structure,
the modeling of which would exceed the calculating capacity. Therefore these components
were replacedby substitutesofapproximately the samemechanicalproperties.To determine
the parameters of the original bars and bandages, which show a non-linear behavior and
also temperature dependence, extensive measurements have been accomplished.
The bars of the stator winding consist of multiple twisted conductors, each covered with
insulating varnish. Theseareenclosedbyepoxy resinimpregnated glass silktape.To obviate
the modeling of such a complex structure the bars of the stator end winding were modeled
as massive bodies of comparable mass distribution, stiffness and damping characteristics.
To determine the stiffness parameters, bending tests were accomplished. Dynamic param-
eters were estimated by additional oscillation tests. Beside the measurements a detailed
mechanical finite-element model of a stator bar was implemented and used to compute the
parameters of different stator bars numerically.
The stiffness parameters of the bandages were determined by conducting static and
dynamic tests in a servohydraulic test facility. Tests at different temperatures showed a
significant dependency of the stiffness of the bandages on the temperature.
The performance of numerical simulations while varying certain model parameters
showed that the accuracy of the simulation results is decisively determined by certain model
parameters, especially by the stiffness of the bandages [2]. In this connection the precise
determination of suchlike parameters still offers a potential for further developments.
Results and verification
A combined electromagnetic and mechanical simulation of the end winding oscillation
behavior under forced vibrations was accomplished for three representative turbo gener-
ators differing in cooling principle, power class, and therefore in the stator end winding
construction.
The deformation due to the electromagnetic forces acting on the stator end winding
of a 170 MVA air-cooled turbo generator computed at one moment during a three-phase
terminal short circuit is shown in Fig. 11. As can be seen the oscillation behavior owns
characteristics of the one of a composite structure.
The time functions of the displacement computed at a location in the middle of the
involute part of an upper layer bar are shown in Fig. 12, using the Cartesian coordinate
system underlying the mechanical simulation method.
Reachingvaluesaround1,000 μmintheareaofthecoilnose, thedeformationsarearound
30 times higherthanundersteady-stateconditions.Butdue to the damping characteristics of
the end winding structure and according to the time behavior of the electromagnetic forces
during the three-phase terminal short circuit the amplitudes of the displacement decrease
relatively fast [2].
In the case of a 90 MVA air-cooled turbo generator the computation results of the oscil-
lation behavior during a three-phase terminal short circuit were compared to measurements
conducted by the manufacturer. At a location on the coil nose of different stator end winding
coils acceleration sensors were used to measure the displacement by integrating the signal
124 Gr¨uning and Kulig
Figure 11. Deformation of stator end winding during a three-phase terminal short circuit.
of the sensors. The comparison of the maximum values of the displacement functions is
given in Table 1.
As can be seen, except for one location the results of the numerical simulation and the
measurements show a good congruence with deviations of mostly noticeable beneath 40%
[1].
Beside the combined simulation the mechanical simulation method was applied to de-
termine eigenfrequencies and eigenmodes of the treated end winding constructions. There-
fore a rotating sinusoidal force distribution with solely a radial force component was
impressed on the mechanical finite-element model. By varying the rotational speed of
Z-direction
Y-direction
X-direction
0
–300
–150
0
150
300
–300
–150
0
150
300
–300
–150
0
150
300
0.1 0.2
Time [s]
0.3 0.4 0.5 0.6
Displacement [10
–6
m]
Figure 12. Time functions of displacement during a three-phase terminal short circuit [2].
I-11. Electromagnetic Forces and Mechanical Oscillations 125
Table 1. Comparison and displacement [1]
Displacement
Computed Measured
Location of
coil nose Tangential (
μ
M) Radial (
μ
M) Tangential (
μ
M) Radial (
μ
M)
3 h 934 1,216 — 1,174
6.75 h 1,059 1,055 558 1,215
7.5 h 1,344 1,220 — 877
9 h 931 1,159 879 934
9.75 h 925 1,103 — 1,502
10.5 h 874 1,021 1,068 1,644
11.25 h 1,003 989 — 993
the force distribution different eigenmodes were excited like for example the four-node
oscillation of the stator end winding of a 500 MVA hydrogen-cooled generator shown in
Fig. 13. The eigenfrequency corresponding to the shown oscillation amounts to 72 Hz. The
four-node oscillation represents an eigenform, which can indeed easily be excited in the
end winding of turbo generators [1].
A number of eigenmodes with the appendant eigenfrequencies of the 90 MVA air-cooled
turbo generator is given in Table 2.
Table 2. Eigenmodes and eigenfrequencies
Eigenmode Eigenfrequency (Hz)
Torsional oscillation 35.2
Two-node oscillation 41.4
Four-node oscillation 73.6
Figure 13. Four-node oscillation excited by rotating sinusoidal force distribution.
126 Gr¨uning and Kulig
A resonance measurement accomplished for the 90 MVA generator by using the accel-
eration sensors mentioned above showed a clear resonance at 70.5 Hz, which corresponds
good to the computed frequency of the four-node oscillation. But repeated measurements at
different temperatures showed, that the measured frequency varied slightly with increasing
temperature.
Conclusions
The electromagnetic and mechanical modeling of the turbo generator end region and es-
pecially the determination of certain model parameters still contain a great potential of
improvement. Anyhow, three-dimensional numerical simulation of the end winding oscil-
lation behavior of turbo generators may emerge as a useful tool in design and development
of large electrical machines.
References
[1] O. Drubel, S. Kulig, K. Senske, End winding deformations in different turbo generators during
3-phase short circuit and full load operation, Electr. Eng., Vol. 82, pp. 145–152, 2000.
[2] K. Senske, S. Kulig, J. Hauhoff, D. W¨unsch, “Oscillation Behaviour of the End Winding Region
of a Turbo Generator During Electrical Failures”, Conference Proceedings CIGRE, Yokohama,
October 29, 1997.
[3] C G. Richter, Berechnung elektromagnetischer Kr¨afte auf die Spulenseiten im Wickelkopf von
Turbogeneratoren, Institute of Electrical Machines and Drives: University of Hannover, 1996.
[4] B. Frei-Spreiter,Ein BeitragzurBerechnung derKr¨afteimWickelkopfbereichgroßerSynchron-
maschinen, Instituteof Electrical Machines:Swiss Federal Instituteof TechnologyZ¨urich, 1998.
[5] B. Kulicke, Digitalprogramm NETOMAC zur Simulation elektromechanischer undmagnetis-
cher Ausgleichs-vorg¨ange in Drehstromnetzen, Elektrizit¨atswirtschaft, VDEW, Vol. 78, No. 1,
pp. 18–23, 1979.
[6] R. Ummelmann, Erweiterung eines Finite-Differenzen-Zeitschritt-Programmsystems auf Syn-
chronmaschinen, Institute for Electrical Machines, Drives and Power Electronics: University of
Dortmund, 1997.