Recent Developments of Electrical Drives - Part 24 ppt
Bạn đang xem bản rút gọn của tài liệu. Xem và tải ngay bản đầy đủ của tài liệu tại đây (553.05 KB, 10 trang )
222 Schlensok and Henneberger
Table 3. Maximal levels of the estimated air-borne sound-pressure
(sl: stator excitation, left-hand rotation; sr: stator excitation,
right-hand rotation; srr: stator + rotor excitation, right-hand rotation)
f (Hz) L
sl
(dB) L
sr
(dB) L
srr
(dB)
420 16 26 9
520 23 23 23
620 9 6 14
720 27 25 27
940 28 29 28
1,040 11 21 22
1,140 9 10 10
by the forces amplify the axial component. Therefore, it is of advantage to take the rotor
excitation into account to get more exact results concerning the structure-borne sound.
Acoustic simulation
The last step is toestimate the air-borne noise generated by the different excitations. For this
reason a boundary-element model of the entire machine structure is applied. The air-borne
sound-pressure is estimated on an analysis hemisphere around the machine at a distance of
d = 1 m. Fig. 17 shows the result for stator-rotor excitation at f = 420 Hz.
The maximum sound-pressure levels L reached for the three cases taking the stator
excitation into account are listed in Table 3.
Figure 17. Sound-pressure distribution at f = 420 Hz for stator-rotor excitation and right-hand
rotation.
II-7. Comparison of Stator- and Rotor-Force Excitation 223
The results show that the direction of the rotation has a significant effect on the noise
generation. Except for f = 720 Hz and f = 620 Hz all orders are amplified up to L =
10 dB. If the rotor-force excitation is taken into account some orders become louder and
some quieter. The air-borne sound-levels do not suit the acceleration measurements as well
as those of the structure-borne sound.
Conclusion
In this paper the structure- and air-borne noise of an induction machine with squir rel-cage
rotor are estimated.
Forthis, different types of surface-forceexcitationsand rotational directions are regarded
for thefirst time. In general the calculated structure-borne sound-levels suit the acceleration
measurementsoftheindustrialpartnerverywell.Theacoustic-noise levelsdifferfromthose.
The comparison of the different excitations show, that it is necessary to take the rotor
excitation into account. In case of pure stator-excitation e.g. the first stator-slot harmonic
at 720 Hz does not reach as significantly high levels as expected although it is one of the
strongest orders measured.
References
[1] C. Schlensok, T. K¨uest, G. Henneberger, “Acoustic Calculation of an Induction Machine with
Squirrel Cage Rotor”, 16th International Conference on Electrical Machines, ICEM, Crakow,
Poland, September 2004.
[2] B T. Kim, B I. Kwon, Reduction of electromagnetic force harmonics in asynchronous
traction motor by adapting the rotor slot number, IEEE Trans. Magn., Vol. 35, No. 5,
pp. 3742–3744, 1999.
[3] T. Kobayashi, F. Tajima, M. Ito, S. Shibukawa, Effects of slot combination on acoustic noise
from induction motors, IEEE Trans. Magn., Vol. 33, No. 2, pp. 2101–2104, 1997.
[4] L. Vandevelde, J.J.C. Gyselinck, F. Bokose, J.A.A. Melkebeek, Vibrations of magnetic origin
of switched reluctance motors, COMPEL, Vol. 22, No. 4, pp. 1009–1020, 2003.
[5] G. Arians, Numerische Berechnung der elektromagnetischen Feldverteilung, der struktur-
dynamischen Eigenschaften und der Ger¨ausche von Asynchronmaschinen, Aachen: Shaker
Verlag, 2001. Dissertation, Institut fur Elektrische Maschinen, RWTH, Aachen.
[6] G. Arians, T. Bauer, C. Kaehler, W. Mai, C. Monzel, D. van Riesen, C. Schlensok, iMOOSE,
www.imoose.de.
[7] I.N. Bronstein, K.A. Semendjajew, Taschenbuch der Mathematik. 25. Auflage, Leipzig,
Stuttgart: B.G. Teubner Verlagsgesellschaft, 1991.
[8] H.D. Lke, Signal¨ubertragung, Berlin, Heidelberg, and New York: Springer-Verlag, 1999.
[9] I.H. Ramesohl, S. K¨uppers, W. Hadrys, G. Henneberger, Three dimensional calculation of
magnetic forces and displacements of a claw-pole generator, IEEE Trans. Magn., Vol. 32,
No. 3, pp. 1685–1688, 1996.
[10] Jordan, H., Ger¨auscharme Elektromotoren, Essen: Verlag W. Girardet, 1950.
II-8. A CONTRIBUTION TO DETERMINE
NATURAL FREQUENCIES OF
ELECTRICAL MACHINES. INFLUENCE
OF STATOR FOOT FIXATION
J-Ph. Lecointe, R. Romary and J-F. Brudny
Laboratoire Syst`emes Electrotechniques et Environnement, Universit´e d’Artois, Technoparc
Futura, 62400 B´ethune, France
, ,
Abstract. In this paper, four methods to determine the mechanical characteristics (natural frequen-
cies, mode numbers) of electrical machine stators are developed. Result comparison concerns analyt-
ical laws, a finite element software, a modal experimental procedure and a method based on analogies
between mechanic and electric domains. Simple structures are studied in order to analyze the validity
of each method with accuracy. The fixation of a stator yoke allows to observe the modifications of the
mechanical behavior.
Introduction
The study of electrical machine noise always leads to mechanical resonance problems. The
noise origins are generally divided into three sourceswhich are mechanic, aerodynamic, and
magnetic [1]. The noise of magnetic origin is produced by the electromagnetic radial forces
between the stator and the rotor. The noise resulting from these forces can be particularly
severewhenaforceofmagneticoriginisclosetoanaturalfrequencybecausecircumferential
modes of the stator are excited[2].Itisparticularlythecaseofswitched reluctance machines
[3] but it could be also problematic for classical alternative current machines supplied by
converters. That iswhy an accurateknowledge of the mechanical behaviorof the machine—
especially the natural frequencies—is important in noise and vibration prediction.
Most studies often use finite element software. These last ones give accurate and usable
results if model is well fitted to the studied structure. Indeed, materials constituting the
machine have to be correctlyestimated;otherwisetheadvantages offeredby FE are reduced.
In this paper,different methods arestudied in order to estimatewhich onescan give accurate
values of natural frequencies of simple structures, as fast as possible in order to establish
a rapid diagnosis. Four methods are performed. The first one uses analytical expressions
based on Jordan’s work, but the proposed laws are improved thanks to fewer restrictive
hypotheses. The second method uses a FE software (Ansys). The third method is original
because it is based on analogies between mechanic and electrical domains. Consequently,
the mechanical problem is transformed into an electrical circuit resonance determination.
The last method is experimental: a modal hammer allows to verify the calculated values.
S. Wiak, M. Dems, K. Kom
˛
eza (eds.), Recent Developments of Electrical Drives, 225–236.
C
2006 Springer.
226 Lecointe et al.
Table 1. Used variables
Symbol Quantity
R
c
Average radius of the yoke
e
c
radial thickness of the yoke
L
e
length of the cylinder
E Young modulus
P Mass density
N Poisson ratio
Usual studies consider machines in free conditions. It allows the influence of different
parameters tobe quantified; several papers have already discussed the effects of the feet, the
cooling ribs, the windings, or the end-bells [4,5]. In this paper, the influence of the fixation
on a rigid chassis is studied. The purpose is to evaluate the fixation impact on the natural
frequencies and on the shape of the mode numbers (Table 1).
Methods of natural frequency determination
Four methods are performed to determine the natural frequencies and the associated mode
number. Technologies and principles for each of them are quite different. The older one
is entirely based on analytic beam theory [6]–[7] whereas another one is totally numeric
(finite element). The third developed method considers analogies between mechanical;
electrical quantities and the identification of mechanical parameters allows to transform the
mechanical problem into an electrical circuit study. The experimental method uses a modal
station and gives the reference results. Table 1 presents the used variables.
Analytical method
The presented laws have been rewritten [8] more accurately about smooth free rings. Con-
sidering that the stator is the most responsive part compared to the rotor, the ball bearings
or the flanges, this analytical method gives a fast determination of stator natural radial fre-
quencies. This method allows to determine only the frequencies in two dimensions. They
are noted F
i
, where “i” is the mode number:
m = 0:F
0
= (1)
m = 1:F
1
=
√
2 (2)
m = 1:F
1
=
a +m
+
−
√
2
(
3
2
m
−
+ 1
)
(3)
where
= m
2
+
+
2
2am
+
− 4m
2
m
2
−
+
4
a
2
− 12m
2
m
3
−
(4)
a = 4m
4
− m
2
− 3 (5)
m
+
= m +1 m
−
= m −1 (6,7)
2
=
E
ρ R
2
c
(8)
=
e
2
c
12R
2
c
(9)
II-8. To Determine Natural Frequencies of Electrical Machines 227
Numerical determination with a FE software
The finite element software (Ansys) solves the conventional eigenvalue equation:
[
H
]
− ω
2
[
M
]
[
χ
]
=
{
0
}
(10)
where [H] and [M] are, respectively, the stiffness and the mass matrixes. The solutions
ω/(2π ) and [χ] are the natural frequencies and the nodal displacements. Resolution uses
the block Lanczos algorithm; values of Young modulus, mass density, and Poisson ratio are
required.
Equivalent electric circuit
As the first method allowstofindonly the natural resonances ofstructures in free conditions,
a second method based on analogies between mechanic and electric domains has been
developed. The equivalences are presented at Table 2.
The stator is divided into M levels, each of them containing N cells (Fig. 1). Each cell
is characterized by its mass. The deformation of the structure is represented by the relative
displacement of a cell compared to the others cells. From a mechanical point of view, the
rigid linkages can be taken into account with springs and, from an electrical point of view,
with capacitors. A resistor allows to take into account the energy lost in the movement by
viscous friction.
The equivalent scheme of the structure is presented at Fig. 2. The voltages applied on
the internal part of the first level represent the forces supported by the stator. The voltage
fluctuations at the external periphery give the evolution of the deformations. Consequently,
Table 2. Equivalences
Mechanical quantities Electrical quantities
Mass M Inductance L
Rigid linkages K Capacitor C
Viscous friction F
v
Resistor R
Force x Voltage U
Speed dx/dt Current i
(N, M)
(N, 1)
(1, 1)
(1, 2) (2, 2)
(2, 1)
(3, 1)
(3, M)
m
(1, M)
(2, M)
(1, . .)
m
Figure 1. Stator division.
228 Lecointe et al.
C
h
C
h
V
h,k
i
h,k
i
h,k–1
i
h,k–1
i
h–1,k–1
V
h–1,k–1
V
h,k–1
u
h
u
h+1
V
h–1,k
i
h–1,k
i
h,k
L
R/2
R/2
R/2
C
v
W
h,k+1
W
h+1,k
W
h,k
W
h–1,k
Cell h,k
j
h,k+1
u
h–1
Figure 2. Equivalent electric circuit.
such a model gives the possibility to model different excitations: sinusoidal or pulsed.
Therefore, the validity of the model can be verified with modal experimentations performed
with an impact hammer.
For a sinusoidal excitation characterized by a frequency ω
e
and a mode number m,it
becomes:
u
h
(
t
)
= U
m
cos
ω
e
t − hm
2π
N
(11)
where h gives the position of the force along the internal periphery. Successive calculations
give the frequency value for which the vertical response is maximal and thus the radial
frequency can be determined. The fixation of the machine can be studied by imposing a
potential zero in chosen points of the external periphery.
Next step consists in determining the values of the equivalent parameters.
II-8. To Determine Natural Frequencies of Electrical Machines 229
The equivalent inductance is given by the elementary cell mass which is given by the
expression:
L = π
r
2
k+1
−r
w
k
N
ρ L
e
(12)
where r
k+1
and r
k
are, respectively, the external and the internal radius of the level k.
Then, the equivalence between potential and electrical energies gives the relation K =
1/C. The Hooke law and the classical capacitor calculation relations allows to determine
the expressions of capacitors C
v
and C
h
, according to the considered geometry:
C
v
=
(
r
k+1
−r
k
)
N
(
r
k+1
+r
k
)
E
y
(13)
C
h
=
(
r
k+1
+r
k
)
π
(
r
k+1
−r
k
)
NE
y
(14)
The equivalent resistance is the most difficult to determine. As it does not influence the
frequency response, this coefficient is arbitrary chosen.
The equations of the electric circuit lead to a second order differential system composed
of 4 × M × N lines. Consequently, the response of the structure is determined in the
state space. The state vector is composed of 4 × M × N elements: vertical and horizontal
currents and capacitor voltages. Computation is realized with Matlab⇔ and Simulink⇔.
Such a process has a double advantage. First, computation time is lower than FE software
because the matrix size is smaller. Secondly, it could be set up on any computer without
any specific software.
Modal experimental device: impact hammer test
The modal test using a hammer is the least expensive. The examined structure is excited
by an impact given with a specific hammer (Meggitt Endevco, model 2302-5) which allows
to measure the characteristics of the shock. A piezoelectric accelerometer (Bru¨el & Kjaer,
model 4384) allows to observe the response of the structure. A spectrum analyzer (Bru¨el &
Kjaer, 2035, 2 channels) and a modal analysis software (Star System
TM
) provide the pro-
cessing and the analysis of the measures. The Fig. 3 presents a scheme of the experimental
device. The frequency limit of the used hammer is around 8 kHz.
Studied structures
Three elementary structures are studied. Two are perfectly sleek rings (Fig. 4) whereas the
third one is composed of a statoric yoke made of steel which is equipped of two welded feet
(Fig. 5). Table 3 presents the dimensions of the structures. The geometry of the cylinders
is quite different. Indeed, the first one is elongated whereas the second one presents an
important diameter. Studying such different configurations allows the method accuracy to
be quantified. A massive structure equipped of feet is deliberately studied in order to avoid
the perturbations generated by coils, cooling ribs, or stack lamination. In this way, the main
phenomenon observed is the foot fixation.
230 Lecointe et al.
Spectrum
Analyzer
Impact hammer
Data transmitted by
IEEE port
Personal
computer
Accelerator
Figure 3. Experimental device.
Results and experimental validation
Structures in free conditions
First, all the methods are applied to the two cylinders in free conditions to check their
accuracy.Analytical method,FE software,andanalogymethodrequirethesame parameters:
Young modulus,mass density, and Poissonratioare, respectively,equalto E = 2, 1.10
11
Pa,
Figure 4. Picture of the smooth cylinders.
II-8. To Determine Natural Frequencies of Electrical Machines 231
Figure 5. Picture of the statoric yoke.
Table 3. Dimensions
Cyl 1 Cyl 2 Statoric ring
R
c
(mm) 53 133.5 120.5
e
c
(mm) 10 23 42
L
e
(mm) 136 104 260
Meshing and 2D deformations (cylinder 2)
3D deformations (cylinder 2)
Figure 6. FE results.
ρ = 7,850 kg/m
3
, and v = 0, 3. Fig. 6 presents the FE meshing of the cylinder 2 and the
usual 2D deformation shape. Additional 3D frequencies and bending appear.
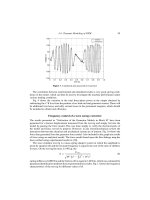
Fig. 7 shows the cylinder 2 response. It is obtained by the method using analogies with
M = 5 and N = 16.The excitationis sinusoidal and the currentinthelast vertical branch of
thecircuitpresentsa transient stateandthen becomes sinusoidal.Thedivisionofthe cylinder
232 Lecointe et al.
Vertical current J1,M
Time
(
s
)
Relative response (%)
0
–0.6
–0.4
–0.2
0
0.2
0.4
0.6
0.8
1
0.005 0.01 0.015 0.02 0.025
Figure 7. Vertical current j
M,N
response (sinusoidal excitation).
can be noticed on Fig. 8 which represents the special evolution of the external surface; the
different shapes correspond to the excitations (modes 2, 3, and 4). A shock simulation leads
to the response presented at Fig. 9 whereas Fig. 10 presents the FFT of the signal.
In free conditions, the structures are suspended with rigid rubber bands or with elastic
rubber bands if the weight of the structure is not too important. A meshing is constituted of
192 points drawn on each external surface and shared out four planes (Fig. 11). Each point
is excited with the modal hammer four times. Mode shapes given by the modal software
can be perfectly identified. Fig. 12 presents the cylinder 2 shapes.
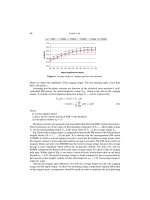
Results for each method applied to both cylinders are presented at Table 4 and hammer
test is chosen as reference. Results show that, independently of the considered geometry,
the maximum relative error for analytical method is 2.3% for the four first modes. The
accuracy of such analytical process is noticeable in spite of the particular geometry of
the cylinder 2. The FE method does not give results so precise but the characterization
is more complete with 3D deformations. The method using analogies is not so precise
as analytical laws. The advantage of this method is its future development in the third
dimension.
Figure 8. Shapes of deformation.