Microsoft Excel 2010 Product Guide ppsx
Bạn đang xem bản rút gọn của tài liệu. Xem và tải ngay bản đầy đủ của tài liệu tại đây (2.93 MB, 76 trang )
Microsoft Excel 2010
Product Guide
Table of Contents
Microsoft Excel 2010: An Overview 1
Excel 2010: At-a-Glance 2
Get easier access to the right tools, at the right time. 2
Analyze your data quickly and effectively. 2
Obtain powerful analysis from your desktop. 3
Save time and simplify your work. 3
Collaborate on workbooks in new ways. 4
Access your workbooks virtually anytime, anywhere. 5
Excel 2010: A Closer Look 6
Ribbon Improved! 6
Microsoft Office Backstage View New! 7
Sparklines New! 9
PivotTable Views Improved! 10
PivotChart Interactivity Improved! 10
Slicer New! 11
Conditional Formatting Improved! 12
PowerPivot for Excel 2010 New! 13
Function Accuracy Improved! 15
Filter Capabilities Improved! 16
Solver Add-in Improved! 17
64-bit Version New! 18
Recover Unsaved Versions New! 19
Charting Performance Improved! 20
Equations New! 20
Office Themes Improved! 21
Paste with Live Preview New! 22
Picture Editing Tools Improved! 23
Excel Services Improved! 25
Protected View New! 25
Trusted Documents New! 26
Accessibility Checker New! 27
Streamlined Communications New! 28
Share Through Communicator ―14‖ New! 30
Language Tools Improved! 30
Microsoft Excel Web App New! 32
Microsoft Excel Mobile 2010 Improved! 35
Power User Tips 37
More on Show Values As calculations 37
Explore Recover Unsaved Workbooks and Autosave Versions 41
Customize the Ribbon 42
Customize workbooks and save time using Office Open XML 44
Conclusion 46
Where to Find It 47
Version Comparison 54
Excel 2010 FAQ 63
Feature Availability / Disclosure 72
Office Mobile 2010 72
Office Web Apps 72
PowerPivot for Excel 2010 72
Microsoft Communicator ―14‖ 72
Links provided in this product guide 72
1
Microsoft Excel 2010: An Overview
Microsoft® Excel® 2010 delivers rich, new and enhanced features to the world’s most popular
productivity suite. Excel 2010 makes it possible to analyze, manage, and share information in
more ways than ever before, helping you make better, smarter decisions. With new data analysis
and visualization tools, along with managed self-service business intelligence technologies, you
can create effective business or information insights that track and highlight important data
trends and communicate your results through high-quality charts and graphs.
You can also easily share your insights with others through Microsoft
SharePoint® 2010 or your
Windows Live™ account. Work better together by working simultaneously with others online
and accomplish your most important tasks faster. Your information is never far away as you can
access your files from almost anywhere—from your PC, a Web browser, or smartphone.
1
With
Excel 2010 you can work when and where you want.
Whether you’re producing financial reports, managing personal expenses, collaborating with a
team on school or work projects—even if your workbooks exceed a million rows—Excel 2010
makes it easier to get what you need done more quickly, with more flexibility, and with better
results.
Welcome to Excel 2010—our most powerful and intuitive version yet.
1
Web and smartphone access require an appropriate device and some functionality requires an Internet connection. Web
functionality uses Office Web Apps, which require a supported Internet Explorer
®
, Firefox, or Safari browser and either SharePoint
Foundation 2010 or a Windows Live ID. Some mobile functionality requires Office Mobile 2010 which is not included in Office 2010
applications, suites, or Office Web Apps. There are some differences between the features of the Office Web Apps, Office Mobi le
2010 and the Office 2010 applications.
2
Excel 2010: At-a-Glance
Take a glance at how Excel 2010 is designed to give you the best productivity experience across
PC, phone, and browser. Get a closer look at the new and improved features in the sections that
follow.
Today, a spreadsheet application is used for a variety of tasks, such as statistical analysis,
forecasting revenue, managing business and personal finances, and maintaining address lists or
student records. Your needs may be increasing but there’s no need to outsource and hire a
consultant to meet them. With Excel 2010, you can quickly create polished and professional
work. New data analysis and visualization capabilities have been added and long-time favorites
have been enhanced to help increase your productivity and help you gain insights resulting in
better decisions.
Get easier access to the right tools, at the right time.
New and improved features can help you be more productive, but only if you can find them
when you need them. Fortunately, the enhanced, customizable Ribbon in Excel 2010 makes it
easy to uncover more commands so you can focus on the end result, not how to get there.
Want an easier time making sure the file you’re working on is finished and ready for public
consumption? Wishing for a faster, more direct route to print something? Or perhaps you need
an easier way to share your workbooks? The new Microsoft Office Backstage™ view can help
you achieve all of this and more. You can now more easily print, share and manage your
workbooks, and customize your Excel 2010 experience, all from one convenient location.
Analyze your data quickly and effectively.
Excel 2010 delivers powerful new features to help you discover patterns or trends at-a-glance
that can lead to more-informed decisions. Improve your ability to analyze large data sets by
using new analysis, visualization features, and dynamic formatting to call out the highs and lows
of your data.
Turn complexity into clarity. Get a quick visual summary of data using tiny charts that fit
within a cell near its corresponding values with new Sparklines.
3
More intuitive filtering. Quickly filter large amounts of data in fewer steps using new Slicer
functionality and enhance your PivotTable® view and PivotChart® view visual analysis.
Enhanced data analysis and visualization. Communicate your analysis more clearly through
improved Conditional Formatting using new icons and enhanced data bars.
Obtain powerful analysis from your desktop.
Whether at work or home, you need to be able to manipulate and analyze your information in a
way that gives you new insight to make better decisions—and the faster you can finish your task
the better. Many refinements and performance improvements in Excel 2010 make it easier and
faster for you to accomplish your work.
Get more power from Excel. For those who need additional power for your analysis,
PowerPivot for Excel 2010, a free add-in, was designed for you. Experience lightning-fast
manipulations of enormous quantities of data.
2
Quickly narrow your search. Find relevant items among thousands or even millions of table
or PivotTable rows using new Search Filter capabilities.
Power Users: this is for you. Work with massive datasetsmore than 2 gigabytesand
maximize new and existing hardware investments by using the 64-bit version of Excel 2010.
3
Save time and simplify your work.
No matter what type of workbooks you create, you want to focus on your content, not the tasks
associated with creating and managing them. Excel 2010 delivers new and improved tools that
simplify your tasks and save you time at every step.
Recover unsaved versions of files that you closed without saving! That’s right—recover
your workbooks even if they were never previously saved.
Enjoy a wide range of additional Office themes. Coordinate colors, fonts, and graphic
formatting effects throughout your workbook in just a couple clicks.
2
Requires a free, separate download. For more information visit: www.powerpivot.com. PowerPivot for SharePoint requires
Microsoft SQL® Server 2008 R2 Enterprise Edition or higher and SharePoint 2010.
3
This option can only be installed on 64-bit systems. For installation instructions and more information visit:
4
Pasting is now simplified. Effortlessly reuse content by previewing how information will look
before actually pasting using Paste with Live Preview.
Add polished and professional images to your workbooks. With new and improved picture
editing tools you don't have to be a graphic designer or use additional photo-editing
programs.
Sometimes you want to share your workbooks with friends or co-workers. At other times, you
need to work together with a team on school or work projects. In either instance, you want to
focus on what needs to be done as opposed to the processes that make sharing and
communicating easy and convenient. Excel 2010 provides new and enhanced features to help
you work on team projects or show your work to other people.
Collaborate on workbooks in new ways.
Excel 2010 offers easy ways to bring people together and help increase work quality. New
technologies help break down barriers so you can share and work together on workbooks and
dashboards, making you and/or your team more efficient and productive.
Share your analysis and results across your organization. Use SharePoint Excel Services and
share your easy-to-read workbooks in a Web browser with your team while maintaining a
single version.
View workbooks created by others more safely and securely. Workbooks received in e-mail
or downloaded from the Web automatically open in Protected View so that you can make a
more informed decision before exposing your computer to potential vulnerabilities.
Eliminate multiple security prompts. Trusted Documents simplify your Excel 2010
experience by enabling you to eliminate security prompts for workbooks you have already
trusted.
5
If your ideas, deadlines, and work emergencies don’t always conveniently occur when you are at
your desk, you are certainly not alone. Fortunately, Excel 2010 gives you the power to get things
done when and where you want.
Access your workbooks virtually anytime, anywhere.
Get the information you need, when and how you want it. Now you can easily access your
workbooks by taking the Excel experience with you and stay on top of your needs while you’re
on the go.
Microsoft Excel Web App: Edit virtually anywhere. View and edit your workbooks in a Web
browser when you’re away from home, school, or your office.
4
You can even simultaneously
work with other people on the same workbook even if they don’t have Excel installed.
Microsoft Excel Mobile 2010: Bring big power to your small devices. Stay up to the minute
by using a mobile version of Excel specifically suited to your Windows® phone.
5
Whether you are creating a simple list or a complex mission-critical financial model, or getting
work completed on the run, Excel 2010 makes it easier to get what you need done more quickly,
with more flexibility, and with better results.
4
Office Web Apps require an appropriate device, Internet connection, supported Internet Explorer, Firefox, or Safari browser, and
either SharePoint Foundation 2010 (for business) or a free Windows Live ID (for personal use). There are some differences between
the features of Office Web Apps and the Office 2010 applications.
5
An appropriate device is required. Excel Mobile 2010 is not included in Office 2010 applications, suites, or Web Apps. Office Mobile
2010 will be released on Windows phones (Windows Mobile
®
6.5 or above) by the general availability of Microsoft Office 2010.
There are some differences between the features of Office Mobile 2010 and the Office 2010 applications.
6
Excel 2010: A Closer Look
Explore new ways Excel 2010 can help you get things done whether you’re working on your
ideas on your own, together, or on the go.
Get easier access to the right tools, at the right time.
Ribbon Improved!
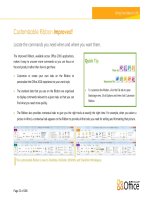
Locate the commands you need when you want them and where you want them. The improved
Ribbon, available across the Office 2010 applications, makes it easy to uncover more commands
so you can focus on the end product rather than how to get there.
The Ribbon replaces the traditional menus and toolbars to give you a more customized work
experience. It’s designed to help you more easily find and use the full range of features that
Excel provides—so that you can get more done in less time.
Figure 1 - The enhanced Ribbon helps you quickly find the commands that you need to
complete a task.
Customize or create your own tabs on the Ribbon to personalize the Excel 2010 experience
to your work style.
The standard tabs that you see on the Ribbon are organized to display commands relevant
to a given task, so that you can find what you need more quickly.
The Ribbon also provides contextual tabs to give you exactly the tools you need, when you
need them. For example, when you click a chart, contextual tabs appear on the Ribbon with
a broad range of chart options, as shown in Figure 2.
7
Figure 2 - Contextual tools automatically display when you need them.
Microsoft Office Backstage View New!
On the left edge of the Ribbon you see the File tab. Just click that tab for an all-access pass that
makes it easier than ever to manage your files and customize your Excel experience.
The new Backstage view replaces the traditional File menu to provide a single location for all of
your file management tasks. For example:
When you first open Backstage view, you’re on the Info tab. From this one location, you can
manage workbook protection options, view and edit file properties, inspect the workbook
for proprietary information you may not want to share, and even recover files that you
accidentally closed without saving.
8
From the Save & Send tab in Backstage view, you can share your workbook as an Excel e-
mail attachment or as PDF or XPS. You can also save your workbook to Microsoft SharePoint
or to the Web, such as to your Windows Live SkyDrive™.
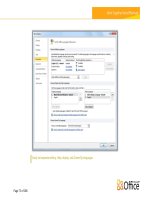
The Print tab, shown in Figure 3, provides a new print experience with a full page Print
Preview right alongside your print options.
Figure 3 –Change your print settings and preview your workbook in a single, intuitive view.
The Ribbon helps you create your content. Backstage view helps you manage it.
Quick Tip: Check out the Recent tab in Backstage view for lists of both recently accessed files and
recently accessed locations. Pin files or locations to that tab to move them to the top and keep them
readily accessible. In addition, you can remove a recently used file or location by right-clicking the list item
and then clicking Remove from list.
9
Analyze your data quickly and effectively.
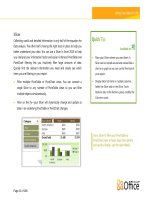
Sparklines New!
Sometimes, numbers speak for themselves. At other times, charts or graphs can significantly
clarify your information. With Excel 2010, you can take advantages of numbers and charts within
the same cell. Sparklines are small charts in a worksheet cell that provide a clear and compact
visual representation of your data for quick and easy reference.
Figure 4 – Add Sparklines
to chart data near your
values.
Use Sparklines to show trends in a series of values, such as seasonal increases, the price of
your home, or your monthly expenditures.
Highlight maximum or minimum values and increase impact by positioning a Sparkline next
to its corresponding data.
Quick Tips:
Quickly create Sparklines: Select the location for your Sparkline, on the Insert tab, in the Sparklines
group, choose the type of chart you want: Line, Column, or Win/Loss, and select the values for the
data range.
To format a Sparkline independently of a Sparkline group, select the Sparkline and on the Sparkline
Tools Design tab, click Ungroup.
10
PivotTable Views Improved!
PivotTable views are easier and faster to use in Excel 2010. Along with improved performance
that helps speed up data retrieval, sorting, and filtering, you’ll find these additional
enhancements and more:
Repeating labels. In previous versions of Excel, when you use more than one field as a row
label in your PivotTable, only the first occurrence of the row label will display. In Excel 2010,
you can now use Repeat All Item Labels, found on the PivotTable Tools Design tab, in the
Report Layout options, in to repeat the row label for each corresponding value. This
enhanced ability enables you to utilize PivotTable data in functions, such as VLOOKUP,
INDEX, and MATCH.
New Show Values As calculations. Excel 2010 has added six new calculations for analyzing
your PivotTable data. Now display % of Parent Row Total, % of Parent Column Total, % of
Parent Total, % of Running Total In, Rank Smallest to Largest, or Rank Largest to Smallest.
Quick Tip: Now it’s even easier to try out different calculations in your PivotTable. Right-click a value field
in your PivotTable and point to Show Values As to display a list of calculations that were only previously
available in the Value Field Settings dialog box. You can also find Show Values As on the PivotTable
Tools Options tab in the Calculations group.
PivotChart Interactivity Improved!
Excel 2010 takes the popular PivotChart, used for visual analysis and reporting, one step further.
You can now filter directly on your PivotChart using new interactive buttons.
Figure 5 - Quickly filter
your PivotChart with new
interactive buttons.
11
Stay in control of what you see on your screen and make filtering more accessible. Hide all
interactive buttons for printing purposes or hide individual buttons that may not apply to
your filtering needs.
Quick Tip: After you filter your PivotChart the interactive buttons will display a filter icon just as the
PivotTable does today.
Slicer New!
Collecting useful and detailed data is only half of the equation for data analysis. The other half is
having the right tools in place to help you better understand your data. Enhanced PivotTable
and PivotChart filtering in Excel 2010 lets you intuitively filter large amounts of data through the
new Slicer feature. Quickly find the relevant information you need and clearly see which items
you are filtering in your report.
Filter on the fly. Your Slicer will dynamically change and update as data in underlying
PivotTable or PivotChart changes.
Figure 6 – Connect a
Slicer to any number
of PivotTable and
PivotChart views and
filter multiple objects
simultaneously.
Place your Slicers where you want them. A Slicer can be moved around and resized like a
chart or a graph so you can control the look of your report.
12
Filter on multiple fields. Connect multiple Slicers to a PivotTable or PivotChart and increase
your filtering capabilities.
Quick Tips:
Display Slicer list items in multiple columns. Select the Slicer and on the Slicer Tools Options tab, in
the Buttons group, modify the Columns count.
Find a variety of additional formatting options for your selected Slicer on the Slicer Tools Options
tab. Choose from a gallery of Slicer Styles that match your Office theme or when working with
multiple Slicers, use the options in the Arrange group to quickly align and group your Slicers.
Conditional Formatting Improved!
Conditional formatting comes with even greater flexibility in Excel 2010 to help you more easily
discover and illustrate important trends and highlight data exceptions. Find more styles, data bar
options, and new icon sets.
Figure 7 - Use conditional formatting with gradient fills and borders, data bars, and icon sets
to better analyze your data.
More icon set flexibility. Now you can mix and match icons from different sets or hide an
icon for cells that meet a specified condition. It’s easy to customize your icon arrangements.
13
Make better comparisons. Data bars are now drawn proportionally according to their values.
Negative values are more clearly displayed and zero values are suppressed. And, you can
position the axis in the center of the cell to better emphasize your positive and negative
values.
Distinguish trends in your data. New gradient fills with borders and solid fills make it easier
to add more visibility to your conditional formatting.
Reference other worksheets. In Excel 2010 you can now include references to other
worksheets in your conditional formatting rules.
Quick Tips:
You can adjust the color, fill, borders, icons, data bars or the way Excel 2010 computes the values for
the highest, lowest, or midpoint values by selecting More Rules at the bottom of the respective
Conditional Formatting gallery.
The newly added ability to reference other worksheets in your conditional formatting rules also
extends to your Data Validation rules.
Obtain powerful analysis from your desktop.
PowerPivot for Excel 2010 New!
PowerPivot for Excel 2010, a free add-in, is a data analysis tool that delivers unmatched
computational power directly within the application users already know and love—Microsoft
Excel.
With PowerPivot, you can transform enormous quantities of data into meaningful information to
get the answers you need in seconds. You can effortlessly share your findings with others and IT
departments can improve operational efficiencies through SharePoint-based management tools.
14
Figure 8 – Filter and sort large data sets with PowerPivot for Excel 2010.
PowerPivot enables you to empower your insight and decision-making, to share and collaborate
with confidence, and to help improve IT efficiency.
Excel-based in-memory analysis. Overcome existing limitations of large data analysis on the
desktop with efficient compression algorithms to load even the biggest data sets into
memory.
Data Analysis Expressions (DAX). Places powerful relational capabilities into the hands of
power users who want to create advanced analytics applications such as
SamePeriodLastYear(), ClosingBalances(), Previous Day(), and more.
Hit the ground running. Leverage new Excel features such as Slicers and those you already
know, including the Ribbon, PivotTable and PivotChart views.
15
Virtually unlimited support of data sources. Provides foundation to load and combine source
data from any location for massive data analysis on the desktop, including relational
databases, multidimensional sources, cloud services, data feeds, Excel files, text files, and
data from the Web.
SharePoint Integration. Enables you to share data models and analysis. And, because the
solutions are in SharePoint, you can configure refresh cycles to ensure the data remains
current automatically.
6
Collaborate on analytics solutions. Turn your workbooks into shared applications
accessible virtually any time and from any location. Benefit from all the features that
make SharePoint so effective, such as role-based security, workflows, versioning, and
automatic data refreshing, and even reuse your shared workbook applications as data
sources in new analysis.
PowerPivot Management Dashboard. Enables IT administrators to monitor and manage
shared applications to ensure advanced security, high availability, and performance.
Function Accuracy Improved!
Another goal for redesigning Excel was to improve even further upon the already highly
accurate functions in our function library. With Excel 2010 we’ve designed new algorithms to
help improve over 45 statistical, financial, and mathematical functions.
More consistent names and new functions. Functions have been renamed to more accurately
reflect what they do and new versions of functions better align with statistical, industry, and
scientific definitions. For example, in Excel 2010 PERCENTILE.INC was added to have better
consistency with industry expectations.
Accurate by default. When a workbook created in a previous version is opened in Excel 2010,
all functions that were updated in Excel 2010 will recalculate with the new algorithms.
Compatibility functions. Older versions of the functions are still available to maintain
compatibility with previous versions of Excel. They are identified by a new icon when using
Formula AutoComplete, as shown in Figure 9.
6
PowerPivot for SharePoint requires Microsoft SQL Server® 2008 R2 or higher and SharePoint 2010.
16
Figure 9 – Easily identify compatibility functions when using Formula AutoComplete.
Quick Tip: To find a list of compatibility functions, on the Formulas tab, in the Function Library group,
click More Functions and then point to Compatibility.
Filter Capabilities Improved!
Finding what you need efficiently is a must for large worksheets. Filtering enables you to quickly
locate and display specific data in your tables, PivotTable and PivotChart views. But what about
searching through the available filters? You could have thousands, or more than a million of
available choices. With Excel 2010 you can use the new Search Filter capability and spend less
time sifting through large data sets.
Figure 10 – The new
Search Filter provides
instant search in your
filtering options.
17
Instant Search. Start by typing your search term and relevant items instantly display. Narrow
your results even further by deselecting those items you do not wish to display.
Filter and sort regardless of location. In an Excel table, table headers replace regular
worksheet headers at the top of columns when you scroll down in a long table. In Excel
2010, filter and sort options now remain visible with no need to freeze your panes as shown
in Figure 11.
Figure 11 - Filter and sort
options are always available
when you need them, no
scrolling required.
Quick Tips:
Check out the Add current selection to filter option, shown in Figure 10, when you use the Search
Filter. You can use this option for subsequent searches to add additional filter items and maintain
your previously filtered list.
Quickly turn a data range into a table so you can take advantage of everything tables have to offer.
On the Home tab in the Styles group, click Format as Table and make a selection from the gallery.
Solver Add-in Improved!
Perform what-if analysis using the redesigned Solver add-in. Find optimal solutions using
solving methods, such as the new Evolutionary solver, based on genetic and evolutionary
algorithms, along with improved linear and nonlinear methods. Newly added functionality
18
enables you to step through trial solutions and reuse your constraint models. Also find new
global optimization options, new Linearity and Feasibility reports, and more.
Figure 12 – Find a new
version of the Solver
add-in for Excel 2010.
64-bit Version New!
The 64-bit version of Excel enables you to take advantage of the power of 64-bit machines to
create even bigger, more complex workbooks.
7
Now you can break out of the two gigabyte in-
memory limit. Analyze large, complex datasets with ease and power without leaving Excel.
7
This option can only be installed on 64-bit systems. For installation instructions and more information visit:
19
Save time and simplify your work.
Recover Unsaved Versions New!
We’ve all done it. You work for a while, get the content just right, and then close your workbook
without saving. Maybe you thought the save prompt was for a different workbook that you
didn’t want or maybe you were just distracted while closing the file. The result is the same—your
work and the time you spent to create it have been lost. Well, not anymore!
Expanding on the AutoRecover capabilities that you may know from earlier versions of Excel,
you can now recover versions of files that you close without saving.
8
Figure 13: Access autosave and unsaved workbooks on the Info tab in Backstage view.
8
Recovering available unsaved documents and autosave versions requires you elect to save AutoRecover information. To keep an
autosave version until your next editing session you must also elect to keep the last autosaved version when you close without
saving. To access these options, in Backstage view click Options and then click Save.
20
Access up to the last five autosave versions of your previously saved active workbook. If you
save and close your workbook, all autosave versions will automatically be deleted. If you
close a previously saved workbook without saving, your last autosave version is kept until
your next editing session.
Recover workbooks that were never previously saved. Unsaved workbooks are saved for four
days before they are automatically deleted.
Quick Tip: Also recover unsaved workbooks from the Recent tab in Backstage view. Click Recover
Unsaved Workbooks at the bottom of the Recent Places list to open your UnsavedFiles folder.
Note: Recover unsaved versions is also available in Microsoft Word 2010 and Microsoft
PowerPoint® 2010.
Charting Performance Improved!
Charting performance has been improved in Excel 2010 and enhancements have been made to
formatting options to improve your productivity. Find the following and more when using Excel
2010 charts:
Data points are now limited only by available memory. The previous limit of 32,000 points
per data series on 2D charts has been removed and charts are no longer limited to a
maximum of 256,000 data points.
Access dialog boxes more efficiently. Double-click a chart element to access more formatting
options. And, as in Microsoft Excel 2007, you can keep the dialog box open and select other
elements on your chart to quickly switch between formatting options.
Formatting options at your fingertips. Right-click a chart element to display the Mini Toolbar
and use it to make a formatting change. You can also select and format other chart elements
right from the Mini Toolbar.
Quick Tip: Use the macro recorder to record your chart formatting and layout changes to speed up your
repetitive chart formatting tasks.
Equations New!
Create math equations with a rich set of equation editing tools. Excel 2010 includes a new built-
in equation editor that makes it easier to show equations in your worksheets. Add math
21
equations jotted down from your notes or use an equation to display a formula used in your
workbook to provide more meaningful data.
Office Themes Improved!
Additional out-of-the-box, Office themes in Excel 2010 offer formatting options to help you
create professional designs consistently across your workbooks. Simply select the Office theme
you want, and Excel 2010 does the rest.
Figure 14 - Use
Office themes
to coordinate
your
formatting.
Quickly obtain consistent formatting. Text, charts, graphics, tables, and drawing objects all
change to reflect the theme you have selected, helping ensure that all elements in your
workbook complement one another in a few simple clicks.
Predefine your formatting preferences. When you add new content, such as a graphic,
diagram, or chart, Excel 2010 will automatically match them to your chosen Office theme.
22
Quick Tip: It’s easy to create theme-enabled workbooks. When you choose your formatting options,
select colors from the Theme Colors palette and use the Theme Fonts from the top of the Font list,
labeled (Headings) and (Body). Additionally, apply theme fills (found at the bottom of the Shape Styles
gallery), used in PowerPoint 2010 as slide backgrounds, to your shapes for even more options to
coordinate all of your Office 2010 files.
Note: Office themes can be shared with Word, PowerPoint, Microsoft Outlook®, and now,
Microsoft Access® 2010.
Paste with Live Preview New!
Save time when reusing content copied from within Excel or other applications. Pasting content
in Excel 2010 has never been easier. Paste with Live Preview enables you to preview various
Paste Options, such as Keep Source Column Widths, No Borders, or Keep Source Formatting, so
you can visually determine how your pasted content will look prior to actually pasting. No more
using Undo and trying again, Paste with Live Preview helps you get it right the first time.
Figure 15 - Paste with Live Preview enables you to preview your options before you paste.
Simply hover your mouse pointer on Paste Options to preview results. Paste Option items
change contextually to best fit the content you are reusing and ScreenTips provide
additional information to help you make a decision.