Electric Circuits, 9th Edition P46 potx
Bạn đang xem bản rút gọn của tài liệu. Xem và tải ngay bản đầy đủ của tài liệu tại đây (745.41 KB, 10 trang )
426 Balanced Three-Phase Circuits
11.48 a) Calculate the reading of each wattmeter in the
circuit shown in Fig. PI 1.48 when Z =
13.44 +
/46.0811.
b) Check that the sum of the two wattmeter read-
ings equals the total power delivered to the load.
c) Check that
V3(W
l
- W
2
) equals the total mag-
netizing vars delivered to the load.
Figure PI 1.48
11.49 a) Calculate the complex power associated with
each phase of the balanced load in
Problem 11.17.
b) If the two-wattmeter method is used to measure
the average power delivered to the load, specify
the reading of each meter.
11.50 a) Find the reading of each wattmeter in the circuit
shown in Fig. PI 1.50 if Z
A
= 20 /30" ft,
Z
B
= 60 /<T ft, and Z
c
= 40 /-3()° ft.
b) Show that the sum of the wattmeter readings
equals the total average power delivered to the
unbalanced three-phase load.
Figure P11.50
11.51 The balanced three-phase load shown in Fig. PI 1.51
is fed from a balanced, positive-sequence, three-
phase Y-connected source. The impedance of the
line connecting the source to the load is negligible.
The line-to-neutral voltage of the source is 7200 V.
a) Find the reading of the wattmeter in watts.
b) Explain how you would connect a second
wattmeter in the circuit so that the two
wattmeters would measure the total power.
c) Calculate the reading of the second wattmeter.
d) Verify that the sum of the two wattmeter read-
ings equals the total average power delivered to
the load.
Figure P11.51
Sections 11.1-11.6
11.52 Refer to the Practical Perspective example:
PERSPECTIVE
a) Construct a power triangle for the substation
load before the capacitors are connected to
the bus.
b) Repeat (a) after the capacitors are connected to
the bus.
c) Using the line-to-neutral voltage at the substa-
tion as a reference, construct a phasor diagram
that depicts the relationship between V
AN
and
V
an
before the capacitors are added.
d) Assume a positive phase sequence and construct
a phasor diagram that depicts the relationship
between V
AB
and V
ab
.
11.53 Refer to the Practical Perspective example. Assume
PRACTICAL the frequency of the utilitv is 60 Hz.
PERSPECTIVE 1 J
a) What is the /xF rating of each capacitor if the
capacitors are delta-connected?
b) What is the /xF rating of each capacitor if the
capacitors are wye-connected?
11.54 Choose a single capacitor from Appendix H that is
closest to the /xF rating of the delta-connected
capacitor from Problem 11.53(a).
a) How much reactive power will a capacitor bank
using this new value supply?
b) What line-to-line voltage at the generating plant
will be required when this new capacitor bank is
connected to the substation bus?
11.55 Choose a single capacitor from Appendix H that is
closest to the /iF rating of the wye-connected
capacitor from Problem 11.53(b).
a) How much reactive power will a capacitor bank
using this new value supply?
b) What line-to-line voltage at the generating plant
will be required when this new capacitor bank is
connected to the substation bus?
Problems 427
11.56 In the Practical Perspective example, what happens
PRACTICAL to the voltage level at the generating plant if the
substation is maintained at 13.8 kV, the substation
load is removed, and the added capacitor bank
remains connected?
11.57 In the Practical Perspective example, calculate the
'ERSPECTWE
tota
l
nne
'
oss m
kW before and after the capacitors
are connected to the substation bus.
11.58 Assume the load on the substation bus in the
>ERSP"C™E
P
rac
tical Perspective example drops to 240 kW and
600 magnetizing kVAR. Also assume the capacitors
remain connected to the substation.
a) What is the magnitude of the line-to-line volt-
age at the generating plant that is required to
maintain a line-to-line voltage of 13.8 kV at the
substation?
b) Will this power plant voltage level cause prob-
lems for other customers?
11.59 Assume in Problem 11.58 that when the load drops
Sam
to 240 kW and 600 ma
g
net
izing kVAR the capaci-
tor bank at the substation is disconnected. Also
assume that the line-to-line voltage at the substa-
tion is maintained at 13.8 kV.
a) What is the magnitude of the line-to-line voltage
at the generating plant?
b) Is the voltage level found in (a) within the
acceptable range of variation?
c) What is the total line loss in kW when the capac-
itors stay on line after the load drops to
240 + /600 kVA?
d) What is the total line loss in kW when the capac-
itors are removed after the load drops to
240 + /600 kVA?
e) Based on your calculations, would you recom-
mend disconnecting the capacitors after the load
drops to 240 + /600 kVA? Explain.
JL _\
HAPT
12.1 Definition of the Laplace Transform p. 430
12.2 The Step Function p. 431
12.3 The Impulse Function p. 433
12.4 Functional Transforms p. 436
12.5 Operational Transforms p. 437
12.6 Applying the Laplace Transform p. 442
12.7 Inverse Transforms p. 444
12.8 Poles and Zeros of F(s) p. 454
12.9 Initial- and Final-Value Theorems p. 455
• CHAPTER OBJECTIVES
1 Be able to calculate the Laplace transform of a
function using the definition of Laplace
transform, the Laplace transform table, and/or a
table of operational transforms.
2 Be able to calculate the inverse Laplace
transform using partial fraction expansion and
the Laplace transform table.
3 Understand and know how to use the initial
value theorem and the final value theorem.
428
Introduction to the
Laplace Transform
We now introduce a powerful analytical technique that is
widely used to study the behavior of linear, lumped-parameter
circuits.
The method is based on the Laplace transform, which we
define mathematically in Section
12.1.
Before doing so, we need
to explain why another analytical technique is needed. First, we
wish to consider the transient behavior of circuits whose describ-
ing equations consist of more than a single node-voltage or mesh-
current differential equation. In other
words,
we want to consider
multiple-node and multiple-mesh circuits that are described by
sets of linear differential equations.
Second, we wish to determine the transient response of cir-
cuits whose signal sources vary in ways more complicated than
the simple dc level jumps considered in Chapters 7 and
8.
Third,
we can use the Laplace transform to introduce the concept of the
transfer function as a tool for analyzing the steady-state sinu-
soidal response of a circuit when the frequency of the sinusoidal
source is varied. We discuss the transfer function in Chapter 13.
Finally, we wish to relate, in a systematic fashion, the time-
domain behavior of a circuit to its frequency-domain behavior.
Using the Laplace transform will provide a broader understand-
ing of circuit functions.
In this chapter, we introduce the Laplace transform, discuss
its pertinent characteristics, and present a systematic method for
transforming from the frequency domain to the time domain.
ill tg- J IJ
M
Practical Perspective
Transient Effects
As we learned in Chapter 9, power delivered from electrical
wall outlets in the U.S. can be modeled as a sinusoidal volt-
age or current source, where the frequency of the sinusoid is
60 Hz. The phasor concepts introduced in Chapter 9 allowed
us to analyze the steady-state response of a circuit to a
sinu-
soidal source.
It is often important to pay attention to the complete
response of a circuit to a sinusoidal source. Remember that the
complete response has two parts—the steady-state response
that takes the same form as the input to the circuit, and the
transient response that decays to zero as time progresses.
When the source for a circuit is modeled as a 60 Hz sinusoid,
the steady-state response is also a 60 Hz sinusoid whose mag-
nitude and phase angle can be calculated using phasor circuit
analysis. The transient response depends on the components
that make up the circuit, the values of those components, and
the way the components are interconnected. The voltage and
current for every component in a circuit is the sum of a
tran-
sient part and a steady-state part, once the source is switched
into the circuit.
While the transient part of the voltage and current even-
tually decays to zero, initially this transient part, when added
to the steady-state part, may exceed the voltage or current
rating of the circuit component. This is why it is important to
be able to determine the complete response of a circuit. The
Laplace transform techniques introduced in this chapter can
be used to find the complete response of a circuit to a
sinu-
soidal source.
Consider the RLC circuit shown below, comprised of
components from Appendix H and powered by a 60 Hz
sinu-
soidal source. As detailed in Appendix H, the 10 mH induc-
tor has a current rating of 40 mA. The amplitude of the
sinusoidal source has been chosen so that this rating is met
in the steady state (see Problem 12.54). Once we have pre-
sented the Laplace transform method, we will be able to
determine whether or not this current rating is exceeded
when the source is first switched on and both the transient
and steady-state components of the inductor current are
active.
429
430 Introduction to the Laplace Transform
12.1 Definition of the Laplace
Transform
The Laplace transform of a function is given by the expression
2(/(0}
= /
f(tyr*dt
t
(12.1)
Laplace transform
• Jo
where the symbol i£{/(f)} is read "the Laplace transform of/(f)."
The Laplace transform of/(0 is also denoted F(s)\ that is,
F(s)
=
<£{/(f)}.
(12.2)
This notation emphasizes that when the integral in Eq. 12.1 has been evalu-
ated, the resulting expression is a function of s. In our applications,
t
repre-
sents the time domain, and, because the exponent of
e
in the integral of
Eq. 12.1 must be dimensionless,
s
must have the dimension of reciprocal time,
or frequency. The Laplace transform transforms the problem from the time
domain
to
the frequency domain. After obtaining the frequency-domain
expression for the unknown, we inverse-transform it back to the time domain.
If the idea behind the Laplace transform seems foreign, consider
another familiar mathematical transform. Logarithms are used to change
a
multiplication or division problem, such as A
=
BC, into a simpler addition
or subtraction problem: log A
=
log BC
=
log B
+
log C. Antilogs are
used to carry out the inverse
process.
The phasor is another transform; as we
know from Chapter
9,
it converts a sinusoidal signal into a complex number
for easier, algebraic computation
of
circuit values. After determining the
phasor value of a signal, we transform it back to its time-domain expression.
Both
of
these examples point out the essential feature of mathematical
transforms: They are designed to create a new domain to make the mathe-
matical manipulations easier. After finding the unknown in the new domain,
we inverse-transform it back to the original domain. In circuit analysis, we
use the Laplace transform to transform a set of integrodifferential equations
from the time domain
to a
set
of
algebraic equations
in
the frequency
domain. We therefore simplify the solution for an unknown quantity to the
manipulation of a set of algebraic equations.
Before we illustrate some of the important properties of the Laplace
transform, some general comments are in order. First, note that the inte-
gral in Eq. 12.1 is improper because the upper limit is infinite. Thus we are
confronted immediately with the question of whether the integral con-
verges.
In
other words, does
a
given /(f) have
a
Laplace transform?
Obviously, the functions of primary interest in engineering analysis have
Laplace transforms; otherwise we would not be interested in the trans-
form. In linear circuit analysis, we excite circuits with sources that have
Laplace transforms. Excitation functions such as
t
l
or
e'\
which do not
have Laplace transforms, are of no interest here.
Second, because the lower limit on the integral is zero, the Laplace
transform ignores /(f) for negative values of f. Put another way, F(s)
is
determined by the behavior of/(f) only for positive values of f.To empha-
size that the lower limit is zero, Eq. 12.1 is frequently referred to as the
one-sided, or unilateral, Laplace transform. In the two-sided, or bilateral,
Laplace transform, the lower limit is -co. We do not use the bilateral
form here; hence F(s) is understood to be the one-sided transform.
Another point regarding the lower limit concerns the situation when
f(t) has a discontinuity at the origin. If/(f) is continuous at the origin
—as,
12.2
The
Step Function 431
for example, in Fig. 12.1(a)—/(0) is not ambiguous. However, if/(/) has a
finite discontinuity at the origin—as, for example, in Fig. 12.1(b)—the
question arises as to whether the Laplace transform integral should
include or exclude the discontinuity. In other words, should we make the
lower limit 0~ and include the discontinuity, or should we exclude the dis-
continuity by making the lower limit 0
+
? (We use the notation
Q~
and 0
+
to
denote values of t just to the left and right of the origin, respectively.)
Actually, we may choose either as long as we are consistent. For reasons to
be explained later, we choose (T as the lower limit.
Because we are using 0" as the lower limit, we note immediately that
the integration from (T to 0
+
is zero. The only exception is when the dis-
continuity at the origin is an impulse function, a situation we discuss in
Section
12.3.
The important point now is that the two functions shown in
Fig. 12.1 have the same unilateral Laplace transform because there is no
impulse function at the origin.
The one-sided Laplace transform ignores f(t) for t < (T. What hap-
pens prior to (T is accounted for by the initial conditions. Thus we use the
Laplace transform to predict the response to a disturbance that occurs
after initial conditions have been established.
In the discussion that follows, we divide the Laplace transforms into
two types: functional transforms and operational transforms. A functional
transform is the Laplace transform of a specific function, such as sin
cat,
t,
e~
at
, and so on. An operational transform defines a general mathematical
property of the Laplace transform, such as finding the transform of the
derivative of /(f). Before considering functional and operational trans-
forms,
however, we need to introduce the step and impulse functions.
/(0
1.0
0.1 < 0
0
(b)
Figure 12.1 A A continuous and discontinuous function
at the origin, (a) f(t) is continuous at the origin,
(b) /(/) is discontinuous at the origin.
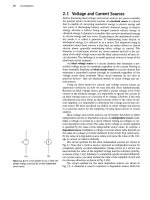
12.2 The Step Function
We may encounter functions that have a discontinuity, or jump, at the ori-
gin. For example, we know from earlier discussions of transient behavior
that switching operations create abrupt changes in currents and voltages.
We accommodate these discontinuities mathematically by introducing the
step and impulse functions.
Figure 12.2 illustrates the step function. It is zero for t < O.The sym-
bol for the step function is Ku{t). Thus, the mathematical definition of the
step function is
Ku(t) = 0, t < 0,
Ku(t) = K, t> 0.
(12.3)
If K is 1, the function defined by Eq. 12.3 is the unit step.
The step function is not defined ait = 0. In situations where we need to
define the transition between 0" and 0
+
, we assume that it is linear and that
fit)
K
0
Figure 12.2 A The step function.
Ku(Q) = 0.5K.
(12.4)
As before, 0 and 0
+
represent symmetric points arbitrarily close to the
left and right of the origin. Figure 12.3 illustrates the linear transition from
0" to 0
+
.
A discontinuity may occur at some time other than t = 0; for exam-
ple,
in sequential switching. A step that occurs at t = a is expressed as
Ku(t - rt).Thus
Ku(t - a) = 0, t < a,
Ku(t - a) = K
%
t > a.
(12.5)
fit)
K
0.5 K
V>
0~ 0
+
Figure 12.3 A The linear approximation to the step
function.
432 Introduction to the Laplace Transform
/(0
K
Figure 12.4 • A step function occurring at t = a
when a > 0.
/(0
£
0
Figure 12.5 • A step function Ku(o - t) for a > 0.
If a > 0, the step occurs to the right of the origin, and if a < 0, the step
occurs to the left of the origin. Figure 12.4 illustrates Eq. 12.5. Note that
the step function is 0 when the argument t - a is negative, and it is K
when the argument is positive.
A step function equal to K for t < a is written as Ku(a - t). Thus
Ku(a - t) = K, t < rt,
Ku(a - t) = 0, t > a.
(12.6)
The discontinuity is to the left of the origin when a < 0. Equation 12.6 is
shown in Fig. 12.5.
One application of the step function is to use it to write the mathe-
matical expression for a function that is nonzero for a finite duration but is
defined for all positive time. One example useful in circuit analysis is a
finite-width pulse, which we can create by adding two step functions. The
function K[u(t -1)- u(t - 3)] has the value K for 1 < t < 3 and the
value 0 everywhere else, so it is a finite-width pulse of height K initiated at
t = 1 and terminated at t = 3. In defining this pulse using step functions,
it is helpful to think of the step function u(t
—
1) as "turning on" the con-
stant value K at t = 1, and the step function —u(t - 3) as "turning off" the
constant value K at t = 3. We use step functions to turn on and turn off
linear functions at desired times in Example 12.1.
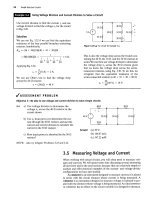
Example 12.1 Using Step Functions to Represent a Function of Finite Duration
Use step functions to write an expression for the
function illustrated in Fig. 12.6.
Figure 12.6 • The function for Example 12.1.
Solution
The function shown in Fig. 12.6 is made up of linear
segments with break points at 0,1,3, and 4 s.To con-
struct this function, we must add and subtract linear
functions of the proper slope. We use the step func-
tion to initiate and terminate these linear segments
at the proper times. In other words, we use the step
function to turn on and turn off a straight line with
the following equations: +2/, on at t = 0, off at
t = 1; -2/ + 4, on at t = 1, off at t = 3; and
+2t - 8, on at t = 3, off at t = 4. These straight
line segments and their equations are shown in
Fig.
12.7.
The expression for f(t) is
/(/) = 2t[u(t) - u(t - 1)] + (-2/ + 4)[u(t - 1)
- u(t - 3)] + (2f - 8)[u(t -3)- u(t - 4)].
/(0
4
2
0
-2
-4
\ /
/\-2t
+
4
/ 1 XI
1 2\
—
'
1
3
/A
t(s)
Figure 12.7 • Definition of the three line segments turned
on and off with step functions to form the function shown
in Fig. 12.6.
NOTE: Assess your understanding of step functions by trying Chapter Problems 12.2 and 12.3.
12.3 The Impulse Function 433
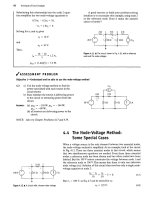
12.3 The Impulse Function
When we have a finite discontinuity in a function, such as that illustrated
in Fig. 12.1(b), the derivative of the function is not defined at the point of
the discontinuity. The concept of an impulse function
1
enables us to define
the derivative at a discontinuity, and thus to define the Laplace transform
of that derivative. An impulse is a signal of infinite amplitude and zero
duration. Such signals don't exist in nature, but some circuit signals come
very close to approximating this definition, so we find a mathematical
model of an impulse useful. Impulsive voltages and currents occur in cir-
cuit analysis either because of a switching operation or because the circuit
is excited by an impulsive source. We will analyze these situations in
Chapter 13, but here we focus on defining the impulse function generally.
To define the derivative of a function at a discontinuity, we first assume
that the function varies linearly across the discontinuity, as shown in
Fig.
12.8,
where we observe that as e
—>
0, an abrupt discontinuity occurs at
the origin. When we differentiate the function, the derivative between —e
and +e is constant at a value of l/2e. For t > e, the derivative is -ae~
a
^'~
e
\
Figure 12.9 shows these observations graphically. As e approaches zero, the
value of f'(t) between ±e approaches infinity. At the same time, the dura-
tion of this large value is approaching zero. Furthermore, the area under
/'(0 between ±e remains constant as e
—»
0. In this example, the area is
unity. As e approaches zero, we say that the function between ±e
approaches a unit impulse function, denoted 8(t). Thus the derivative of/(f)
at the origin approaches a unit impulse function as e approaches zero, or
Figure 12.8 •
A
magnified view of the discontinuity
in
Fig. 12.1(b), assuming a linear transition between -e
and +e.
/'(0
Figure 12.9 • The derivative of the function shown
in Fig. 12.8.
/'(0)-»5(0 ase-*0.
If the area under the impulse function curve is other than unity, the
impulse function is denoted K8(t), where K is the area. K is often referred
to as the strength of the impulse function.
To summarize, an impulse function is created from a variable-parameter
function whose parameter approaches zero. The variable-parameter func-
tion must exhibit the following three characteristics as the parameter
approaches zero:
1.
The amplitude approaches infinity.
2.
The duration of the function approaches zero.
3.
The area under the variable-parameter function is constant as the
parameter changes.
Many different variable-parameter functions have the aforementioned
characteristics. In Fig. 12.8, we used a linear function /(f) = 0.5f/e + 0.5.
Another example of a variable-parameter function is the expo-
nential function:
/M
=
Y/
m
-
(12.7)
As e approaches zero, the function becomes infinite at the origin and at the
same time decays to zero in an infinitesimal length of time. Figure 12.10 Figure 12.10 •
A
variable-parameter function used to
illustrates the character of /(f) as e
—>
0. To show that an impulse function generate an impulse function.
The impulse function is also known as the Dirac delta function.
434 Introduction to the Laplace Transform
is created as e
—*
0, we must also show that the area under the function is
independent of e. Thus,
Area = / —
e'
le
dt
+ / —e'^dt
,2e J
{)
2e
(12.8)
_
K
. til
~ 2e '1/e
K K
' 2
+
2
0
K
+ —
= K,
which tells us that the area under the curve is constant and equal to K units.
Therefore, as e -> 0, f(t) -» #8(0-
Mathematically, the impulse function is defined
r
K8{t)dt = K\
(12.9)
8(0 = 0, r * 0.
(12.10)
/(0
(*)
K8(t) K8(t - a)
0
Figure 12.11 • A graphic representation of the impulse
/f 5(0 and KS(t - a).
Equation 12.9 states that the area under the impulse function is constant.
This area represents the strength of the impulse. Equation 12.10 states
that the impulse is zero everywhere except at t — 0. An impulse that
occurs at t = a is denoted K8(t — a).
The graphic symbol for the impulse function is an arrow. The strength
of the impulse is given parenthetically next to the head of the arrow.
Figure 12.11 shows the impulses K8(t) and K8(t - a).
An important property of the impulse function is the sitting property,
which is expressed as
f(t)8(t - a)dt = f(a),
(12.11)
where the function /(0 is assumed to be continuous at t = a; that
is,
at the
location of the impulse. Equation 12.11 shows that the impulse function
sifts out everything except the value of /(0 at f = «. The validity of
Eq. 12.11 follows from noting that 8(t - a) is zero everywhere except at
t = «, and hence the integral can be written
I =
f(t)S(t -a)dt =
f(t)8(t - a)dt. (12.12)
But because /(0 is continuous at a, it takes on the value f(a) ast^>a, so
/ =
f(a)8(t - a)dt = f(a) / 8(t - a)dt
(12.13)
We use the sifting property of the impulse function to find its Laplace
transform:
?£{8(t)}
I 8{t)e-
sl
dt= 8{t)dt = U (12.14)
hv JO"
which is an important Laplace transform pair that we make good use of in
circuit analysis.
12.3 The Impulse Function 435
We can also define the derivatives of the impulse function and the
Laplace transform of these derivatives. We discuss the first derivative,
along with its transform and then state the result for the higher-order
derivatives.
The function illustrated in Fig. 12.12(a) generates an impulse function
as €—»0. Figure 12.12(b) shows the derivative of this impulse-generating
function, which is defined as the derivative of the impulse [S'(t)] as e
—*
0.
The derivative of the impulse function sometimes is referred to as a
moment function, or unit doublet.
To find the Laplace transform of 8'(t), we simply apply the defining
integral to the function shown in Fig. 12.12(b) and, after integrating, let
e^O. Then
L{8'(t)\
lim
= lim
~^f
st
dt +
€
6
— \e*dt
se I „—$e
e"
e
+ e
6-0
se
*
= lim
se
se _
se
-se
r
i
i
i
-e 0
»/«
2
w
1/e
2
el
I
1
o 2es
(b)
Figure 12.12 A The first derivative of the impulse
function,
(a) The impulse-generating function used to
define the first derivative of the impulse, (b) The first
derivative of the impulse-generating function that
approaches 8'(t) as e —»0.
= lim
e-»0
sV
+ s
2
e~
S€
2s
= s.
(12.15)
In deriving Eq. 12.15, we had to use l'Hopital's rule twice to evaluate the
indeterminate form 0/0.
Higher-order derivatives may be generated in a manner similar to
that used to generate the first derivative (see Problem 12.6), and the defin-
ing integral may then be used to find its Laplace transform. For the nth
derivative of the impulse function, we find that its Laplace transform sim-
ply is s"; that is,
£{#">(/)} = s
n
.
(12.16)
Finally, an impulse function can be thought of as a derivative of a step
function; that is,
5(0-
du(t)
dt
(12.17)
Figure 12.13 presents the graphic interpretation of Eq.
12.17.
The function
shown in Fig. 12.13(a) approaches a unit step function as e
—>
0. The func-
tion shown in Fig. 12.13(b)—the derivative of the function in
Fig. 12.13(a)—approaches a unit impulse as e
—*•
0.
The impulse function is an extremely useful concept in circuit analy-
sis,
and we say more about it in the following chapters. We introduced the
concept here so that we can include discontinuities at the origin in our
def-
inition of the Laplace transform.
NOTE: Assess your understanding of the impulse function by trying
Chapter Problems 12.7,12.9, and 12.10.
fit)
1.0
/
-e ()
A
i
e
(a)
1
2e
-e 0 e
(b)
Figure 12.13 • The impulse function as the derivative
of the step function: (a) f(t) -» u(t) as e -* 0; and
(b)/'(/)->fi(0ase-»0.