Red Hat Linux Networking , System Administration (P29) ppsx
Bạn đang xem bản rút gọn của tài liệu. Xem và tải ngay bản đầy đủ của tài liệu tại đây (698.75 KB, 30 trang )
Summary
In this chapter, you learned how to back up and restore your file system. You
learned how to choose which files are important to back up and to choose a
backup medium, a backup method, and a tape rotation schedule appropriate
for the needs of your situation. You also learned how to use low-level archiv-
ing tools such as tar and dump to produce archives and file system data and
to restore corrupted file system data from archives. In addition, you learned
how to configure and use AMANDA, an advanced archiving tool.
804 Chapter 31
39_599496 ch31.qxd 8/30/05 7:13 PM Page 804
805
Performance
Monitoring
IN THIS CHAPTER
■■ System Performance Monitoring Tools
■■ Measuring Memory Usage
■■ Viewing Running Tasks
■■ Monitoring I/O Activity
■■ Using sar
This chapter describes some of the tools you can use to monitor the status and
performance of your Fedora Core or RHEL system. Utilities like free, top,
and ps provide basic information about the status of the system at given
points in time. For ongoing monitoring, you would use tools like iostat,
vmstat, and sar.
System-Performance-Monitoring Tools
The first group of tools this chapter discusses enables you to take snapshots of
system performance at a given point in time. You can use this data to create
baseline metrics of your system’s performance. This historical data serves as a
guide against which you measure the impact of changes you make. You can
use a variety of tools, many more, in fact, than this chapter covers. The six
you’ll look at are listed here in alphabetical order:
■■ free — Reports the amount of free and used memory in the system
■■ iostat — Provides detailed CPU and I/O usage information
■■ sar — Collects, saves, or reports on a comprehensive list of system
activity data
CHAPTER
32
40_599496 ch32.qxd 8/30/05 7:14 PM Page 805
■■ slabtop — Reports kernel memory usage
■■ top — Displays a real-time list of running processes
■■ vmstat — Shows virtual memory and I/O system usage
One of the things you will notice is that each utility has some overlap with
other utilities. For example, free and vmstat both report on virtual memory
usage, although vmstat provides considerably more detail than does free.
Likewise, vmstat and iostat can both provide I/O (input/output) usage
data; again, iostat’s I/O analysis is more complete than vmstat’s is. The
following sections disregard these areas of overlap and focus on what each
utility does best. For instance, you won’t see any discussion of vmstat’s disk
I/O-specific features, nor will you read much about iostat’s ability to report
on running processes (an area in which it overlaps with top).
Measuring Memory Usage
Even on systems that seem to have ample physical RAM, it is still a good idea
to know how much memory is in use and how much is available. Excessive
memory consumption, perhaps due to a memory leak in a running program,
can slow a system down and eventually force a reboot to reclaim the “lost”
memory. At the highest level, you can use free command to show a quick
report of how much memory is in use and how much is free. vmstat shows
more detail about memory usage, especially swap usage. The slabtop com-
mand shows you how the kernel itself is allocating memory.
Memory Usage as Seen by Users and Processes
You can use two commands to obtain summary information about the system’s
memory usage. The free command shows information about the amount of
memory that is used and unused, including both physical RAM and swap
space. vmstat shows the same information in greater detail.
Free’s syntax is:
free [-b|-k|-m] [-o] [-s secs] [-t]
Invoked without command line arguments, free’s output looks like the
following:
$ free
total used free shared buffers cached
Mem: 515800 500652 15148 0 0 255356
-/+ buffers/cache: 245296 270504
Swap: 1052248 536 1051712
806 Chapter 32
40_599496 ch32.qxd 8/30/05 7:14 PM Page 806
If you want the output to be displayed in bytes, rather than kilobytes, use
the -b option; use -m to display the output in megabytes; -k displays the out-
put in kilobytes, the default. If you’re math challenged, the -t option adds a
line to the bottom of the output showing totals values.
The -o option disables the -/+ buffers/cached: line, which shows adjust-
ments made to the used and free physical RAM. These adjustments are neces-
sary if you want to know how much RAM is actually in use and how much
RAM the kernel has set aside for its own use. The kernel keeps a certain
amount of RAM available for I/O and memory buffers to facilitate I/O. The
amount of buffer memory varies over time as it is used and released. From the
point of view of the system as a whole, RAM used as buffer memory is always
“in use,” even if the kernel has not allocated it at a given point in time. From
the kernel’s point of view, however, unused buffer memory is just that, unused
(or free). Without the -o option, you see memory usage from the kernel’s point
of view. With the -o option, you can visualize memory consumption from the
view of the system as a whole. In the free example just shown, just over 263
Mb (270,504 Kb) is “free” from the kernel’s point of view. If you use the -o
option, you won’t see the amount of amount of RAM allocated as kernel buffer
memory.
The other columns of output show the amount of memory allocated as
shared memory (System V IPC shared memory, to be precise), additional non-
specific buffer memory, and the amount of cached data in memory. The shared
memory column should be disregarded because it is no longer used.
The final option that might prove useful is the -s secs option, which
causes free to redisplay its report every secs seconds. The following exam-
ple shows free’s output immediately before and during a kernel compilation:
$ free -s5 -m -o
total used free shared buffers cached
Mem: 503 496 7 0 0 253
Swap: 1027 0 1027
total used free shared buffers cached
Mem: 503 495 8 0 0 253
Swap: 1027 0 1027
total used free shared buffers cached
Mem: 503 494 8 0 0 243
Swap: 1027 0 1027
total used free shared buffers cached
Mem: 503 489 14 0 0 244
Swap: 1027 0 1027
This example used the -m option to display the output in megabytes, the -o
option to turn off the buffer adjustment, and the -s5 option to refresh the display
Performance Monitoring 807
40_599496 ch32.qxd 8/30/05 7:14 PM Page 807
every five seconds. The kernel compilation started between the first and second
updates. One of the features you’ll notice in the bold-faced section is that the
amount of cached data fell when the kernel build process started.
Presumably, this occurred because data the kernel needed had to be read from
disk, forcing a certain amount of cached data to be flushed.
vmstat digs deeper into memory usage than free and pays particular
attention to virtual memory (swap) usage. If your system is constantly swap-
ping, disk I/O will slow to a crawl and the system will seem slow to respond
to user input. vmstat makes it possible for you to detect the problem. You can
then use top or one of the other utilities discussed in this chapter to identify
what is causing the excessive swapping. First, however, vmstat’s syntax,
bearing in mind that this discussion ignores options not related to virtual
memory:
vmstat [-S k|K|m|M] [-a] [-n] [secs [cnt]]
vmstat [-S k|K|m|M] -m
vmstat [-S k|K|m|M] -s
To change the display unit, which defaults to bytes, use -S k for units of
1000 bytes, -S K for true kilobytes (1024 bytes), -S m for units of 1,000,000
bytes, or -S M for true megabytes (1,048,576 bytes). The examples in the text
use -S K. Certain vmstat reports can be refreshed every secs seconds and, if
cnt is specified, will refresh cnt times every secs seconds before vmstat
terminates. In its simplest usage, vmstat’s output looks like the following:
$ vmstat -S K
procs memory swap io system cpu
r b swpd free buff cache si so bi bo in cs us sy id wa
2 0 852 16132 0 249232 0 0 33 26 10 82 94 2 4 0
This information shows only the average usage since the system was
booted. To get information about current usage, you must request a refreshing
display using secs and, if you multiple reports, cnt, as shown in the follow-
ing example:
$ vmstat -S K 5 5
procs memory swap io system cpu
r b swpd free buff cache si so bi bo in cs us sy id wa
3 0 852 4880 0 250120 0 0 33 26 15 135 93 3 4 0
2 0 852 14628 0 250308 0 0 0 30 1132 405 94 6 0 0
3 0 852 14168 0 250444 0 0 0 31 1131 418 93 7 0 0
4 0 852 6780 0 250528 0 0 0 35 1130 375 94 6 0 0
4 0 852 11856 0 247484 0 0 0 156 1149 422 93 7 0 0
808 Chapter 32
40_599496 ch32.qxd 8/30/05 7:14 PM Page 808
What information is shown? In the procs section, the r column shows the
number of processes that are ready to run and waiting for their turn to run on
the CPU and the b column shows the number of processes that are blocked, or
sleeping, and thus not ready to run. In the first example, therefore, two processes
are ready to run and waiting for CPU time and no processes are blocked.
The four columns under the memory heading, show the following information:
■■ swpd — The amount of virtual memory in use
■■ free — The amount of physical RAM not in use
■■ buff — The amount of physical RAM used as buffers
■■ cache — The amount of physical RAM used as cache
As you can see in the second example, created during a kernel compile, the
amount of free and cache memory fluctuates constantly; the more active the
system, the greater the fluctuation.
If you specify -a, inact and active replace the buff and cache columns
under the memory heading. inact displays the amount of inactive memory
and active displays the amount of active memory. Inactive memory is the
buffer memory the free command shows as free (unused) when buffer
adjustments are enabled; active memory is memory that is both allocated and in
use and maps to the used buffer memory reported by the free command. The
following vmstat example shows the effect of the -a option:
$ vmstat -S K -a 5 5
procs memory swap io system cpu
r b swpd free inact active si so bi bo in cs us sy id wa
4 0 1500 13132 114240 346908 0 0 33 26 17 143 93 3 4 0
3 0 1500 14412 114308 345512 0 0 71 116 1172 486 91 9 0 0
4 0 1500 10704 114400 349152 0 0 22 36 1220 849 92 8 0 0
4 0 1500 20944 114416 338936 0 0 10 82 1145 521 94 6 0 0
3 0 1500 12240 114484 347584 0 0 13 49 1342 1437 92 8 0 0
Under the swap heading, si shows the amount of memory that has been
read in from the swap device (or devices, if there are multiple swap files or
partitions) and so the amount of memory that has been written out to a swap
device. As you can see in the example just shown, swap usage on this system,
even during a kernel compile, is negligible.
In the io section, the columns bi and bo show the number of disk blocks (in
units of 1024 bytes) read from and written to, respectively, the system’s block
devices. Under the system heading, in lists the number of interrupts received
per second and cs shows the number of context switches per second. Values
under the cpu heading, finally, show the disposition of CPU usage, with each
column expressed as a percentage of total CPU time (due to rounding, the val-
ues might not add to 100 percent). The specific columns are:
Performance Monitoring 809
40_599496 ch32.qxd 8/30/05 7:14 PM Page 809
■■ us — The percentage of CPU time spent running user, or nonkernel, code
■■ sy — The percentage of time spent executing system, or kernel, code
■■ id — The percentage of CPU time that the CPU is idle
■■ wa — The percentage of CPU time spent waiting for I/O to complete
Examining Kernel Memory Usage
The memory usage information discussed so far examined memory from the
point of view of the user or running processes. You haven’t seen with any
amount of detail how the kernel itself is using memory. The last vmstat option,
-m, gives you a window into the kernel’s internal memory usage. The -m option
causes vmstat to display kernel slab usage. Slabs are caches of frequently used
kernel memory objects, such as inodes, directory entries, file pointers, and ran-
dom blocks of memory of specific sizes, such as 8192 bytes, 4096 bytes, and so
on. Rather than use vmstat to view slab usage, however, you should use
slabtop, which does for slabs what the top command does for processes,
namely, show slab usage in a real-time updated format. Slabtop’s syntax is:
slabtop [-d secs] [-s sort] [-o]
-d secs specifies the number of seconds to pause between updates. -o tells
slabtop to display its output once and then exit. The -s sort option sets the
sort order, which defaults to the number of slab objects descending order, for
the displayed slabs to sort. sort can be one of the values listed in Table 32-1.
Table 32-1 slabtop Sorting Criteria
CRITERIA ORDER DESCRIPTION
a Ascending Sort by the number of active objects
b Ascending Sort by the number of objects per slab
c Descending Sort by cache size
l Descending Sort by the number of slabs
v Descending Sort by the number of active slabs
n Ascending Sort by the slab name
o Descending Sort by the number of objects (this the default sort
order)
p Descending Sort by the number of pages per slab
s Descending Sort by the object size
u Descending Sort by cache utilization
810 Chapter 32
40_599496 ch32.qxd 8/30/05 7:14 PM Page 810
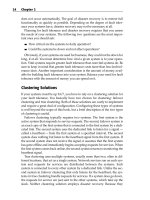
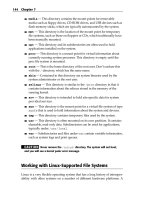
Figure 32-1 Viewing slabtop’s default output.
Invoked with no options, slabtop’s output resembles Figure 32-1.
The slab cache listing, updated every three seconds by default, shows
detailed slab cache information. The top five lines show summary information
for the number of individual objects, the total number of slabs containing
objects, the number of slab caches, and slab size statistics. The bottom portion
of the display shows the specifics for each type of slab cache sorted in descend-
ing order by the object type. You can change the sort order at runtime by press-
ing the key associated with the sort criteria that interests you (see Table 32-1).
TIP The p sort option for sorting slabtop’s output by the number of pages
per slab does not appear to function in slabtop version 3.2.3. However, you
can view this information using the following sort invocation:
$ sort -k6,6 -nr < /proc/slabinfo | cut -f1 -d:
size-131072(DMA) 0 0 131072 1 32
size-131072 0 0 131072 1 32
size-65536(DMA) 0 0 65536 1 16
size-65536 4 4 65536 1 16
size-32768(DMA) 0 0 32768 1 8
size-32768 49 49 32768 1 8
size-16384(DMA) 0 0 16384 1 4
size-16384 3 3 16384 1 4
tcpv6_sock 1 5 1376 5 2
task_struct 120 120 1392 5 2
The sixth column shows the number of pages per slab. To view the output
sorted in ascending order, omit -r:
$ sort -k6,6 -n < /proc/slabinfo | cut -f 1 -d:
# name <active_objs> <num_objs> <objsize> <objperslab>
Performance Monitoring 811
40_599496 ch32.qxd 8/30/05 7:14 PM Page 811
<pagesperslab>
slabinfo - version
anon_vma 3069 3213 32 119 1
arp_cache 2 20 192 20 1
as_arq 0 0 64 61 1
avc_node 12 600 52 75 1
bdev_cache 14 18 608 6 1
bio 287 287 96 41 1
biovec-1 293 452 16 226 1
biovec-16 260 260 192 20 1
Again, the sixth column shows the number of pages per slab.
If you run slabtop on a kernel that was compiled with the configuration
option CONFIG_DEBUG_SLAB enabled, you will see additional slab cache statis-
tics. The first line of the output will include (statistics) and the real-time display
will show five additional columns:
■■ The maximum number of active objects in the slab
■■ The number of times objects have been allocated
■■ The number of times new pages have added to the cache (cache growth)
■■ The number of times unused pages have been removed from the cache
(cache reaping)
■■ The number of errors allocating new pages to the cache
Unless you run a debugging kernel and are actively working on the kernel,
you won’t need this additional information. Nevertheless, you will at least
know how to produce this information if someone asks for it.
Viewing Running Tasks
In many cases, you will be less concerned about how much memory a process
is using and more concerned about what processes are running, or perhaps
more likely, what processes are running out of control. The canonical tools for
viewing running processes are ps and top. ps gives you a snapshot view of
the currently active processes, and top gives you a real-time updated display
of running processes.
812 Chapter 32
40_599496 ch32.qxd 8/30/05 7:14 PM Page 812
Getting Started with ps
The implementation of ps that is used on Linux systems (from the procps
suite) is a classic example of a Linux command gone horribly wrong. It has far
too many options, a number of which are redundant. On the other hand, it
lacks built-in email functionality, so ps might yet be salvageable. Seriously, ps
is a powerful tool for viewing the current process list. Refer to the section titled
“Obtaining Process Information” in Chapter 28 for discussions about addi-
tional process management programs.
Tables 32-2 through 32-5 borrow the layout of ps’s syntax description from
its manual page and organize each group of options into tables based on the
options’ purpose. ps supports both Unix98 options, which are preceded by a
hyphen (-), and BSD options, which lack the initial Where the functionality
is identical or very similar, the BSD options have been omitted. In some cases,
apparently identical Unix98 and BSD are listed because the BSD option shows
different output from the similarly invoked Unix98 option.
The options from this list that you’ll most likely use are -e to select all
process, r to select only running processes, and -N to reverse the meaning of
the selection criteria. -N helps you express selection criteria for which there are
no command line options. For example, if you want to see all processes except
those owned by the users bubba and root (see the -u, -U, and U options in
Table 32-3), you might use the following command:
$ ps U bubba U root -N
PID TTY STAT TIME COMMAND
3947 ? Ss 0:00 portmap
4142 ? SLs 0:00 ntpd -u ntp:ntp -p /var/run/ntpd.pid
4179 ? Ss 0:03 xfs -droppriv -daemon
4217 ? Ss 0:00 dbus-daemon-1 system
Table 32-2 Basic Process Selection
OPTION DESCRIPTION
-N Negates the selection criteria specified with other options
-a Selects all processes with a TTY except session leaders
-d Selects all except session leaders
-e Selects all processes
T Selects all processes on the invoking terminal
r Selects only running processes
x Selects processes without controlling TTYs
Performance Monitoring 813
40_599496 ch32.qxd 8/30/05 7:14 PM Page 813
By default, ps selects all processes with the same effective user ID (euid) as the
current user and shows the PID, TTY, accumulated CPU time, and the program
name. However, if your ps invocation includes BSD-style options (options that
lack an initial -) the display will also include the process status and show the
complete command line used, as shown in the previous example. If you replace
the BSD-style U option with -u, the output looks slightly different:
$ ps -u bubba -u root -N
PID TTY TIME CMD
3947 ? 00:00:00 portmap
4142 ? 00:00:00 ntpd
4179 ? 00:00:03 xfs
4217 ? 00:00:00 dbus-daemon-1
This characteristic of ps can be aggravating, so if ps seems to refuse to dis-
play the output you want or expect, make sure you are not mixing Unix98 and
BSD options.
Table 32-3 Process Selection
OPTION DESCRIPTION
-C command Selects by the command name matching pattern command
-G rgid | name Selects by real group ID (RGID) rgid or group name
-p pid Selects by PID pid
p pid Selects by PID pid and displays the program executed
-U ruid | name Selects by real user ID (RUID) ruid or user name
-u euid | name Selects by effective user ID (EUID) euid or user name
U name Selects processes for user name and the program executed
Table 32-4 Standard Output Formats
OPTION DESCRIPTION
-f Displays full listing
-j Displays output in jobs format
j Displays output in job control format
-l Displays output in long format
l Display long output format
s Displays output in signal format
v Displays output in virtual memory format
814 Chapter 32
40_599496 ch32.qxd 8/30/05 7:14 PM Page 814
The options for selecting output formats make it much easier for you to
view the process information that you want. Here again, the distinction
between the standard Unix98-style options and BSD-style options rears its
ugly head. Notice in the following example the difference between the Unix98
-j option, which displays the selected processes in jobs format, and the BSD j
option, which shows the selected processes in job control format:
$ ps -j
PID PGID SID TTY TIME CMD
12002 12002 12002 pts/2 00:00:00 bash
12111 12111 12002 pts/2 00:00:00 ps
$ ps j
PPID PID PGID SID TTY TPGID STAT UID TIME COMMAND
11457 11458 11458 11458 pts/1 11992 Ss 500 0:00 /bin/bash
11458 11478 11478 11458 pts/1 11992 S 500 0:08 jpilot
11458 11992 11992 11458 pts/1 11992 S+ 500 0:00 more ps.txt
12001 12002 12002 12002 pts/2 12113 Ss 500 0:00 /bin/bash
12002 12113 12113 12002 pts/2 12113 R+ 500 0:00 ps j
The Unix98 format produced by -j is less informative than the BSD output
format produced by j, consisting of only the PID, the process group ID (PGID),
the session ID (SID), the TTY on which the program is running, the cumulative
CPU time, and the bare command name. In many situations, the Unix98 output
will be all you need. The BSD output is much more informative (at least in this
case), showing all of the processes owned by the current user, not just the
processes running on the current TTY (which is pts/2).
The difference or lack of difference between Unix98 and BSD ps options is
even more apparent with the -l and l options, both of which display infor-
mation in so-called long format:
$ ps -l
F S UID PID PPID C PRI NI ADDR SZ WCHAN TTY TIME CMD
0 S 500 12002 12001 0 76 0 - 1488 wait pts/2 00:00:00 bash
0 R 500 12112 12002 0 78 0 - 887 - pts/2 00:00:00 ps
$ ps l
F UID PID PPID PRI NI VSZ RSS WCHAN STAT TTY TIME COMMAND
0 500 11458 11457 15 0 4852 1492 wait Ss pts/1 0:00 /bin/bash
0 500 11478 11458 16 0 17164 9044 - S pts/1 0:08 jpilot
0 500 11992 11458 16 0 4284 620 - S+ pts/1 0:00 more ps.txt
0 500 12002 12001 17 0 5952 1452 wait Ss pts/2 0:00 /bin/bash
0 500 12114 12002 19 0 2548 624 - R+ pts/2 0:00 ps l
The chief difference in the two long format output styles is that, as before,
the BSD-style output includes more information and the different values for
process priorities. You can see that the bash process whose PID is 12001 has a
priority of 76 in the Unix98 output format and 17 in the BSD format.
Performance Monitoring 815
40_599496 ch32.qxd 8/30/05 7:14 PM Page 815
Table 32-5 Modifying Output Format
OPTION DESCRIPTION
C Uses raw CPU time for %CPU instead of a decaying average
c Shows the true command name
e Shows environment after the command
f Displays process hierarchy as ASCII art (forest)
h Suppresses header lines (repeats header lines in BSD personality)
-H Shows process hierarchy (forest)
S Includes some dead child process data (as a sum with the parent)
-w Displays output in wide format
w Displays output in wide format
The options for modifying the output format make it possible to do some
very interesting things with ps. For example, to see a complete list of process
in a nicely formatted ASCII art tree, try the following command:
$ ps f -ej
5216 5048 5048 ? S 0:00 \_ /bin/sh /usr/lib/firefox-1.0.3/firefo
5253 5048 5048 ? S 0:00 | \_ /bin/sh /usr/lib/firefox-1.0.3/ru
5258 5048 5048 ? Sl 285:27 | \_ /usr/lib/firefox-1.0.3/firefo
11457 5048 5048 ? S 0:03 \_ konsole
11458 11458 11458 pts/1 Ss 0:00 | \_ /bin/bash
11478 11478 11458 pts/1 S 1:58 | \_ jpilot
14700 14700 11458 pts/1 S+ 0:00 | \_ less ps.txt
12001 5048 5048 ? S 0:03 \_ konsole
12002 12002 12002 pts/2 Ss 0:00 | \_ /bin/bash
14709 14709 12002 pts/2 R+ 0:00 | \_ ps f -ej
14575 5048 5048 ? S 0:00 \_ kio_file [kdeinit] kio_file file /tmp
5051 5048 5048 ? S 0:00 dcopserver nosid
The value in viewing running processes in a tree format is that you can
instantly see the parent-child relationships between processes without having
to connect the dots using each process’s PPID (parent PID). This also high-
lights another side effect of ps’s multiple personalities: there’s usually more
than one way to get identical or nearly identical results. For example, the fol-
lowing command shows another way to view a process tree:
$ ps axfj
5048 5216 5048 5048 ? -1 S 500 0:00 \_ /bin/sh /usr/lib/fi
5216 5253 5048 5048 ? -1 S 500 0:00 | \_ /bin/sh /usr/li
5253 5258 5048 5048 ? -1 Sl 500 285:27 | \_ /usr/lib/fi
5048 11457 5048 5048 ? -1 S 500 0:03 \_ konsole
816 Chapter 32
40_599496 ch32.qxd 8/30/05 7:14 PM Page 816
11457 11458 11458 11458 pts/1 14700 Ss 500 0:00 | \_ /bin/bash
11458 11478 11478 11458 pts/1 14700 S 500 1:58 | \_ jpilot
11458 14700 14700 11458 pts/1 14700 S+ 500 0:00 | \_ less ps.txt
5048 12001 5048 5048 ? -1 S 500 0:03 \_ konsole
12001 12002 12002 12002 pts/2 14717 Ss 500 0:00 | \_ /bin/bash
12002 14717 14717 12002 pts/2 14717 R+ 500 0:00 | \_ ps afjx
5048 14575 5048 5048 ? -1 S 500 0:00 \_ kio_file [kdeinit]
5048 14713 5048 5048 ? -1 S 500 0:00 \_ kio_pop3 [kdeinit]
1 5051 5048 5048 ? -1 S 500 0:00 dcopserver nosid
To get a sense of how processes are using memory, use the BSD-style v
option, illustrated in the following example:
$ ps v
PID TTY STAT TIME MAJFL TRS DRS RSS %MEM COMMAND
11458 pts/1 Ss 0:00 6 577 4274 1400 0.2 /bin/bash
11478 pts/1 S 1:59 22 483 16944 7028 1.3 jpilot
12002 pts/2 Ss 0:00 2 577 5374 1480 0.2 /bin/bash
14700 pts/1 S+ 0:00 3 96 3075 588 0.1 less ps.txt
14767 pts/2 R+ 0:00 0 60 2943 624 0.1 ps v
By way of explanation, the columns that address memory usage are:
■■ MAJFL — Shows the number of major faults, which occur when data
the CPU needs isn’t resident in L1 or L2 cache and must be retrieved
from main menu
■■ TRS — Shows the text resident size, the amount of memory used by a
program’s text segment, which contains initialized data
■■ DRS — Shows the disk resident size, the amount of physical RAM the
process has consumed that is currently swapped to disk
■■ RSS — Shows the resident set size, the amount of physical RAM
consumed that isn’t swapped to disk
■■ %MEM — Shows the percentage of total physical RAM the process
consumes
ps is feature-rich, embarrassingly so. It probably deserves a chapter of its
own, but we have other utilities to cover. Time spent with the manual page and
experimenting with ps, especially comparing the output of similar options, will
be rewarded with a knowledge of ps (and your system’s running processes) that
will earn you serious geek points at the next Linux installfest you attend.
Using top
Although ps is amply capable of showing you what processes are running at a
given point in time, top excels at showing how processes behave over time. Its
user interface enables you to sort the output in a variety of ways. In addition,
Performance Monitoring 817
40_599496 ch32.qxd 8/30/05 7:14 PM Page 817
you can use top to send signals to running processes and change their priori-
ties. If you have a set of top options you always use, you can set these in a con-
figuration file that top reads when it starts.
To get started, top’s basic syntax is:
top [-i] [-s] [-S] [-u user] [-d secs] [-n count] [-p pid]
See the top manual page for a complete list of all the command line options.
The -d secs option sets the delay in seconds between each top update (the
default is 3 seconds). top will update continuously in real time unless you
specify -n count, which limits top to count updates before it exits. If you
don’t want to see idle processes in the listing, specify the i option. The -s
option starts top in secure mode. This option is primarily used to prevent stray
keystrokes from harming a running system. It only makes sense to use it when
starting top as root because mortal users can affect only their own processes. If
you want to see the CPU time consumed by all processes and their children,
specify -S to see the time expressed as a cumulative sum. If you are interested
in only the processes owned by a specific user, use the -u user option. To mon-
itor a specific process or set of processes, use the -p pid option. To monitor
multiples processes, you can specify multiple pids in a comma-separated list.
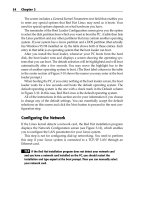
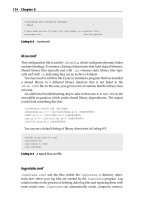
Figure 32-2 shows the default top display when no options are specified.
Figure 32-2 The default top display.
818 Chapter 32
40_599496 ch32.qxd 8/30/05 7:14 PM Page 818
top packs a lot of information into a small amount of space. The screen is
divided into two windows: the upper window, which shows summary infor-
mation and the lower window, which shows process-specific information. The
blank line at the bottom of the summary window is a status line and serves as
a user input area for the few interactive commands that require user input. The
summary window should look familiar because the first line shows uptime-
style information while the third, fourth, and fifth lines show memory con-
sumption à la the free command.
Top’s content window is where the action is. In its default configuration,
top shows the columns listed in Table 32-6.
By default, top sorts the process display in descending order of CPU (%CPU)
usage. To change the sort field, press O to open the Current Sort Field dialog
box and press the letter corresponding to the column by which you want the
display sorted, and then press Enter. For example, to sort by memory usage,
press O n Enter.
TIP To make running processes stand out, press B in the main top display to
cause running processes to appear in bold face or press b to highlight the
running processes.
Table 32-6 top’s Default Display Columns
COLUMN DESCRIPTION
PID The process ID
USER The user name
PR The process’ priority
NI The process’ nice value
VIRT The amount of virtual memory the process uses
RES The amount of physical RAM the process consumes
SHR The amount of shared memory the process has created
%CPU The percentage of CPU time consumed by the process
%MEM The percentage of total memory allocated to the process
TIME+ The total CPU time consumed by the process, not including CPU
time consumed by child processes
COMMAND The binary name that started the process
Performance Monitoring 819
40_599496 ch32.qxd 8/30/05 7:14 PM Page 819
There are a number of other interactive commands you can use to modify
top’s display while it is running. For newcomers, the most important key-
stroke is q, which exits top. Table 32-7 lists additional interactive keystrokes.
Table 32-7 top Interactive Keystrokes
KEYSTROKE DESCRIPTION
< Moves the sort column left one column
> Moves the sort column right one column
b Toggles bold display
c Toggles display of command name
d Sets the update interval
f Adds or removes columns
i Toggles display of idle tasks
k Kills a task as specified by its PID
l Toggles the load average summary
m Toggles memory information summary
n Sets the number of processes to display
o Changes column display order
O Selects the sort field
q Quits top
R Toggles normal or reverse sort
r Renices a task as specified by its PID
S Toggles display of cumulative CPU time
s Sets the update interval
t Toggles CPU statistics summary
u Shows process owned by a specific user
W Creates a .toprc file in the current user’s home directory
x Toggles highlighting the sort column
y Toggles highlighting the running tasks
z Toggles color display
820 Chapter 32
40_599496 ch32.qxd 8/30/05 7:14 PM Page 820
The W command creates $HOME/.toprc, which top reads in subsequent
sessions to restore your preferred settings. If you find top’s default display too
cluttered, use the i command to toggle idle tasks off, which hides them. Press
i again to restore idle processes to the display. Experiment with top’s display
settings until you find a display that suits your needs, then save your prefer-
ences using the W command.
To kill a task using top:
1. In the main window, type k.
2. Type PID of the task you want to kill and press Enter.
3. Type the numeric or symbolic name of the signal you want to use (15,
SIGTERM, is the default), and press Enter. Press Enter without typing a
signal to accept the default signal.
4. top kills the corresponding process.
Notice that you can send any signal using top, not just a signal that termi-
nates a process SIGTERM. Table 32-8 shows all of the signals that top under-
stands. You can use either the numeric value, such as 15, or the symbolic
name, SIGTERM. In addition, the symbolic name can be either the full name,
such as SIGHUP, or the name without the SIG prefix, such as HUP.
Table 32-8 Signals Recognized by top
VALUE NAME VALUE NAME VALUE NAME
1 SIGHUP 2 SIGINT 3 SIGQUIT
4 SIGILL 5 SIGTRAP 6 SIGABRT
7 SIGBUS 8 SIGFPE 9 SIGKILL
10 SIGUSR1 11 SIGSEGV 12 SIGUSR2
13 SIGPIPE 14 SIGALRM 15 SIGTERM
17 SIGCHLD 18 SIGCONT 19 SIGSTOP
20 SIGTSTP 21 SIGTTIN 22 SIGTTOU
23 SIGURG 24 SIGXCPU 25 SIGXFSZ
26 SIGVTALRM 27 SIGPROF 28 SIGWINCH
29 SIGIO 30 SIGPWR 31 SIGSYS
Performance Monitoring 821
40_599496 ch32.qxd 8/30/05 7:14 PM Page 821
Monitoring I/O Activity
Memory and CPU usage serve as important indicators of your system’s health
and its overall performance and efficiency, but they are not the only measures.
A common truism in performance-tuning literature and practice is that your
system is only as fast as its slowest component. In most systems, the slowest
component is the I/O subsystem. Memory, CPU, bus, and network speeds
long ago surpassed the capability of disk devices (with the exception of certain
solid state disks and “disklike” devices such as compact flash memory) to han-
dle the data throughput possible with contemporary speeds. Accordingly, you
need a good tool that helps you identify and isolate where I/O bottlenecks are
occurring. iostat, discussed in this section, and sar, discussed in the next
section, are just the tools to use. How you proceed after you’ve fingered the
performance culprit is a different issue, of course; diagnostics identify only the
problem.
NOTE In order to use the iostat command, the sysstat package must be
installed. vmstat, on the other hand, is installed by the procps package.
Confusing? You bet!
As its name suggests, iostat reports I/O statistics for disk devices and
disk partitions. It also reports CPU performance data, but this information is
not important to the present topic. iostat’s syntax is:
iostat [-d] [-k] [-t] [-x] [{dev|ALL}] [-p [{dev|ALL}]] [secs [cnt]]
Refer to the iostat manual page for complete syntax and usage details,
especially for CPU utilization options not covered here. The -d option invokes
iostat’s disk utilization mode; all the examples in this section use it because
doing so disables CPU utilization reports. iostat’s default output should
resemble the following:
$ iostat -d
Linux 2.6.10-1.770_FC3.root (beast.example.com) 05/05/2005
Device: tps Blk_read/s Blk_wrtn/s Blk_read Blk_wrtn
hda 1.30 11.46 9.79 3996171 3415664
hdb 0.46 2.99 4.06 1043976 1416023
hdd 0.00 0.00 0.00 680 0
The first report iostat prints lists summary data collected since the last
boot. To get current information, use the secs and/or cnt options. secs
specifies the delay between updates and cnt, if specified, specifies how many
822 Chapter 32
40_599496 ch32.qxd 8/30/05 7:14 PM Page 822
updates to show before iostat exists. If cnt is not specified, the updates are
continuous. The following example takes two samples five seconds apart:
$ iostat -d 5 2
Device: tps Blk_read/s Blk_wrtn/s Blk_read Blk_wrtn
hda 1.30 11.46 9.80 4001643 3423981
hdb 0.46 3.01 4.29 1052328 1499821
hdd 0.00 0.00 0.00 1208 0
Device: tps Blk_read/s Blk_wrtn/s Blk_read Blk_wrtn
hda 0.20 0.00 3.20 0 16
hdb 1.20 0.00 22.40 0 112
hdd 0.00 0.00 0.00 0 0
You’ll learn what iostat’s other options do in a moment. What exactly
does iostat’s output mean?
■■ Device — Indicates the disk device or partition.
■■ tps — Shows the number of transfers per second sent to the device. A
transfer in this context refers to any I/O request and has no specific size
because multiple read or write requests can be contained in a single
transfer.
■■ Blk_read/s — Shows the number of 512-byte blocks read per second
from the device.
■■ Blk_wrtn/s — Shows the number of 512-byte blocks written per sec-
ond to the device.
■■ Blk_read — Shows the total number of 512-byte blocks read from the
device.
■■ Blk_wrtn — Shows the total number of 512-byte blocks written to the
device.
Thus, since the system booted, the second iostat command shows the fol-
lowing for /dev/hda:
■■ The average number of transfers per second is 1.2.
■■ The average number of blocks read per second is 11.46, or approxi-
mately 5867 bytes per second.
■■ The average number of blocks written per second is 9.80, or approxi-
mately 5018 bytes per second.
■■ The total number of blocks read is 4,001,643, which totals 2,048,841,216
bytes or about 1.9 GB.
■■ The total number of blocks written is 3,423,981, which totals 1,753,078,272
bytes or about 1.6 GB.
Performance Monitoring 823
40_599496 ch32.qxd 8/30/05 7:14 PM Page 823
The block size iostat uses is shown in terms of disk sectors. Thus, when
you are analyzing a physical disk, blocks are 512 bytes, but when you are look-
ing at a disk partition, the measurement appears in kilobytes (1024 bytes). Both
values are independent of a file system’s block size, which might be 512 bytes,
1024 bytes, or some other value.
To see the values in kilobytes (KB) rather than bytes, use the -k option:
$ iostat -d -k
Linux 2.6.10-1.770_FC3.root (beast.example.com) 05/05/2005
Device: tps kB_read/s kB_wrtn/s kB_read kB_wrtn
hda 1.29 5.72 4.90 2008233 1720898
hdb 0.46 1.50 2.15 528420 755286
hdd 0.00 0.00 0.00 604 0
TIP In many cases, you can merge command line options to reduce typing.
For example, iostat -d -k and iostat -dk are equivalent.
While I/O statistics for an entire disk are useful, it might be more helpful to
be able see I/O statistics on a per-partition basis. To obtain this level of granu-
larity, use the -p dev option, where dev is the device in which you are inter-
ested. For example, to see the I/O statistics for all of the partitions on
/dev/hda, use the following command:
$ iostat -dk -p /dev/hda
Linux 2.6.10-1.770_FC3.root (beast.example.com) 05/05/2005
Device: tps kB_read/s kB_wrtn/s kB_read kB_wrtn
hda 1.29 5.71 4.90 2008777 1723297
hda3 1.36 5.61 4.35 1974399 1531225
hda2 0.16 0.09 0.55 33064 191752
hda1 0.00 0.00 0.00 1230 320
As you can see, of the three partitions on /dev/hda, hda1 (the /boot file
system) has hardly been used at all, as you would expect, and hda3 has been the
most heavily used, which also make sense because it contains the / file system.
But wait! There’s more! If you specify -x (which you can’t use with -p),
iostat shows extended statistics for each disk (but not for each partition):
$ iostat -dk -x
Linux 2.6.10-1.770_FC3.root (beast.example.com) 05/05/2005
Device: rrqm/s wrqm/s r/s w/s rsec/s wsec/s rkB/s wkB/s avgrq-sz
avgqu-sz await svctm %util
hda 0.03 0.21 0.71 0.58 11.40 9.79 5.70 4.90 16.42
824 Chapter 32
40_599496 ch32.qxd 8/30/05 7:14 PM Page 824
0.01 10.40 4.46 0.58
hdb 0.01 0.11 0.17 0.30 3.01 4.31 1.51 2.16 15.80
0.01 11.18 2.32 0.11
hdd 0.00 0.00 0.00 0.00 0.00 0.00 0.00 0.00 100.67
0.00 638.17 638.17 0.00
Even in standard 80-character wide terminal the display wraps because it is
too long. For each disk, the extended statistics include:
■■ rrqm/s — The average number of read requests merged and sent to
the disk per second
■■ wrqm/s — The average number of write requests merged and sent to
the disk per second
■■ r/s — The average number of read requests sent to the disk per second
■■ w/s — The average number of write requests sent to the disk per second
■■ rsec/s — The average number of sectors read from the disk per second
■■ wsec/s — The average number of sectors written to the disk per second
■■ rkB/s — The average number kilobytes read from the disk per second
■■ wkB/s — The average number of kilobytes written to the disk per second
■■ avgrq-sz — The average size in sectors of requests sent to the disk
■■ avgqu-sz — The average queue length of requests sent to the disk
■■ await — The average time in milliseconds that elapsed between issuing
an I/O request and the request completing
■■ svctm — The average time in milliseconds spent servicing a request
■■ %util — The percentage of CPU time during which I/O requests were
being sent to the disk
These statistics show you the most interesting and useful I/O statistics
because they show you how well your I/O subsystem is performing and iden-
tify I/O bottlenecks. For example, the more read and write requests that are
merged (see rrqm/s, wrqm/s, r/s, and w/s), the more efficient the I/O sub-
system is because read and write requests are being batched together and
filled all at once. On the other hand, if too many requests are being merged,
I/O throughput, the amount of data actually being read from or written to disk,
can decrease. Throughput is measured by sectors read and/or written per sec-
ond (rsec/s and wsec/s) and by the actual byte count of reads and writes
per second (rkB/s, and wkB/s).
To get a sense for the overall task load, look at the wait time (await) and
CPU utilization values (%util). If await is high, the system might be I/O
bound because too much time elapses between when an I/O request is issued
Performance Monitoring 825
40_599496 ch32.qxd 8/30/05 7:14 PM Page 825
and when that request completes. Similarly, if the utilization value is high, the
system as a whole is saturated because I/O operations represent a (dis)pro-
portionately high amount of the system’s activities, either performing actually
I/O or waiting for I/O to complete.
Using sar
All the tools discussed so far have been single-purpose utilities that spotlight
specific areas of the performance and monitoring spectrum: free, vmstat,
and slabtop for memory consumption; ps and top for CPU usage; and
iostat for disk utilization. Although many administrators prefer such single-
purpose tools, a certain utility and convenience exists in being able to access all
of a system’s performance metrics using one program. This section discusses
sar (pronounced like “car”), which stands for system activity report. sar is a
popular tool that provides a single interface for collecting, storing, and ana-
lyzing system monitoring and performance data.
sar and sadc are, like iostat, installed with the sysstat package. Unfor-
tunately, sysstat is not installed as part of some of the default Fedora Core
installation profiles, notably the Fedora Core workstation profile. If you want
to use sar, make sure the sysstat package is installed.
On Fedora Core and RHEL system, sar works in conjunction with the sadc
program that is started at boot time by the sysstat service. sadc, which stands
for system activity data collector, samples a wide variety of system data every
10 minutes and writes it in binary format to /var/log/sa/sadd, where dd is
a two-digit zero-padded value corresponding to the current day of the month.
sar reads the data files created by sadc and uses that data to create its reports.
The virtue of this approach is that you can review sar’s reports for a given day
on any system and at any time, provided you have access to the raw data files.
NOTE A quick ls in /var/log/sa shows files named sardd. These files are
daily reports created by the sa2 command, which is a shell command that
invokes sar using the -f option. See /usr/lib/sa/sa2 for more details.
Because sar can be used to monitor multiple subsystems, the text looks at
each subsystem separately. Before diving in to the subsystem-specific modes,
however, you’ll want to know some of the general command line options that
sar supports. Probably the most useful option is -f ifile, which lets you tell
sar the input file it should read. (ifile is one of the binary-formatted files
described in the previous paragraph.) This is the option to use if you want to
see statistics for a day other than the current one. If you want to take a fresh
826 Chapter 32
40_599496 ch32.qxd 8/30/05 7:14 PM Page 826
sample of data and save it to an output file, use the -o ofile option, replacing
ofile with the name of the file you want. Finally, to force sar to use current
data rather than read stored data, place an interval value (in seconds) and a
count value at the end of the command line. For example, the following com-
mand displays CPU usage every 10 seconds, exiting after the fifth update:
$ sar 10 5
Linux 2.6.10.779_FC3.root (beast.example.com) 05/08/2005
10:13:00 PM CPU %user %nice %system %iowait %idle
10:13:10 PM all 57.10 26.10 16.80 0.00 0.00
10:13:20 PM all 59.34 23.38 17.28 0.00 0.00
10:13:30 PM all 57.96 23.52 18.52 0.00 0.00
10:13:40 PM all 56.04 25.87 18.08 0.00 0.00
10:13:50 PM all 57.86 26.53 15.62 0.00 0.00
Average: all 57.66 25.08 17.26 0.00 0.00
To save this output in a text file, use the following command:
$ sar -o cpu.rpt 10 5
Monitoring Memory with sar
You can use sar to monitor physical and virtual memory consumption several
different ways. Invoke sar -B to see paging; run sar -r option to review RAM
usage; execute sar -W option to view swap activity. In this case, paging refers
to memory that the CPU has had to page in from disk. Here’s a sample report:
$ sar -B 5 5
Linux 2.6.10-1.770_FC3.root (beast.example.com) 05/08/2005
10:26:49 PM pgpgin/s pgpgout/s fault/s majflt/s
10:26:54 PM 170.40 1257.20 5136.00 0.00
10:26:59 PM 121.04 1921.84 4886.17 0.00
10:27:04 PM 111.20 1015.60 5352.00 0.00
10:27:09 PM 151.20 2305.60 4623.00 0.00
10:27:14 PM 129.60 7243.40 1854.80 0.00
Average: 136.69 2749.06 4370.19 0.00
The columns displayed include:
■■ pgpgin/s — The number of kilobytes paged in from disk per second
■■ pgpgout/s — The number of kilobytes paged out to disk per second
Performance Monitoring 827
40_599496 ch32.qxd 8/30/05 7:14 PM Page 827
■■ fault/s — The number of page faults, which occur when the CPU
reads data that is not in an active memory page
■■ majflt/s — The number of major page faults, which occur when the
CPU reads a memory page that must be loaded from disk
The -r option is a great replacement, if slightly harder to read, for the free
command because it shows you with less ambiguity how your system’s RAM
and swap space is being used. Its output might resemble the following:
$ sar -r 5 5
Linux 2.6.10-1.770_FC3.root (beast.example.com) 05/08/2005
10:27:32 PM kbmemfree kbmemused %memused kbbuffers kbcached kbswpfree
kbswpused %swpused kbswpcad
10:27:37 PM 5936 509864 98.85 0 241324 1051524
724 0.07 144
10:27:42 PM 13120 502680 97.46 0 243484 1051524
724 0.07 144
10:27:47 PM 9732 506068 98.11 0 241992 1051524
724 0.07 144
10:27:52 PM 5768 510032 98.88 0 232348 1051524
724 0.07 144
10:27:57 PM 25692 490108 95.02 0 234284 1051524
724 0.07 144
Average: 12050 503750 97.66 0 238686 1051524
724 0.07 144
■■ kbmemfree — The amount of free (unallocated) RAM, in kilobytes
■■ kbmemused — The amount of used RAM, in kilobytes
■■ %memused — The percentage of total RAM in use
■■ kbbuffers — The amount of physical RAM the kernel is using as
buffer space, in kilobytes
■■ kbcached — The amount of physical RAM the kernel is using to cache
data, in kilobytes
■■ kbswpfree — The amount of unused swap space, in kilobytes
■■ kbswpused — The amount of used swap space, in kilobytes
■■ %swpused — The percentage of total swap used in use
■■ kbswpcad — The amount of cache memory in use by memory pages
that are also still available from swap, in kilobytes
828 Chapter 32
40_599496 ch32.qxd 8/30/05 7:14 PM Page 828