Sumary of agricultural doctoral thesis studying on potassium nutrient balance for sugarcane in lam son sugarcane belt thanh hoa province
Bạn đang xem bản rút gọn của tài liệu. Xem và tải ngay bản đầy đủ của tài liệu tại đây (873.51 KB, 29 trang )
MINISTRY OF EDUCATION AND TRAINING – MINISTRY OF AGRICULTURE AND RURAL DEVELOPMENT
VIETNAM ACADEMY OF AGRICULTURAL SCIENCES
PHAM THI THANH HUONG
STUDYING ON POTASSIUM NUTRIENT BALANCE FOR SUGARCANE IN LAM SON
SUGARCANE BELT THANH HOA PROVINCE
Major: Soil Science
Code : 62.62.01.03
SUMARY OF AGRICULTURAL DOCTORA L THESIS
HA NOI, 2014
STUDIES RELATED TO THE RESEARCH
1. Pham Thi Thanh Huong, Đang The Giang (2009), “The sugarcane production at Lam Son
sugarcane belt Thanh Hoa province” Journal of soil sciences No.31 in 2009.
2. Pham Thi Thanh Huong, Tran Cong Hanh, Nguyen Van Bo, (2013), “Potassium supply
capacity of grey soil (Haplic Ferralic Acrisols) to sugarcane in Lam Son sugarcane area Thanh Hoa
Province", Journal of Agriculture and Rural Development, No. 20 in 2013.
3. Pham Thi Thanh Huong, Tran Cong Hanh, Nguyen Van Bo (2013), “Efficiencies of
potassium application to sugarcane on gray soil (Haplic Ferralic Acrisols) in Lam Son sugarcane
area Thanh Hoa Province", Journal of Agriculture and Rural Development, No. 21 in 2013.
Thesis completed at:
VIETNAM ACADEMY OF AGRICULTURAL SCIENCE
Advisor:
1. Associated Prof. Dr. Nguyen Van Bo
2. Dr. Tran Cong Hanh
Examinant 1:
Examinant 2:
Examinant 3:
The thesis was defended at the council of institute level:
Vietnam Academy of Agricultural science
At h date month
year
Thesis can be found at library:
National library of Vietnam
Library of Vietnam Academy of Agricultural science
1
INTRODUCTION
1. Rationale of the research
Sugarcane (Saccharum officinarum L.) originated from tropical region, has a high yield
potential, a wide adaptation range, and has been identified as a crop that has competitive advantages
over the drought condition of upland region
Among factors that contribute to increases in yield and quality of sugarcane, macro nutrients like
nitrogen (N), phosphorus (P), potassium (K) play an important role. K is an element that sugarcane
absorbs the most and has an active influence to most physiological and biochemical processes occur in
cells especially in the synthesis, transport and sugar accumulation processes. However, the level of
response to K fertilizer of sugarcane has large fluctuations depending on climate, soil, sugarcane
varieties, farming techniques and the interactive relationship between K with other nutrients.
Unlike N and P, sugarcane has a lavish spending phenomenon on K. On the other hand, K
deficiency symptoms are often not immediately evident in case of K loss by erosion, leaching or
fixation. The needs to supply K are often only apparent after a few no-fertilized crops or the K supply is
not ecnough to compensate the K loss by crop harvesting, as K reserves in the soil are reduced to the
"impoverishment" level. Thus, excess or deficiency of fertilizer or fertilizer K will result in a decrease
in the production efficiency of sugarcane.
Sugarcane area Lam Son (Thanh Hoa province) is planned to have a total area of sugarcane 54.
314 ha by 2020, located in 10 districts in the west midland and moutainous regions of the province.
Yearly sugarcane-planted area (in the period 2005-2013) on average is 15,000 ha, of which over 70%
are grown in gray ferralit soil in hilly regions. In tropical climate zones, mineralization, erosion, and
leaching occur drastically, together with a low organic matter content as well as low K-rich clay
minerals ratio and composition in the soils are the reasons for not only poor K soils but also low K
holding capcity. As a result, K fertilizer efficiency is also affected.
The research "Study of potassium balance for sugarcane in sugarcane area Lam Son in Thanh Hoa
province" was conducted to:
- evaluate the capacity of gray ferralit soils to sypply K supply for sugarcane;
- evaluate the relationship between the amount of K fertilizers applied and yields and quality of
sugarcane;
- investigate the amount of nutrient inputs and outputs in K balance in current sugarcane
productions
- assess amounts of K reserves in the soil and the causes for the K imbalance
We thereby proposed solutions for a sustainable management of K and to enhance production
efficiency and maintain reserve levels K of land for sustainable development of sugarcane production
on hilly lands.
2. Aims and requirements
2.1. Aims of the research
Setting an equation to determine the amount of K fertilizers apllied for sugarcane based on a
nutrient balance, creating background knowledges for a sustainable management of K for each specific
area, contributing to improve productivity, quality and efficiency of cane production in Lam Son hilly
regions of Thanh Hoa.
2.2. Requirements
- Evaluate the basic conditions of Lam Son sugarcane region in relationship with K balance for
sugarcane.
- Determine the capacity to provide K for sugarcane of gray soil ferralit and amount of K inputs and
outputs in K balance for sugarcane.
2
- Determine the relationship between the amount of K fertilizers appiled to yield and quality of
sugar cane, sugar yield and amount of K removed at harvesting.
- Determine a K balance at different levels of K fertilization and in current sugarcane production.
- Set up an equation determining the amount of K fertilizer for sugarcane through nutrient balance.
- Determine the efficiency of an empirical model for a sustainable management of K for
sugarcane based on the nutrient balance.
3. Scope of the research
Research on K nutrient balance for the sugarcane area Lam Son, Thanh Hoa was done at the small
scale (size fields) on typical gray ferralit (Hapli Ferralic Acrisols: ACfa - h) using the sugarcane variety
MY 55 - 14 and the cultivation techniques that are commonly used in the area.
4. The scientific and practical significance
The results of the research thesis contribute additional scientific data to serve nutriently balanced
assessment and determine the amount of K fertilizer for sugarcane through appropriate nutrient balance.
At the same time, the results will be basic bckgrounds to recommend a sustainable management strategy
of K for each specialist region in the production of sugarcane in Lamson hill in particular, the hill cane
area in Thanh Hoa province and in Vietnam.
5. New findings of the research
The research has identified the K supplying capacity of soil; amount and the relationship between
the nutrient inputs and outputs in K balance. An equation to determine the proper amount of K fertilizer
needed for sugarcane through nutrient balance was set up and a model for sustainable management of K
nutrition for sugarcane on the typical grey ferralit soil in hilly regions at Lam Son, Thanh Hoa was
established to achieve high yields, high cane quality and production efficiency, at the same time to
maintain soil K reserves.
Chapter 1
LITERATURE REVIEW
Nutrient balance in cropping systems is the determination of the amount of all nutrients input,
output per unit area of arable land in the specific production conditions, thereby assessing the situation
nutrient reserves in the soil and the degree of land degradation. The results from studies on nutrient
balance are an important basis to build and implement strategies for sustainable management of
nutrients, to meet the demands of increasing productivity, quality and efficiency of crop production,
while improve, maintain and enhance soil fertility.
In the world and in Vietnam in particular, there has been many researches on plant nutrient balance.
Depending on the spatial scopes and objectives of a research, nutrient balance study is done at different
scales: large scale ( global , regional or national ) with the main objective is to quantify the input and
output sources for the three macro nutrients N, P, K; medium scale (districts, ecological zones) in order to
create a basis for policy making, production and business planing in the region; small scale (fields, farms)
primarily serve the nutrient management of site-specific crops. Accordingly, the content, methodology,
accuracy, relicapacity of the quantitative measurements of nutrient inputs and outputs as well as the
feasibility of the study results on nutrient balance are different between the scales of studies (FAO, 1998;
Roy. R. N et al, 2003; Sheldrick et al, With. C et al, 2009; Buresh et al , 2010 ... ).
For sugarcane, K plays an important role in the physiological and biochemical activities occuring
in cells, especially sugar metabolism between hexoza and saccaroza. Kali participates in catalytic
activity of the invertaza enzyme in the sugar synthesis and in protein synthesis and transport leading to
increasing soluble solids (Brix), relatively sugar levels (Pol), the level of purity of pressed sugar cane
juice (AP), reducing the amount of reducing sugars (RS), increase of commercial sugar (CCS). In soil,
K exists in the form of structural K, non-exchangable K, exchangable K and K in solution. There are
equilibrium and kinetic reactions between these four forms of soil K with the two proccesses, fixation
3
and release. The K kinetic reactions in soil and K fertilizer use efficiency of sugarcane have a large
fluctuation, are site-specific and depend on climatic conditions, soils, sugarcane varieties, farming
techniques and interactive relationship with other nutrients (Van Dillewijn , 1952 ; Gururaj Hunsigi ,
2011 ; Alex Alexander Gerchell , 1973 ... ).
Chapter 2
MATERIALS, CONTENTS AND METHODOLOGY
2.1. The research materials
The research were conducted on typical gray ferralit soil; MY 55-14 was used as a main
sugarcane variety (accounting for over 60% of the sugarcane varieties throughout the region); NPK
fertilizer specialized for sugarcane in Lam Son (NPK - HC 6.4 - 3.2 to 6.6 - HC 9.5); commonly used
mineral fertilizers on the market (46% N urea, superphosphate - SSP 16% P2O5, 60% K2O potassium
chloride) and sugarcane residues after harvesting.
2.2. The research contents
To achieve the aims and requirements of the study, we focused on the following:
1) Basic conditions in Lam Son region of Thanh Hoa in relation to balance K for sugarcane.
2) The K supplying capacity of the soil; the amount of K provided by rain water; the amount of K
loss by erosion and leaching.
3) The relationship between the amount of K fertilizer to yield and quality of sugar cane, sugar
yield and qualitative K loss per harvested product.
4) K nutrient balance for sugarcane at different K fertilizer application levels and different
sugarcane production conditions.
5) Set up equations determining the optimum amount of K fertilizer for sugarcane based on
nutrient balance.
6) The efficiency of a sustainable K management model for sugarcane based on the nutrient balance.
2.3. Methodology
2.3.1. The research process
The research was done in the period from 1/2010 to 2/2013 in three steps: (1) investigating and
evaluating the basic situation in Lam Son region of Thanh Hoa; (2) experiments set up according to
research content; (3) empirical model building for a sustainable nutrient management of K for
sugarcane on the basic results of the nutrient balance study.
2.3.2. Method of secondary data collection
Investigate, collect resources, statistical data, maps, technical processes, research findings related
to climatic conditions, land of Lamson area.
2.3.3. Method of data collection
Investigation and collection of information related to the production, sugarcane cultivation techniques
in the region through the household survey using pre-printed questionnaires. Number of investigated
households were 200 households in 4 major sugarcane growing districts (Tho Xuan, Ngoc Lac, Lang
Chanh, Thuong Xuan), 50 households per district. Sumarizing and analyzing the obtained data by the
descriptive statistic method by group of criteria.
2.3.4. Experimental layout method in jars
The experiment was conducted in jars following a batch method (no K fertilizer). The jars were put
naturally outdoors to investigate the K supplying capacity of the typical gray ferralit (Hapli Ferralic
Acrisols) in irrigated condition and with different N, P fertilizers. The experiment consisted of 4
treatments and was set up following a RCB layout style with three replicates: (1) No irrigation - no
fertilizers N, P; (2) No irrigation - fertilizer N, P; (3) With irrigation - no fertilizer N, P; (4) With
irrigation - fertilizers N, P.
4
The soils used in this experiment was collected from a ratoon farm at depth from 0-40cm. Each jar
was filled with 30 kg soil, three cuttings per jar with 1 bud per cutting. Fertilizers N, P were applied at rates
of 200 N + 100 P2O5 (kg/ha) (3.32 g urea / jar; 4.46 g superphosphate / jar) for fertilized treatments
(treatments 2, 4). Regular checking and irigation were done (using distilled water to avoid K contamination)
to maintain soil moisture around 70-80 % of field capacity in the irrigated treatments ( 1, 3).
to the growth indicators, elements biomass and biomass of all parts of sugarcane (above and
below ground) when the plants stop growing.
Determination of dry matter content, content of K2O, K2O accumulated in parts of sugarcane.
Then the amount of K2O the soil is capable of supplying was calculated.
Time and location of study: planting date 10/2/2010, harvest date 15/9/2010. The experiment was
located at Hong Duc University.
2.3.5. The method of field trial layout
A field experiment was established to study the effect of the amount of K fertilizer on growth,
yield and quality of sugar cane, sugar yield, the amount of K loss by harvested products and the
relationship among them.
The experiment included 6 treatments, corresponding to 6 rates of K fertilizer levels (0, 50, 100,
150, 200, 250 and 300 kg K2O/ha) on the basic fertilization 200 N + 100 P2O5. Area of the experiment
was 90 m2 (with 5 sugarcane rows, 15 m long each, 1.20 m spacing), RCB -style layout, 3 replicates.
Cultivation techniques: using cuttings with 2 buds (8 -month-old cane). The amount of cuttings
planted were 32,000 cuttings / ha (4 cuttings/m long). Basal fertilizing (when planting or when treating
the canes for the next seasons) 100 % P + 30 % N+ 30 % K. Apply additional fertilizer at tillering 30
%N + 30 % K. Apply additional fertilizer at cane elongation 40 % N + 40 % K (the amount of fertilizer
followed to each treatment). The cultivation techniques were done similarly using the currently used
techniques in the region.
Keeping records on indicators of growth, yield and quality of sugar cane, sugar yield, cane foliage
mass, dry matter content, K2O content in cane stalks and leaves at harvesting.
Determining the technically maximum amount of K, optimum economics for cane yield, sugar yield;
reciprocal internal efficiency of K (RIEK), harvest index of K (HIK); K –recovery efficiency of K (REK).
The experiment was repeated in 1 sugarcane cycle (1 planting cane, 2 ratoons): 11/1/2010
planting date, harvest date 01/29/2011 (planting cane); 02/10/2012 (ratoon 1); 02/25/2013 (ratoon 2). It
was located in Tho Xuan – Sao Vang, Lam Tho commune, Tho Xuan District.
2.3.6. Method of determining the amount of K due to rainwater
Keeping records on monthly precipitation over the year by Pluviometer in the Hydrometeorology
station - Bai Thuong Thuong Xuan district, Thanh Hoa province. Rainwater samples were analyzed at
outdoor vessels in field trial areas. Water samples (sample mixture of rain in the month) were taken on
the last day of the month. The amount of K provided by rainwater (kg K2O /ha/year) was determined by
rainfall and K2O content in the rainwater in months.
Study period: 3 years (2010, 2011, 2012).
2.3.7. Method of determining the amount of K loss by erosion
The plots to measure erosion were followed the same layout to field trial plots, corresponding to
the amount of K fertilizer (0-300 kg K2O /ha). Area of the erosion measure plot was 90 m2 (6 x 15 m). 5
rows of sugarcane were planted, the distance between rows was 1.2 m. Containers to collect washed
soil were placed at the end of the plot (size: 1.5 m length x 1.0 m width x 1.0 m height). Nylon cloths
were put at the bottom of the containers. After raining, the amount of water, soil suspension and soil
sediment were sampled and analyzed to determine K2O content.
The amount of K loss by erosion (kg K2O /ha/year) is the total amount of K2O loss due to runoff
water, washed out soil suspension and sediments in all months of the year.
5
Time and location of study: 3 years (2010, 2011, 2012) at Raw Materials Station Tho Xuan – Sao
Vang, Lam Tho commune, Tho Xuan District.
2.3.8. Method of determining the amount of K loss by leaching
Several Lizimet to measure leaching was set according to the field trial plots, corresponding to the
amount of K fertilizer (0-300 kg K2O/ha). Leached water were collected using funnels with size 40 x 40
cm, placed at a depth 40cm (from the surface, within 80% of rhizospheres). After raining, leached water
was taken and measured for vollume, leached soilspension soil. Leached soils were sampled and
analyzed for K content.
The amount of K loss by leaching (kg K2O/ha/year) is the total amount of K2O loss due to runoff
water, leached suspension of all the months of the year.
Time and location of study: 3 years (2010, 2011, 2012), at Tho Xuan raw material station – Sao
Van, Lam Tho commune, Tho Xuan District.
2.3.9. Methods of empirical model building for a sustainable nutrient management of K for
sugarcane on the basic results of the nutrient balance
The results of studies on nutrient balance were used to construct an empirical model for
sustainable K management for sugarcane hilly areas of Lamson with 2 treatments:
Control treatment (5 ha): fertilizer application according to the currently common technique in the
area: 2 tons / ha NPK Lamson. No cane foliage return.
Investigated treament (5 ha): fertilizer application based on the research results of nutrient
balance: 2 tons / ha NPK Lamson; 100 % cane foliage incorporated in soils while adding N, P mineral
fertilizers at dose of 200 N, 100 P2O5. K fertilizer was determined depending on target yields, the inputs
and outputs of K balance and requirements of K reserve levels in soils.
The model was carried out on Hapli Ferralic Acrisols, previous crop was ratoon cane, and then
was prepared for a new planting. Other farming techniques are implemented the same for all treaments
following to the techniques that were commonly used in the area.
Record on growth indicators, yield and quality of sugar cane, sugar yield, and sugarcane
production efficiency, soil properties before and after the construction of the model.
Time and location: 3/12/2011 planing date, harvesting date 12/28/2012. At Tho Xuan raw
material station - Sao Vang, Lam Tho commune, Tho Xuan District.
2.3.10. Methods of recording and identifying research targets for sugarcane
Record on growth indicators, components of yield and yield of sugarcane by means of weighing,
measuring, and counting directly on the field.
Keep checking on sugarcane pests (borers, aphids and white wooly aphids) according to the
National Technical Regulation on methods of plant pest detection (QCVN 0138/BNN- PTNT - 2010).
Determine the amount of K fertilizers that is technically maximum, economically optimum based
on the intereacitve equation between cane yields, sugar yield with the amount of K fertilizer proposed
by Lecompt Michel (1965).
Reciprocal internal efficiency of K (Riek %) was determined by the ratio between the amount of
K2O in cane stalks and leaves at harvesting compared to sugarcane yield.
K harvest index (HIK) was determined through the ratio between the amount of K2O in cane stalks
in relation with the total amount K2O foliage and stalks.
K – recovery efficiency of mineral fertilizer K (REK %) was determined by the ratio between the amount
of K2O in cane stalks and leaves in relation to the amount of fertilizer K2O provided by mineral fertilizers.
Marinal benefit cost ratio (MBCR) was determined by the ratio between the value of the products
increased as compared to the cost of production increased from applying advanced techniques
6
2.3.11. Methods for soil, wáter, fertilizer, and crop analysis
Analysis of soil, water, fertilizers, and plant following to Vietnam standards was done at the
laboratory at Hong Duc University: the soil texture according toVietnam standards 8567 : 2010; pH
(KCl) TCVN 5979;2007; total organic matter TCVN 7376-2004; total N TCVN 7373: 2004; total P2O5
TCVN 7374: 2004; available P2O5 TCVN 5256: 2009; total K2O TCVN 7375: 2004; exchangable K2O
TCVN 8569: 2010; CEC TCVN 6646: 2000 . Sewage sludge from sugar production: total N: TCVN
8557: 2010; effective P2O5 8563: 2010; effective K2O TCVN 8560: 2010; the amount of K in water
QCVN 39: 2011; K content in cane stalks and foliage TCN - 454: 2001.
Analysis of cane juice quality criterias: soluble solids (Brix); apparen sucrose content (Pol); purity
of pressed sugar cane juice (AP); reducing sugar (RS); commercial cane sugar (CCS) according to the
methods currently applied in cane quality assurance department, Joint-Stock Company Sugar Lam Son.
2.3.12. Methods of data processing
Equations and correlation graphs using EXCEL - 2007.
Data analysis by IRIRSTAT 5.0 program.
Chapter 3
RESEARCH RESULTS
3.1. Basic conditions of LamSon region in relation to K balance for sugarcane
3.1.1. Climate
Sugarcane area Lam Son - Thanh Hoa located in the west of Thanh Hoa Province, has a tropical
climate influenced by the dry and hot southwest monsoon, and dry and cold northeast monsoon. The
total area of land under cane cultivation is planned to achieve 54.314 ha by 2020, distributed over 10
geographical districts, three sub-regions of terrain: plains sub-regions (Yen Dinh and Thieu Hoa, Trieu
Son), mid-land sub-regions (Cam Thuy district, Tho Xuan, Nhu Thanh, Nhu Xuan, Ngoc Lac),
mountainous sub-regions (Thuong Xuan district, Lang Chanh). Changing in climate over the months of
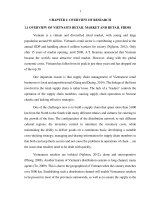
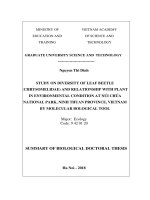
the year (average data for 20 years, from 1993 to 2012) are shown in Figure 3.1
Figure 3.1. Evolution of climatic factors in Lam Son - Thanh Hoa (1993 – 2012)
Figure 3.1 shows that climate in Lamson region has many advantages, which allow effectively
exploiting the potential yield and high sugar content of sugarcane: total temperature (annual average ) is
8.9600, temperature 23.80C, rainfall 1,659 mm / year, 84.8% air humidity, evaporation 897mm, 1,542
hours of sunlight (average 4.2 hours / day). In particular, from May to October it has high temperature,
air humidity, light and high rainfall (May to October) coincides with the period of strong growth of
sugarcane plants, zoos and create economic productivity. From November to April next year,
temperature, air humidity, light and rainfall are low; temperature difference between day and night is
highly, which is favorable conditions for the accumulation of sugar cane as well as the process of
harvesting, transporting and processing of sugar .
The main drawbacks of this climate condition are low temperature, air humidity and rainfall
during the planting season, and ratoon cane treatment (on December, January, Febuary), which cause
bad affects on germination and regeneration of sugarcane. High precitaion on August, September,
October causes erosion and nutrient leaching.
7
3.1.2. Sugarcane planted areas
Table 3.1. Area of planted cane in Lam Son region Thanh Hoa (Planning to 2020)
No
% compare % compare
with whole
with soil
reigion
group
Whole region
54.314
100
1
Gray ferralit
AC
48.064
88,5
100
1.1
Typical gray ferralit
Acfa - h
40.225
74,1
83,7
1.2
7.839
14,4
16,3
Gray ferralit with stone and farm
Acfe
2
Alluvia
FL
6.250
11,5
100
2.1
Neutral less acidic alluvia
P–h
3.408
6,3
54,5
2.2
2.842
5,2
45,5
Acidic alluvia
Pgc
(Source: Lam Son sugarcane Joint-Stock Company, 2008)
The results in Table 3.1 show that the total sugarcane area of region is 54.314 ha, including
ferralit (AC) accounted for 88.5% (48.064 ha), the remaining is alluvial soil (FL) 6,250 ha. In ferralit
gray soil, area of typical gray ferralit (Acfa - h) is 40.225 ha, accounting for 83.7% and 74.1% of the
total gray ferralit soil areas and of the whole region, respectively.
3.1.3. Sugarcane varieties
Table 3.2. The structure of the sugarcane varieties in Lam Son region of Thanh Hoa (season 2007-2008)
No
Soil group
Group of sugarcane varieties
Symbol
Area
(ha)
Area
Yeild
% compare % compare
(ha)
(tấn/ha)
with total
with group
Whole region
15.571
61,15
1
Early maturity group
2.180
62,46
14,0
Main variety: QĐ 93 - 159
2.107
62,80
13,5
96,7
Other varieties
73
49,80
0,5
3,3
2
Early maturity group – average
2.893
66,61
18,6
Main varieties: QĐ 94 -119; ROC 10; ROC 23 1.684
67,89
10,8
58,2
Other varieties
1.209
64,82
7,8
41,7
3
Average maturity group – late
10.498
59,38
67,4
Main variety: MY 55 – 14
9.589
58,30
61,6
91,3
Other varieties
909
70,77
5,8
8,7
(Source: Lam Son sugarcane Joint-Stock Company, 2009)
Table 3.2 shows that the varieties structure of whole region includes early maturity varieties
acounting for 14%, yield of 62.46 t / ha on average, the main varieties is QD 93-159. Mid-early
maturity group accounts for 18.6%, with an average yield of 66.61 t / ha, the main variety is QD 94119, ROC 10 and ROC 23. Group of Mid-late maturity varieties accounts for 67.4%, with an average
yield of 59.38 t / ha, the main variety is MY 55-14. Planted area of MY 55-14 is 9,589 ha, yield 58.3
tons / ha, accounts for 91.3% and 61.6% of the Mid-late varieties and of the whole region, respectively,
and is identified as a key variety in the current structure of the Lamson region.
3.1.4. Sugarcane areas and yield
Results from a survey of cane areas and cane yield of 200 farmers of four major sugarcane
growing districts in Lam Son area, categorized by land groups: hilly land, farm land (land has been
shifted from rice cultivation to sugarcane) and alluvial land (alluvial soil beyond dikes)presented in
Table 3.3 shows that: In the Lam Son region, sugarcane is grown mostly on hilly land, accounting for
77.1% of the total area, the average yield of 58.8 tons / ha. In particular, newly planted cane yield of
8
61.9 tonnes / ha, higher than the ratoon canes of 10%. Ratio between the area of newly planted
sugarcane and ratoon cane is 44.8% and 55.2%. Compared to sugarcane grown on farmland and alluvia
land, planted sugarcane yields on hilly land is lower than 22.2% (16.8 tonnes / ha) and 26.1 (20.8 tons /
ha), respectively.
Table 3.3. Sugarcane area and yield via household survey in Lam Son region of Thanh Hoa
No
Land for
Survey area (ha)
Yield (ton/ha)
% compare
planting
Newly Ratoon
Total
Newly Ratoon
Average with survey
sugarcane
area
cane
cane
cane
cane
Total
244,5
326,9
571,4
61,5
60,8
62,7
100
1 Hilly land
197,3
243,1
440,4
61,9
56,2
58,8
77,1
2 Farm land
40,4
59,4
99,8
78,0
73,2
75,1
17,5
3 Alluvial land
6,8
24,4
31,2
82,5
76,7
78,0
2,75
3.1.5. Fertilizers for sugarcane
Results of the farmer survey about fertilizer using situation for sugarcane in the Lam Son area are
shown in Table 3.4 and Table 3.5.
Table 3.4. Situation of fertilizer using for sugarcane in the Lam Son region of Thanh Hoa
No
Type of fertilizers
Survey
area (ha)
Area divided to groups (ha)
Hilly land
Farm land
Alluvia land
1
Organic fertilizers
43,5
16,7
19,2
7,6
2
Mineral fertilizers
571,4
440,4
99,8
31,2
Using only NPK Lam Son
Using only N, P, K
Using NPK Lam Son, addition of N
fertilizer
Using other mixed NPK
542,3
3,7
17,4
424,6
11,0
89,5
2,6
5,4
28,2
1,1
1,0
8,0
4,8
2,3
0,9
2.1
2.2
2.3
2.4
Table 3.5. The utilization of NPK Lam Son for sugarcane in Lam Son region of Thanh Hoa
No
Land for planting
sugarcane
Survey area (ha)
Newly cane
Area classification according to
fertilizing level (ha)
Level 1
Level 2
Level 3
Ratoon
Total
cane
Total
243,9
302,1
546,0
91,3
397,2
59,0
1 Hilly land
197,3
219,1
416,4
63,0
307,6
45,8
2 Farm land
39,8
58,6
98,4
21,5
67,4
11,0
3 Alluvia land
6,8
24,4
31,2
6,8
22,2
2,2
Note:level 1: 1500 - < 2000; level 2: 2000 -< 2500; level 3: 2500 - < 3000.
- For organic fertilizers: there are 43.5 ha out of 571.4 ha of the survey (7.6%) are organic
fertilizers. Proportion of cane planted area on hills is used only organic fertilizers 3.8%; farmland
19.2%, 24.4% alluvia land compared to the area covered by each group.
- For Mineral: 571.4 ha of investigation has 542.3 (94.9%) of cane area that is entirely used NPK
Lamson (NPK - HC 6.4 - 3.2 to 6,6 HC 9.5) by the Fertilizer Corporation Lamson production and invest
for farmers through sugarcane purchase contracts sugarcane; 3.1% NPK fertilizers by the Lam Son and
additional inorganic N. In addition, a small proportion of the area ( 2 % ) with inorganic fertilizer or
other NPK fertilizers on the market . The amount of fertilizer NPK Lamson average 2000-2200 kg / ha.
Organic materials for NPK fertilizer production Lam Son is sugar refinery sludge.
9
3.1.6. Irrigation
Forms for sugarcane irigation is applying in Lam Son area include: (1) craft irigation (mainly for
sugarcane growing area in the garden, garden hills, use of the pressure pump capacity small irrigational
system with pipes directly into the trench cane; (2) furrow irrigation (applied to the area of land planted
in sugar cane fields, flat terrain, there are proactive system of canals for irrigation, drainage) and (3 )
drip - drip irrigation (under construction project model test irrigate sugarcane hills of Israeli technology,
size of 1,000 ha, mainly in Tho Xuan district).
Table 3.6. The situation of sugarcan irrigation in the Lam Son region of Thanh Hoa
No
Land of
Area survey (ha)
Irrigated area (ha)
sugarcane
Newly
Root cane
Total
Level 1
Level 2
Level 3
planting
cane
Total
244,5
326,9
571,4
3,2
20,0
9,0
1
Hilly land
197,3
243,1
440,4
1,3
11,0
2
Farm land
40,4
59,4
99,8
20,0
5,1
3
Alluvia land
6,8
24,4
31,2
1,3
Note: Level 1: irrigation 1 time; Level 2: irrigation 2 - 3 times; Level 3: usually irrigation
The survey results for situation of sugarcane irrigation presented in Table 3.6 shows that except
for area in which constructs a trial model for sugarcane drip irrigation; areas were used both two forms
including scraft and furrow irrigation, which are limited. In total 571.4 ha survey, only 32.2 ha (5.6%)
of sugarcane is irrigated from one or more times. In group of hilly land, only 6.2% of irrigated area
under irrigation shaped craft, irigation one times when planting. Thus, the production of sugarcane in
the hills Lamson primarily based on rainfed.
3.1.7. Using the top and foliage of sugarcane after harvesting
The household survey on the using of sugarcane foliage showed management of sugarcane foliage
post-harvest have not been given due attention by growers. In the period, they burned or buried and
cornered, returned to the land. However, now part of poor management and part of high labor cost of
sugarcane, growers applied forms a part of the rent paid workers harvest sugar cane by sugar cane
leaves them taken tops carry on. Thus, almost the entire sugarcane tops were removed from the field
immediately after the end of sugar cane harvesting.
3.2. The capacity of K Supply of soil; amount of K by rainwater supply; amount of K loss by
erosion and leaching
3.2.1. The capacity of K supply of soil
3.2.1.1. Experimental soil properties
The results of analysis of soil agrochemical targets of typical gray ferralit in Lam Son hilly region,
used in experiment about the K supply capacity of soil for cane showed that soils with light mechanical
composition 1,05 g/cm3; acidic soil (pH 4.64); poor organic matter content (1.22% OM); N, P, K
compound are poor level (0.11% N, P2O5 0,05% K2O: 0.08%); phosphorus, exchange potassium are
poor (P2O5 4,15 mg/100 g soil, K2O 5,75 mg/100 g soil exchange); low cation exchange capacity (CEC
11,31 mg/100 g soil).
3.2.1.2. The situation of sugarcane growth
Results of monitoring the sugarcane growing criteria presented in Table 3.7 show that:
In irrigated condition, the growing indicators of sugarcane increased compared with no irrigation
in both cases, no fertilizing and N, P fertilizing. As N, P fertilizing, growing indicators increased
compared with no N, P fertilizin in both no irigation and irigation cases, but the increasing level was
lower than in irrigated conditions.
10
Table 3.7. Effect of irigation and N, P fertilizing on the sugarcane growth
N
o
Formulas
Germinat Tillering
Plant
Stem
Plant
Number
ive time
ratio
height
diameter
volume
of plant
(date)
(time)
(cm)
(mm)
(g/plant) (plant/jar)
1 No irigation – no N, P
15
1,33
145,1
16,4
103,0
4,0
2 No irigation- N, P fertilizing
15
1,47
159,8
17,8
115,5
4,3
3 Irigation-no N, P fertilizing
10
1,63
186,5
20,7
116,7
4,5
4 Irigation - N, P fertilizing
10
1,90
225,5
24,6
153,3
5,4
LSD0,05
0,06
10,2
1,4
7,14
0,3
Irigation combined with N, P fertilizing, growing indicators of sugarcane increased compared
with the cases that are irigation - no N, P fertilizing and no irigation – N, P fertilizing.
Compared N, P fertilizing - no irigation formula with irigation - no N, P fertilizing, tillering ratio
of sugarcane in the formula of N, P fertilizing increased 29.3 % and 16.6 %; plant height increased 41.1
% and 20.9 %; sten diameter increased 38.2 % and 18.8 %; plant volume increased 32.7 % and 31.4 %;
plant density increased by 25.6 % and 20 % , respectively .
3.2.1.3. Amount of K2O accumulated in the plant
Table.3.8. Effect of irigation and N, P fertilizing on amount of K accumulated in the plant
No
Formulas
Fresh
volume
(g/jar)
568,0
Dry matter
content
(%)
27,4
Dry
volume
(g/jar)
153,5
Content
K2O
(%)
0,19
Amount of K2O
accumulated
(g/jar)
0,34
1
No irigation – no N, P fertilizing
2
No irigation - N, P fertilizing
684,3
28,7
197,5
0,22
0,51
3
Irigation - no N, P fertilizing
766,3
22,9
171,1
0,22
0,45
4
Irigation - N, P fertilizing
1059,9
25,3
264,4
0,280
0,870
The results in Table 3.8 show that compared with no irigation, irigation formulas have reduced
dry matter content in all parts of the tree in both cases, no fertilizing and N, P fertilizing. However, due
to living mass , dry mass and K2O content increased high result in that mass of K2O accumulated in
tree increased high: 32.4 % and 70.6 % compared with no irigation, in the cases both fertilizing and N,
P fertilizing respectively.
N, P fertilizing increased living mass, dry matter content and K2O content result in that K2O
cumulative volume in plant increased 50 % and 93.3 % compared to no N, P fertilizing in the cases of
irigation and no irigation respectively .
Irigation combined with fertilizer N , P , K2O cumulative volume reached the highest value (0.87
g / jar), up 93.3 % compared with the case of only irigation, no N, P fertilizing and 70,6 % compared
with the case of only N, P fertilizing, no irigation.
3.2.1.4. Effect of irigation and N, P fertilizing on K supply capacity of land for plant
K supply capacity of land for plant in conditions of irigation and N, P fertilizing differently is
determined by the total K2O cumulative volume in all of the sugarcane after deducting the amount of
K2O in cutting when planting. K2O volume in land able to provide for plant (kg K2O /ha) are converted
from the land mass in the jar and the land mass in the range of 90% active sugarcane roots (depth of 040 cm, natural weight of land 1.05 g/cm3). The research results are presented in Table 3.9; 3.10.
Table 3.9. K2O volume in the cuttings when planting
Number of cuttings
(cutting)
3
Cutting volume
(g/cutting)
11,5
Dry content
(%)
31,2
K2O content
(%)
0,47
K2O volume
(g/jar)
0,05
11
Table 3.10. K2O supply capacity of land for sugarcane
No
Formulas
K2O
accumulation
in plant (g/jar)
0,34
0,51
0,45
0,87
0,03
K2O plants take
from the soil
(g/jar)
0,29
0,46
0,40
0,82
0,05
K2O soil ables
to supply (kg
K2O/ha)
40,6
64,4
56,0
114,8
6,9
No irigation – no N, P fertilizing
No irigation - N, P fertilizing
Irigation - no N, P fertilizing
Irigation - N, P fertilizing
LSD0,05
The results in Table 3.9; 3.10 showed:
Sugarcane in irrigated conditions, the K2O volume that soil ables to provide for plant increased 37.9 %
and 78.3 % compared with no irigation condition in cases of no fertilizing and N, P fertilizing respectively.
Sugarcane in conditions of N, P fertilizing, K2O volume that soil ables to provide for plant increased
58.6 % and 105 % compared with N, P fertilizing in cases of irigation and no irigation respectively.
Sugarcane in irrigated conditions combine with N, P fertilizing, the soil ables to provide the
highest K2O volume for sugarcane: reach 0.82 g / jar (kg / ha), an increase of 105 % (0.42 g / jar)
higher than in the case of irigation - no N, P fertilizing, and 78.3 % ( 0.36 g / jar ) higher than in the case
of N, P fertilizing - no irigation.
From the above results showed, irigation and N, P fertilizing have a significant impact on the K supply
capacity of typical gray ferralit soil. Irigation combined with N, P fertilizing, soil has able to provide the
highest level of K2O volume (114.8 kg K2O /ha). In the case of only irigation - no N, P fertilizing or N, P
fertilizing - no irigation, K2O volume, that is provided by soil, is reduced to 56 kg K2O /ha (down 48.8 %)
and 64, 4 kg K2O /ha (down 56.1 % ) compared with the case of irigation combination fertilizer N, P.
3.2.2. K due to rainwater
From the hypothesis that, in the area of sugar mills, K content in rainwater is higher than other
areas due to the manufacturing process, the sugar mills use bagasse as a feedstock for boiler and emit
into the atmosphere a considerable amount of furnace ash dust. Besides, sugarcane leaf tip burn
practices after each harvest also contributes to increased levels of ash in the air. When it rains, dust
rainwater enters the soil, thereby returning to land a certain amount of K.
1
2
3
4
Rainfall (mm)
Month
Rainfall
K2O volume (kg/ha)
K2O content (mg/lít )
Month
Month
K2O Content
K2O volume
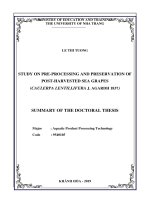
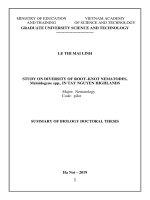
Hình 3.2: K due to rainwater supply for soil in the Lam Son region of Thanh Hoa (2010 - 2013)
K2O amount due to rainwater supply for soil (kg K2O /ha/year) are determined through rainfall and
K2O concentrations in rainwater over the months of the year. Results monitoring of precipitation, and the
amount of K2O, K2O content in rainwater over the month in 3 years (2010-2012) in the Lam Son presented
in Figure 2 show that the climatic conditions of the Lam Son, the June, July, August, September, October,
November have the highest total rainfall (average 1684.3 mm, accounting for 87.5 % of the total rainfall for
the year). K content in rainfall is low (average 0.38 mg/l). The amount of K2O give land 5.81 kg K2O
/ha/year, accounting for 70.8 % of K2O by rainwater supply in years. In contrast, December , January,
Febuary, March, April, May K content in rainfall is high (1.18 mg / l), 3.1 times higher than the average of
12
June , July, August, September, October, November. However, due to low rainfall (only 12.47 % of the total
rainfall in the year) K content provides for soil only 2.4 kg K2O /ha/year.
3.2.3. K loss by erosion
Table 3.11. K loss by erosion in Lam Son region of Thanh Hoa (2010 - 2012)
No
1
2
3
4
Monitoring criteria
K loss due to erosion
Erosive water (m3/ha)
K2O content (mg/l)
K2O loss due to erosive water (kg/ha)
K loss by suspension soil
Erosive suspension soil (kg/ha)
K2O content (mg/l)
K2O loss by soil suspension (kg/ha)
K loss by sediment
Soil sediment erosion (m3/ha)
K2O content (mg/l)
K2O loss by soil sediment (kg/ha)
Total K2O loss by erosion (kg/ha)
Basis
Basis + Basis +
100
150
K2O
K2O
Basis +
200
K2O
Basis +
250
K2O
Basis +
300
K2O
713,45
2,91
2,08
535,09
3,32
1,78
442,34
3,46
1,53
385,26
3,40
1,31
299,65
3,49
1,05
278,24
3,48
0,97
1.555
1,38
21,46
1.211
1,48
17,92
1050
1,51
15,86
926
1,52
14,08
846
1,55
13,11
1.123
1,30
14,60
773,16
0,58
4,48
28,02
602,43
0,61
3,67
23,37
543,94
0,61
3,32
20,71
472,45
0,62
2,93
18,32
408,01
0,63
2,57
16,73
520,43
0,50
2,60
18,17
Research results K2O amount loss due to erosion (3-year average 2010-2012) presented in Table
3.11 shows that: K fertilizing had a positive influence to limit the amount of K loss by erosion. Water,
soil suspension and erosive sediment soil tends to decrease when increasing the amount of K fertilizing,
in contrast, K2O content in them tends to increase. However, due to the decline in water quality,
suspension soil and erosive sediment soil is faster than the rate of K2O content in them, leading to loss
of K according to the amount of ingredients as well as the total amount of K loss by erosion reduces
gradually. However, the difference is only evident when comparing the formula of K fertilizing with
formula of no K fertiling, even among the formulas of K fertilizing, the difference only shows unclear.
The total amount of K loss due to erosion of volumes average from 100 to 300 kg K2O /ha/year is
19.5 kg K2O /ha, in which 77.7% (15.1 kg K2O /ha) loss by erosive suspension soil. The amount of K
loss by erosive sediment accounted for only 15.5% (3.0 kg K2O /ha). The amount of K loss under
erosive water accounted for only a small fraction (6.8%, 1.3 kg K2O /ha respectively). In the case of no
K fertilizing, the amount of K loss by erosion is 28.0 kg higher 8.56 kg K2O /ha (44.0%), compared
with average of fertilizing formulas from 100 to 300 kg K2O /ha. The amount of K loss due to erosion
of the average three fertilizer formulas 200, 250 and 300 kg K2O /ha is 17.7 kg decrease 5.6 kg K2O /ha
(down 23.4%), compared with the amount of fertilizer 100 kg K2O /ha.
From the above results, the amount of K loss by erosion suggest to use in evaluating nutrient
balance and determine the amount of K fertilizer suit for sugarcane cultivation on typical gray ferralit
soil, no irigation, MY 55-14 variety, base fertilizer 200 kg N + 100 kg P2O5 in the Lam Son rgion is
17.7 kg K2O/ha.
3.2.4. K loss by leaching
Research results K2O amount loss by leaching (average 3-year 2010-2012) presented in Table
3.12 show that changes in water, leaching suspension soil, K2O content in them and the amount of K2O
loss by leaching at different levels of K fertilizing also occur similar to the case of erosion. The total
amount of K loss by average leaching of the fertilizing levels from 100-300 kg K2O /ha/year is 29.5 kg
K2O /ha, in which loss 99.2 % according to leaching water. The amount of K loss by leaching
13
suspension soil comprised up only 0.8 %. In the case of no K fertilizing, the amount of K loss by
leaching is 36.25 kg K2O /ha higher 6.71 kg K2O /ha (22.7 %) compared with the average of the
fertilizing formulas from 100-300 kg K2O /ha. The amount of K loss by average leaching of three
formulas 200, 250, 300 kg K2O /ha is 26.7 kg K2O /ha, 8.54 kg K2O/ha decrease (down 24.3 %),
compared with the amount of fertilizer 100 kg K2O /ha.
Table 3.12. K loss by leaching in the Lam Son region of Thanh Hoa (2010 - 2012)
No
1
Monitoring criteria
Basis
Basis + Basis + Basis + Basis + Basis +
100
150
200
250
300
K2O
K2O
K2O
K2O
K2O
K loss by leaching water
Leaching water (m3/ha)
9.186
7.257
6.522
6.063
4.961
4.593
K2O content (mg/l)
3,92
4,82
4,94
5,02
5,06
5,18
K2O loss by leaching water (kg/ha)
36,01
34,98
32,22
30,44
25,10
23,79
2 K loss by suspension soil
Leaching suspension soil (kg/ha)
10,67
8,43
8,11
7,79
7,90
7,36
K2O content (mg/l)
2,23
2,76
2,83
2,89
2,92
2,96
K2O loss by suspension soil (kg/ha)
0,24
0,23
0,23
0,23
0,23
0,22
Total K loss by leaching (kg/ha)
36,25
35,21
32,45
30,67
25,33
24,01
From the above results, the amount of K loss by leaching annually proposed to use to assess
nutrient balance and determine the appropriate amount of K fertilizing for sugarcane on typical gray
ferralit soil, no irigation, MY 55 -14 variety, fertilizing 200 kg N + 100 kg P2O5/ha in the Lam Son
region is 26.7 kg K2O/ha.
3.3. Relationship between the amount of K fertilizer with yield, quality of sugarcane, sugar yield, and
K loss per harvedted products
3.3.1. Effect of K fertilizing volume on growth, yield, and quality of sugarcane, sugar yeild
Results of the study affect the amount of K fertilizing on growth, yield, and quality of sugar cane,
cane sugar yield of MY 55-14 variety on typical gray ferralit soil, no irigation, basic fertilizing 200 kg
N + 100 kg P2O5 /ha in the Lam Son region presented in Table 3.13 show:
- For the growth of sugarcane: K fertilizing had a positive influence tillering situation, rising and
spending diameter of plant, plant weight, plant density at harvest. However, the increase in the growth
indicators is evident only in low amount of fertilizing (100-150 kg K2O/ha) and stopped in the amount
of fertilizing 200 kg K2O /ha.
Comparison between the K fertilizing formula with no K fertilizing formula showed a significant
difference in the growth indicators of sugarcane: tillering average coefficient of the fertilizing volume
from100 kg K2O /ha to 300 kg K2O /ha increased 0.31 times; plant height increased 14.3 % (33.3 cm);
stem diameter increased 12.4 % (0.30 cm); plant volume 16.5 % (0.17 kg/tree); effective plant density
at harvest increased 13.2 % (0.70 plant/m2). Between the amounts of K fertilizing, the growth indicators
increase in the amount of fertilizing 100 kg K2O /ha to 150 kg K2O /ha, then stopped at 200 kg K2O.
- For cane yield: K fertilizing increased the growth indicators lead to increasing cane yield, but the
difference is only evident when comparing the K fertilizing formula with no K fertilizing formula.
Among the fertilizing levels, cane yield increased only in the amount of fertilizing 100 kg/ha and
stopped in the amount of fertilizing 150 kg K2O /ha.
No K fertilizing, cane yield reached 57.85 tons/ha. Fertilizing 100kg K2O/ha, yield was 66.37 increase
of 14.7%, (8.52 tonnes / ha), exceeding the limit significant differecnces at 95% probcapacity (LSD0, 05 =
7, 17 tons/ha). The amount of fertilizing 150 kg K2O/ha, sugarcane yields continue rising, compared to
fertilizing 100 kg K2O /ha, but increasing rate is low (3.76 tons / ha) and lies within the experimental error.
Thus, although the growth indicators increase the amount of fertilizing to 150 kg K2O /ha, the increase is not
large enough to be able to increase productivity with certainty at this fertilizing level.
14
Table 3.13. growth, yeild, quality of sugarcane, sugar yeild
No
1
Monitoring criteria
Basis
Basis +
100
K2O
Basis +
150
K2O
Basis +
200
K2O
Basis +
250
K2O
Basis + LSD0.05
300
K2O
Growth
Tillering ratio (time)
0,97
1,17
1,27
1,31
1,30
1,31
0,13
Plant height (cm)
232,75 253,66 264,09 268,87 270,45 273,15
28,73
Stem diameter (cm)
2,45
2,67
2,76
2,77
2,77
2,80
0,26
Plant volume (kg/plant)
1,02
1,13
1,18
1,2
1,21
1,22
0,14
2
Plant density (plant/m )
5,34
5,68
5,99
6,17
6,16
6,21
6,62
2
Sugarcane yield (ton/ha)
57,85
66,37
70,13
71,77
71,08
71,83
7,17
3
Sugarcane quality
Bix (0)
18,40
19,16
19,43
19,97
20,23
20,63
The rich sugar (Pol %)
13,39
15,95
16,39
17,15
17,32
17,67
Purity (AP %)
81,62
84,44
86,76
88,22
88,14
89,90
Reducing sugar content (RS %) 2,59
1,44
1,23
1,10
0,97
1,00
4
Commercial Cane Sugar (CCS)
8,98
10,12
10,70
11,11
11,13
11,39
0,27
5
Sugarcane yield (ton/ha)
5,19
6,71
7,49
7,97
8,16
8,18
0,73
- For cane quality: K fertilizing affects significantly to improve the sugarcane juice quality and
sugar content in plants. Indicators: Brix, Polarization (Pol), the purity of sugarcane juice (AP) increase
continuously in the amounts of fertilizing from 100 kg K2O /ha to 300 kg K2O /ha, while reducing sugar
content (RS) decreases. Compared with the no K fertilizing, Brix (average of the amount of fertilizer
100-300 kg K2O/ha) increased 1.48 degrees; Pol increased 3.51 degrees; AP increased by 5.87%; RS
decreased 1.44 %.
- For commercial cane sugar: sugar content of commercial sugarcane increased continuously in
the amount of fertilizing from 100 kg to 250 kg K2O/ha and stop fertilizing at 300 kg K2O/ha.
Compared with no K fertilizing, the average sugar content in the fertilizing formulas from 100 kg to 300
kg K2O/ha up 21.7%, corresponding to 1.95 CCS.
Comparison between K fertilizin levels showed: increasing level of sugar content between 150 kg
K2O /ha compared with 100 kg K2O /ha is 0.58 CCS and between 200 kg K2O /ha compared with 150
kg K2O /ha is 0,41 CCS. The difference is very reliable, exceeding the limit significant differences at
95% probcapacity (LSD0, 05 = 0.35 CCS). The difference in sugar content between the amount of
fertilizer 250 kg K2O /ha compared with 200 kg K2O /ha, although it is not beyond the scope of
laboratory data, it is still at high levels (up 0.22 CCS).
- For sugar yield: K fertilizing causes increasing sugarcane yields, especially sugar content lead to
increasing sugar yield. Compared with the control no K fertilizing, yield averages of the amount of
fertilizing from 100 kg K2O/ha to 300 kg K2O/ha reached 7.7 tonnes/ha, increased of 48.4% (2.51
tonnes/ha). Among the levels of K fertilizing, sugar yield gap between the amount of fertilizing 150 kg K2O
/ha compared with 100 kg K2O /ha (0.78 tonnes / ha) was reliable (LSD0, 05 = 0.73 tons/ha ). The
difference between the amount of fertilizing 200 kg K2O /ha compared with 150 kg K2O /ha is 0.48 tons/ha,
although it is not beyond the scope of experimental error, it is high increasing rates (0.48 tonnes / ha).
In a word, the K fertilizing level, that brings benefits for growth and cane yield, is 150 kg K2O
/ha. However, due to increased levels of sugarcane fertilizing continuously from 100 kg K2O /ha to 200
kg K2O /ha and only stopped when applied to K2O /ha, so the amount of K fertilizing for sugar yield the
best was determined at 200 kg K2O /ha.
15
3.3.2. Effect of the amount of K fertilizing to sugarcane pest situation
Table 3.14. Effect of the amount of K fertilizing to sugarcane pest situation
No
Formulas
Ostrinia nubilalis
Ceratovacum lanigera
Rate (%)
Levels
Rate (%)
Levels
1
Basis
26,2
4
47,6
4
2
Basis + 100 K2O
19,7
3
34,5
3
3
Basis + 150 K2O
18,4
2
25,2
2
4
Basis + 200 K2O
16,6
2
23,3
2
5
Basis + 250 K2O
13,8
2
22,7
2
6
Basis + 300 K2O
13,4
2
22,8
2
Monitoring results of Ostrinia nubilalis and Ceratovacum lanigera situation at K fertilizing
volumes presented in Table 3.24 showed that: K fertilizing could decrease damaged rate of Ostrinia
nubilalis and Ceratovacum. If K fertilizing volume increases, damaged rate decreases. On the 200 N +
100 P2O5 fertilizing and no K fertilizing, Ostrinia nubilalis ratio on the sapling period period is at 26.2
% (level 4), the rate of Ceratovacum lanigera in ripening period - harvest (September in last year to
April in next year ) is 47.6 % (level 4), up 9.82 % and 21.9 % (up1 level) compared with the average of
fertilizing volumes from 100 kg K2O/ha to 300 kg K2O/ha for Ostrinia nubilalis and Ceratovacum
lanigera rate respectively. Between the level of K fertilizing, Ostrinia nubilalis rate decreased from 19.7
% to 13.4 % , Ceratovacum lanigera rate decreased from 35.5 % to 22.8 % (down from level 3 to level
2) in the amount of fertilizing 100 kg K2O/ha and 300 kg K2O/ha respectively. This is also one of the
reasons for increasing quality while increasing cane quantity as K fertilizing
3.3.3. K productivity at different fertilizing levels
Table 3.15. K productivity at different fertilizing levels
No
Formulas
Yield
Difference with basis
K productivity
Sugarcane
Sugar
Sugarcane
Sugar
Kg sugarcane/
Kg sugar/
(ton/ha)
(ton/ha)
(ton/ha)
(tấn/ha)
kg K2O
kg K2O
1 Basis
57,85
5,19
2 Basis + 100 K2O
66,37
6,71
8,52
1,52
85,20
15,20
3 Basis + 150 K2O
70,13
7,49
12,28
2,30
81,87
15,33
4 Basis + 200 K2O
71,77
7,97
13,92
2,78
69,60
13,90
5 Basis + 250 K2O
71,98
8,16
14,13
2,97
56,52
11,88
6 Basis + 300 K2O
71,83
8,18
13,98
2,99
46,60
9,97
Table 3.25 show: K productivity reaches the highest at fertilizing volume 100 kg K2O/ha (85.2 kg
cane/kg K2O) and fertilizing volume 150 kg K2O /ha for sugar volume (reaching 15, 33 kg sugar /kg K2O),
and then gradually reduce the amount of fertilizing at higher (from 150 K2O/ha for sugarcane and 200
K2O/ha or more for sugar). Compared to 100 kg K2O/ha fertilizer, fertilizing amount 100 kg K2O/ha in
which performance begins to decline, for cane is 250 kg K2O/ha (33.7% reduction, respectively 28.68 kg
cane/kg K2O), and for sugar is 300 kg K2O/ha (34.9% reduction, respectively, 5.36 kg of sugar/kg K2O).
3.3. 4. The relationship between K fertilizing volume and sugarcane yield, cane yield
Based on the basis of 200N + 100 P2O5 fertilizing, MY 55-14 variety grows in typical gray ferralit
soil, no irigation in the Lam Son region, among cane yield, sugar yield and K fertilizing volume (0-300
kg K2O/ha) correlated quadratic as follows (Figure 3.3)
16
NS đường (kg/ha)
NS mía (kg/ha)
Lượng bón K2O (kg/ha)
Cane yield – planting cane
ƯNS mía (kg/ha)
Lượng bón K2O (kg/ha)
Sugar yield – planting cane
NS đường (kg/ha)
Lượng bón K2O (kg/ha)
Cane yield – ratoon cane1
Lượng bón K2O (kg/ha)
Sugar yield – ratoon cane 1
NS mía (kg/ha)
NS đường (kg/ha)
Lượng bón K2O (kg/ha)
Lượng bón K2O (kg/ha)
Cane yield – ratoon 2
Sugar yield – ratoon 2
Figure 3.3. The correlation between the K fertilizing volume and cane yield, sugar yield
On the basis of the correlation equation, the K fertilizing volume maximum about techical and
optimum about economics for sugarcane yield, sugar yield is determined and presented in Table 3:16
Table 3.16. K fertilizing volume maximum technique and optimum economics
Cane types
K fertilizing volume maximum
K fertilizing volume optimum
technique (kg K2O/ha)
economics (kg K2O/ha)
Cane
Sugar
Cane
Sugar
Newly cane
252,14
299,27
209,70
269,19
Root cane 1
254,82
316,15
213,14
286,91
Root cane 2
261,75
285,26
198,29
251,30
Average
255,70
301,00
204,80
267,90
Note: cost of fertilizer KCl (60% K2O): 12.000đ/kg; cost of sugarcane 10 CCS: 950đ/kg)
From the results in Table 3.16 show: the purchase price of sugarcane 10 CCS is 950 VND /
kg; price of KCl (60% K2O) is 12,000 VND / kg, fertilizing volume optimum economics for
sugarcane yield was 204.8 kg K2O /ha lower than 50.9 kg K2O /ha compared to the amount of
fertilizer maximum techniques. The fertilizing volume optimum economics for sugar yield was
267.9 kg K2O /ha less than 33.1 kg K2O /ha compared to the amount of fertilizing maximum
techniques. Theoretically, K fertilizers can moderate K2O /ha 255.7 kg to a maximum cane yield
and 301 kg K2O /ha to achieve maximum sugar yields.
17
3.3.5. Relationship between K fertilizing volume and K loss according to harvested product
Table 3.17. Effect of K on K2O volume in harvest products
No
1
Content
Basis
Basis
+100
K2O
Basis
+150
K2O
Basis
+200
K2O
Basis
+250
K2O
Basis
+300
K2O
LSD0.05
Stem of cane
Fresh volume
57,85 66,37 70,13 71,77 71,98 71,83
7,17
Dry matter content (%)
22,58 23,69 24,08 24,35 24,42 24,38
2,28
K2O content (%)
0,38
0,52
0,57
0,63
0,67
0,68
0,046
Cummulative K2O volume (kg/ha) 49,49 81,78 96,06 109,31 116,07 118,35 5,26
2
Cane foliage
Fresh volume
21,33 24,56 25,98 26,69 27,72 26,66
2,72
Dry matter content (%)
22,35 24,37 24,49 24,51 24,57 24,55
2,43
K2O content (%)
0,45
0,71
0,74
0,77
0,81
0,83
0,054
Cummulative K2O volume (kg/ha) 21,39 42,40 47,13 50,32 52,57 54,08
3,54
The research results about effect of the amount of K fertilizing on K2O amount loss follow
harvested products (plant cane, cane foliage) presented in Table 3.17 shows:
- For the amount of K loss by product of sugarcane: K fertilizing increases the volume of
sugarcane, dry matter content and K2O content lead to an increased amount of K2O accumulation.
Compared with no K fertilizing, the average amount of sugarcane in the fertilizing formula from 100 kg
K2O /ha to 300 kg K2O /ha is 21.7% (12.57 tonnes / ha); dry matter content is higher than 1,6%; K2O
content is higher than 0.23%, result in that the volume of K2O increases 110.9% (54.82 kg K2O /ha).
Among the levels of K fertilizing, the accumulative K2O volume in sugarcane increased
continuously at the amount of fertilizing from 100 kg K2O /ha to 250 kg K2O /ha and stopped at 300 kg
K2O /ha. Compared with 100 kg K2O /ha, cumulative K2O volume in sugarcane at the amount of
fertilizing 150 kg K2O /ha, 200 kg K2O /ha and 250 kg K2O /ha increase respectively: 17.5% (14.28 kg
K2O/ha), 13.8% (13.25 kg K2O/ha) and 6.2% (6.76 kg K2O/ha). The difference in K2O volume is very
reliable, exceeding the limit significant differences at 95% probcapacity (LSD0, 05 = 5.26 kg K2O /ha).
- For the amount of K loss under sugarcane foliage after harvest: similar to sugarcane, foliage mass,
dry matter content, K2O content in foliage increased with increasing the amount of K fertilizing. Compared
with no K fertilizing, the average amount of sugar cane foliage of the formulas 100-300 kg K2O/ha increases
22.5% (higher than 4.79 tons/ha); dry matter content is higher than 2.5%; K2O content is higher than 0.32%
result in that a K2O volume increases 30.5% ( higher than 27.91 kg K2O/ha). The increase of the targets
tracked is very reliable, exceeding limits LDS0.05 (fresh sugarcane foliage mass = 2.72 tons/ha, dry matter
content = 2.43%, K2O content = 0.054 %, cumulative K2O volume = 3.54 kg/ha).
Compare among the different levels of K fertilizing shows the volume of sugarcane foliage and
dry matter content tends to increase continuously in the amount of fertilizing from 100 kg to 250 kg
K2O /ha. K2O content and accumulative K2O volume increased continuously for up to 300 kg K2O/ha.
However, only the difference in quality is evident K2O fertilizer at 150 kg compared with 100 kg
K2O/ha K2O /ha (K2O /ha increased 4.73 kg), 200 kg K2O /ha or more, the difference between the K
fertilizer rates have not exceeded the scope of experimental error (LSD0,05 = 3.54 kg K2O/ha).
Reciprocal internal efficiency of K (Riek), harvest index K (HIK) and K recovery efficiency of
mineral fertilizer (REK) in different levels of K fertilizer are presented in Table 3:18 .
18
Table 3.18. Effect of K on agronomic performance, harvest index, and K use efficiency
No
1
2
3
4
5
6
Formulas
Basis
Basis+100K2O
Basis+ 150K2O
Basis+ 200K2O
Basis+ 250K2O
Basis+ 300K2O
Thedifference
Acumulative K
compared
(kg K2O /ha)
with basis
Plant
Foliage Total
(kg K2O/ha)
cane
49,49 21,39 70,88
81,78 42,40 124,18
53,30
96,06 47,13 143,19
72,31
109,31 50,32 159,63
88,75
116,07 52,57 168,64
97,76
118,35 54,08 172,43
101,55
RIEK
HIK
REK (%)
0,12
0,19
0,21
0,22
0,24
0,24
0,70
0,66
0,67
0,68
0,69
0,69
45,09
42,73
40,27
35,82
31,11
For RIEK: K fertilizing increases the volume of sugarcane, cane foliage volume after harvest as
well as dry matter content, content of K2O and accumulative K2O amount in them, leading to increased
RIEK. RIEK average fertilizing level of 100 -300 kg K2O/ha is 0.22% higher than 0.83 times the formula
that does not fertilizer K. Among K fertilizing levels, RIEK continuous increase in levels from 100 kg
K2O /ha to 250 kg K2O /ha (up from 0.19% in the amount of 100 kg K2O /ha, up 0.24% in the amount
of 250 kg K2O /ha) and stop fertilizer at 300 kg K2O/ha.
From the above results, the linear correlation between the amount of K fertilizer and Riek in
different sugarcane crop is determined and presented in Figure 3.4.
RIEK(%
)
RIEK(%
)
Cane yield
(ton/ha)
Planting
Cane yield
(ton/ha)
Ratoon 1
RIEK(%
)
RIEK(%
)
Cane yield
(ton/ha)
Cane yield
(ton/ha)
Ratoon 1
Average of 3 crops
Figure 3.4. Relationship between cane yield and reciprocal internal efficiency of K (RIEK)
For HIK: K fertilizing affects simultaneously increase in K2O volume both product of sugarcane
and leaves of sugarcane as harvest. However, due to the increase in the amount of K2O in sugarcane
higher than the increase in the amount of K2O in foliage, resulting in that HIK in the K fertilizing
formulas decreased compared with no K fertilizing. HIK average of the amount of fertilizing from 100
kg K2O /ha to 300 kg K2O /ha is 0.68 while HIK in fertilizing formula K is 0.70. However, when
comparing the level of K fertilizing noticed, HIK have tended to increase with increasing the K
fertilizing volume: increase from 0.66 at 100 kg K2O /ha up 0.70 at 300 kg K2O/ha.
From the results showed no significant variation about HIK between the K fertilizing volumes.
Thus, it can use average data (HIK = 0.68) to calculate the equilibrium and set equatation to determine K
fertilizing suit for sugarcane on the basis of nutrient balance.
- For REK: fertilizing at 100-300 kg K2O /ha, REK ranged 31-47% and in the direction of
decreasing with increasing amount of fertilizer applied at 100 kg K2O /ha is 45.9%. Increase the amount
19
of fertilizer to 250 kg K2O /ha and 300 kg K2O /ha, REK fell to 35.82% (down 9.27%) and 31.11%
(down 13.98%), respectively.
To simplify and facilitate the application of research results in practical production, REK
introduced to use in balanced calculation and determine the amount of K fertilizing on the basis of
nutrient balance is 40%.
3.4. K balance and determination of suitable K fertilizing volume for cane base on nutrional
balance in the Lam Son sugarcane area.
3.4.1. K balance for cane at different K fertilizing levels
On the basis of the research results about quantity and the relationship between nutrient input and
nutrient outputs, K balance for sugarcane at different K fertilizing levels, base 200N + 100 P2O5
fertilizing, MY 55-14 sugarcane varieties grown on typical gray ferralit soil, no irigation in the Lam Son
region is determined and presented in Table 3.19.
Table 3.19. K balance for cane in the different K fertilizing volume
No
1
Nutrient source
Basis
Basis +
100 K2O
Basis +
150 K2O
Basis +
200 K2O
Basis +
250 K2O
Basis +
300 K2O
108,21
100
158,21
150
208,21
200
258,21
250
308,21
300
8,21
8,21
8,21
8,21
8,21
8,21
Output
135,2
182,86
196,34
208,63
210,65
214,56
Loss by stem removal
49,49
81,78
96,06
109,31
116,07
118,35
Loss by foliage removal
21,39
42,4
47,13
50,32
52,57
54,08
Loss by erosion
28,07
23,45
20,7
18,35
16,69
18,14
Loss by leaching
3
8,21
-
Rain water
2
Input
Mineral fertilizers
36,25
35,23
32,45
30,65
25,32
23,99
Balance
-126,99 -74,65
-38,13
-0,42
47,56
93,65
The results in Table 3:19 shows that no K fertilizing, not buried back cane foliage, negative K
balance at the average 127 K2O/ha/vụ. Mineral K fertilizing, K balance decreased from 74.6 kg K2O/ha
at fertilizing level 100 kg K2O/ha to 0.4 kg K2O/ha at fertilizing level 200 kg K2O/ha K balance
achieved at fertilizing level 250 kg K2O/ha upwards, so to ensure K reserves in the soil is not decline,
the K fertilizing volume needs a minimum of 200 K2O/ha/vụ.
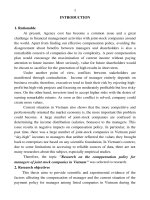
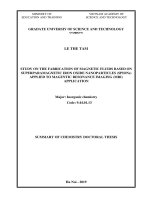
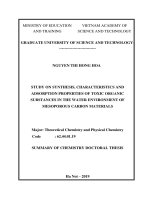
3.4.2. K balance for cane in exist productional condition
Đầu
vào
Kali cung cấp từ
phân khoáng
(IN1)
Cân
bằng
Kali cung cấp từ
nước mưa
(IN 3)
Dinh dưỡng kali dự trữ
Trung
gian
Đầu
ra
Kali cung cấp từ
phân hữu cơ
(IN2)
trong đất
Kali mất do rửa
trôi chiều sâu
(OUT 4)
Kali mất do xói
mịn bề mặt
(OUT 3)
Cân bằng kali hồn tồn
(IN1 + IN2 + IN 3) –
(OUT1 + OUT 2 + OUT 3 + OUT
4)
Kali mất theo
sản phẩm mía
nguyên liệu
(OUT1)
Kali mất theo
ngọn lá mía sau
thu hoạch
(OUT 2)
Cân bằng kali theo sản phẩm
(IN1 + IN2 + IN 3) –
(OUT1 + OUT 2)
Figure 3.5. Diagram of K balance for cane in exist productional conditions in the Lam Son
sugarcane area
20
- K nutrient input from fertilizer: analyzing results in chemical compostions, organic material and
determine K due to NPK presented in Table 3.20; 3.21.
Table 3.20. Chemical composition, organic materials produce NPK Lam Son
N
P 2 O5
Dry
(%)
(% dry weight)
Sludge of sugar mill
7,1
31,5
1,76
1,91
Table 3.21. Nutrient volume N, P2O5, K2O is provided by NPK Lam Son
Materials
pH(KCl)
K2O
1,28
P 2 O5
K2O
(kg/ha)
NPK Lam Son
2.000
5,8
6,3
4,2
- K nutrient source was lost by harvested products: the average cane yield 62 tonnes/ha, K2O
volume loss by product of sugarcane and cane foliage when harvest determined through reciprocal
internal efficiencyof K (RIEK GY = 0.007 - 0.327) is 107 Kg K2O/ha.
- Balance: K balanced calculation results presented in Table 3:22 show, in the current sugarcane
production, the amount of fertilizer to 2,000 kg / ha NPK Lamson, average cane yield 62 tonnes / ha, no
buried cane foliage returns, K balance is 7 Kg K2O/ha/vu.
Table 3.22. Cân bằng K cho mía trong điều kiện sản xuất mía hiện tại
Supplying source
Nutrient source K
Input
Output
Balance
Symbol
IN 1
IN 2
IN 3
Total
OUT 1
OUT 2
OUT 3
OUT 4
Total
Volume (kg/ha)
N
Describe
K mineral in NPK Lam Son
K organic in NPK Lam Son
K from rain water
K loss by cane stem removal
K loss by residue removal afer harvesting
K loss due to erosion
K loss due to leaching
Volume (kg
K2O/ha)
132,0
4,2
8,2
144,4
107,0
17,7
26,7
154,4
- 7,0
3.4.2. The equation determines the suitable K fertilizing volume for sugarcane on the basis of
nutrional balance
- General equation: on the basis of research results the relationship between the amount of K
fertilizing to yield and quality of sugar cane, the amount of K loss by harvested product and the amount
of K nutrient elements inputs and outputs in the Lam Son condition, the suitable K fertilizing volume
for sugarcane varieties MY 55-14 on typical gray soil, no irigation, fertilizing base 200N + 100P2O5,
has the form:
FK= [(GY x RIEK - KCR - KR + KE + KL) x FM] + (GY - GY0K) x RIEK/REK). where:
FK: mineral K needs to fertilizer to achieve targets of yield (kg K2O/ha)
GY: expected cane yield (ton/ha)
GY0K: cane yield in condition of no K fertilizing (ton/ha)
RIEK: K reciprocal internal efficiency(%)
KR: K supply due to rain water (kg K2O/ha/year)
KE: Amount of K loss by erosion (kg K2O/ha/year)
KL: Amoun of K loss by leaching (kg K2O/ha/year)