Luận văn : BƯỚC ĐẦU XÂY DỰNG QUY TRÌNH ĐỊNH LƯỢNG CÁC SẢN PHẨM BIẾN ĐỔI GEN BẰNG PHƯƠNG PHÁP REAL-TIME PCR part 9 pdf
Bạn đang xem bản rút gọn của tài liệu. Xem và tải ngay bản đầy đủ của tài liệu tại đây (434.55 KB, 13 trang )
91
91
Phụ lục 6: Dung dịch ethanol 70%.
- C
2
H
5
OH 70 %.
Phụ lục 7: Potassium acetate 3 M, pH 5,2
- Potassium acetate 3 mol/l
- Hòa tan trong nước siêu sạch.
- Hấp tiệt trùng
- Bảo quản ở nhiệt độ phòng.
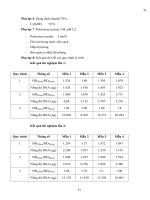
Phụ lục 8: Kết quả đo OD các quy trình ly trích
Kết quả thí nghiệm lần 1:
Quy trình
Thông số
Mẫu 1
Mẫu 2
Mẫu 3
Mẫu 4
1
OD
260nm
/OD
280nm
1.524
1.88
1.305
1.679
Nồng độ DNA (µg)
1.824
1.416
1.683
1.923
2
OD
260nm
/OD
280nm
1.888
1.678
1.825
1.731
Nồng độ DNA (µg)
6.06
3.135
5.787
3.276
3
OD
260nm
/OD
280nm
1.84
2.08
1.68
1.8
Nồng độ DNA (µg)
10.626
8.769
15.237
10.284
Kết quả thí nghiệm lần 2:
Quy trình
Thông số
Mẫu 1
Mẫu 2
Mẫu 3
Mẫu 4
1
OD
260nm
/OD
280nm
1.254
1.73
1.872
1.847
Nồng độ DNA (µg)
2.208
1.017
1.539
1.191
2
OD
260nm
/OD
280nm
1.848
1.875
1.696
1.594
Nồng độ DNA (µg)
7.674
6.756
5.856
4.389
3
OD
260nm
/OD
280nm
1.86
1.78
2.1
1.96
Nồng độ DNA (µg)
13.155
11.559
11.205
10.803
92
92
Kết quả thí nghiệm lần 3:
Quy trình
Thông số
Mẫu 1
Mẫu 2
Mẫu 3
Mẫu 4
1
OD
260nm
/OD
280nm
1.815
1.509
1.667
1.864
Nồng độ DNA (µg)
1.503
2.286
2.691
1.73
2
OD
260nm
/OD
280nm
1.245
1.208
1.755
1.697
Nồng độ DNA (µg)
4.134
5.022
3.375
5.0505
3
OD
260nm
/OD
280nm
1.81
1.84
1.79
1.82
Nồng độ DNA (µg)
10.767
10.911
11.268
11.352
93
93
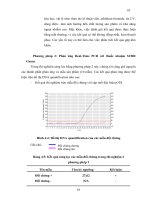
Phụ lục 9: Kết quả phản ứng Real-Time PCR với thuốc nhuộm SYBR Green I
Đợt 1:
PCR Quantification with Melt Curve Report
PCR Base Line Subtracted Curve Fit Data
Current Date: 25-Aug-05 06:24 PM
Data generated on: 28-Jul-05 at 12:47 PM.
Optical data file name: Data 28-Jul-05 1247-SYBR Green 35S-GMO.odm
Plate Setup file used: SYBR-Green 35S.psm
Protocol file used: SYBR Green-35S.tmo
Sample volume: 25.00 ul
Hot Start? No
Well factor collection: Experimental Plate
Comments
Protocol
Cycle 1: ( 1X)
Step 1: 95.0ºC for 03:00
Cycle 2: ( 50X)
Step 1: 95.0ºC for 00:25
Step 2: 62.0ºC for 00:30
Step 3: 72.0ºC for 00:45
Data collection and real-time analysis enabled.
Cycle 3: ( 1X)
Step 1: 72.0ºC for 07:00
Cycle 4: ( 80X)
Step 1: 55.0ºC for 00:10
Increase setpoint temperature after cycle 2 by 0.5ºC
Melt curve data collection and analysis enabled.
Cycle 5: ( 1X)
Step 1: 4.0ºC HOLD
PCR Amp/Cycle Graph for SYBR-490
94
94
Data Analysis Parameters
Calculated threshold using the maximum curvature approach is 20.0.
Per-well baseline cycles have been determined automatically.
Data analysis window is set at 95.00% of a cycle, centered at end of the cycle.
Weighted Mean digital filtering has been applied. Global filtering is off.
PCR Quantification Spreadsheet Data for SYBR-490
Well Identifier Ct Setpoint
D02 Bt-176 1% 27.56
D10 N/A
Melt Curve Graph for SYBR-490
Melt Curve Analysis Parameters
Weighted Mean digital filtering has been applied. Global filtering is off.
Threshold for automatic peak detection is set at 1.00.
Melt Curve Analysis Spreadsheet Data for SYBR-490
Well Well Identifier Peak ID Melt Temp Beg. Temp End Temp Peak Descriptor
D2 Bt-176 1% D2.1 86.5 80.5 91.5
D2.2 77.0 74.5 80.0
D2.3 73.0 72.5 74.0
D2.4 70.0 69.5 72.5
D2.5 68.0 66.5 69.0
D2.6 64.5 57.0 66.0
D10 D10.1 60.0 55.0 62.0
95
95
Đợt 2:
PCR Quantification with Melt Curve Report
PCR Base Line Subtracted Curve Fit Data
Current Date: 25-Aug-05 06:29 PM
Data generated on: 05-Aug-05 at 03:35 PM.
Optical data file name: Data 05-Aug-05 1505 SYBR Green -dot 5-3.odm
Plate Setup file used: SYBR Green 35S dot 5 5-8-0518.psm
Protocol file used: SYBR Green-35S-2.tmo
Sample volume: 25.00 ul
Hot Start? No
Well factor collection: Experimental Plate
Comments
Protocol
Cycle 1: ( 1X)
Step 1: 95.0ºC for 01:30
Cycle 2: ( 50X)
Step 1: 95.0ºC for 00:25
Step 2: 62.0ºC for 00:30
Step 3: 72.0ºC for 00:45
Data collection and real-time analysis enabled.
Cycle 3: ( 1X)
Step 1: 72.0ºC for 07:00
Cycle 4: ( 80X)
Step 1: 55.0ºC for 00:10
Increase setpoint temperature after cycle 2 by 0.5ºC
Melt curve data collection and analysis enabled.
Cycle 5: ( 1X)
Step 1: 15.0ºC HOLD
PCR Amp/Cycle Graph for SYBR-490
Data Analysis Parameters
96
96
Calculated threshold has been replaced by the user selected threshold 68.8.
User selected baseline cycles are 2 to 10.
Data analysis window is set at 95.00% of a cycle, centered at end of the cycle.
Weighted Mean digital filtering has been applied. Global filtering is off.
PCR Quantification Spreadsheet Data for SYBR-490
Well Identifier Ct Setpoint
D02 B1 20.62
F07 B10 24.04
D06 B11 41.04
D04 B2 16.96
B04 B3 N/A
D10 B4 22.22
B06 B5 N/A
F03 B6 21.15
F05 B7 22.22
F09 B9 N/A
Melt Curve Graph for SYBR-490
Melt Curve Analysis Parameters
Weighted Mean digital filtering has been applied. Global filtering is off.
Threshold for automatic peak detection is set at 1.00.
Melt Curve Analysis Spreadsheet Data for SYBR-490
Well Well Identifier Peak ID Melt Temp Beg. Temp End Temp Peak Descriptor
B4 B3 B4.1 62.5 60.5 68.0
B4.2 59.0 55.5 60.5
B6 B5 B6.1 91.5 89.5 93.5
B6.2 86.0 85.5 88.0
B6.3 83.0 77.5 85.5
B6.4 75.0 74.0 77.0
B6.5 71.0 69.0 73.0
B6.6 67.5 66.5 68.5
B6.7 64.0 62.5 66.0
B6.8 60.5 56.0 62.0
D2 B1 D2.1 86.5 78.0 91.5
D2.2 69.0 67.5 70.0
D2.3 66.5 64.5 67.0
D2.4 62.5 62.0 63.5
D2.5 59.5 56.5 61.0
D4 B2 D4.1 93.5 90.0 94.5
D4.2 86.5 82.5 89.5
97
97
D4.3 81.5 78.5 82.0
D4.4 74.0 73.0 77.0
D4.5 71.0 69.5 72.0
D4.6 67.0 65.0 69.0
D4.7 62.0 60.0 62.5
D6 B11 D6.1 92.5 92.0 94.5
D6.2 86.0 81.0 91.0
D6.3 79.0 76.0 80.0
D6.4 73.5 73.0 75.5
D6.5 71.0 69.5 72.0
D6.6 68.0 67.0 69.0
D6.7 65.0 61.0 66.5
D6.8 59.5 56.5 60.5
D10 B4 D10.1 86.5 82.0 91.0
D10.2 79.0 77.0 81.5
D10.3 72.0 70.0 73.5
D10.4 67.0 65.5 69.0
D10.5 64.5 61.0 65.0
D10.6 60.0 57.0 61.0
F3 B6 F3.1 86.0 82.0 89.5
F3.2 79.5 77.5 81.5
F3.3 73.5 71.5 75.5
F3.4 69.0 65.5 70.5
F3.5 63.0 62.0 65.0
F3.6 59.5 55.0 60.5
F5 B7 F5.1 86.0 79.0 92.5
F5.2 77.0 75.0 77.5
F5.3 72.0 71.0 74.5
F5.4 65.0 62.5 69.0
F5.5 59.5 55.5 62.0
F7 B10 F7.1 86.0 77.5 90.0
F7.2 72.5 71.0 74.5
F7.3 67.5 66.0 70.5
F7.4 63.5 62.0 65.5
F7.5 60.5 56.5 61.5
F9 B9 F9.1 83.0 81.0 90.0
F9.2 78.0 76.0 80.5
F9.3 74.0 73.5 75.0
F9.4 72.0 70.0 73.0
F9.5 66.5 64.0 68.5
F9.6 62.0 55.0 63.5
98
98
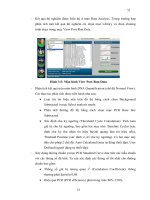
Đợt 3:
PCR Standard Curve Report
with PCR Amp Cycle Graph
PCR Base Line Subtracted Curve Fit Data
Current Date: 29-Aug-05 04:11 PM
Data generated on: 17-Aug-05 at 03:21 PM.
Optical data file name: Data 17-Aug-05 1520 SYBR Dot 6-2-bao cao.odm
Plate Setup file used: SYBR Green I dot 6 17-7-0522.psm
Protocol file used: SYBR Green-35S-2.tmo
Sample volume: 25.00 ul
Hot Start? No
Well factor collection: Experimental Plate
Comments
Protocol
Cycle 1: ( 1X)
Step 1: 95.0ºC for 01:30
Cycle 2: ( 50X)
Step 1: 95.0ºC for 00:25
Step 2: 62.0ºC for 00:30
Step 3: 72.0ºC for 00:45
Data collection and real-time analysis enabled.
Cycle 3: ( 1X)
Step 1: 72.0ºC for 07:00
Cycle 4: ( 80X)
Step 1: 55.0ºC for 00:10
Increase setpoint temperature after cycle 2 by 0.5ºC
Melt curve data collection and analysis enabled.
Cycle 5: ( 1X)
Step 1: 15.0ºC HOLD
PCR Amp/Cycle Graph for SYBR-490
99
99
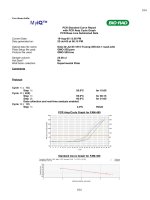
Standard Curve Graph for SYBR-490
Data Analysis Parameters
Calculated threshold has been replaced by the user selected threshold 18.2.
User selected baseline cycles are 2 to 24.
Data analysis window is set at 95.00% of a cycle, centered at end of the cycle.
Weighted Mean digital filtering has been applied. Global filtering is off.
Standard Curve Spreadsheet Data for SYBR-490 Units: copy number
Type Identifier Rep Ct Log SQ SQ SQ Ct Ct Set
SQ Mean SD Mean SD
Point
B02 Standard ST 35S 1 22.99 3.709 5.12E+03 5.12E+03 N/A 22.99 N/A
B03 Standard ST 35S 2 24.32 2.806 6.40E+02 6.40E+02 N/A 24.32 N/A
B04 Standard ST 35S 3 25.26 1.903 8.00E+01 8.00E+01 N/A 25.26 N/A
D02 Unknown Mau 1 copy 2 27.58 0.106 1.28E+00 8.88E+00 1.08E+01 26.88 9.86E-01
F02 Unknown Mau 1 copy 2 26.18 1.217 1.65E+01 8.88E+00 1.08E+01 26.88 9.86E-01
Melt Curve Graph for SYBR-490
100
100
Melt Curve Analysis Parameters
Weighted Mean digital filtering has been applied. Global filtering is off.
Threshold for automatic peak detection is set at 1.00.
Melt Curve Analysis Spreadsheet Data for SYBR-490
Well Well Identifier Peak ID Melt Temp Beg. Temp End Temp Peak Descriptor
B2 ST 35S B2.1 86.0 80.0 90.0
B2.2 74.5 74.0 76.5
B2.3 73.0 70.5 73.5
B2.4 68.0 66.5 70.0
B2.5 65.0 64.0 66.0
B2.6 58.5 55.0 63.5
B3 ST 35S B3.1 86.0 76.0 89.5
B3.2 73.5 73.0 75.5
B3.3 69.5 68.5 72.5
B3.4 65.5 64.0 68.0
B3.5 58.5 55.0 61.5
B4 ST 35S B4.1 86.5 79.0 91.0
B4.2 77.0 75.0 78.5
B4.3 71.5 70.0 74.5
B4.4 68.0 66.5 69.5
B4.5 64.5 61.5 65.5
B4.6 59.0 56.5 61.0
D2 mau 1 copy D2.1 86.5 77.5 91.0
D2.2 75.0 73.0 76.0
D2.3 71.5 70.5 72.5
D2.4 67.0 66.0 69.5
D2.5 58.5 55.5 61.0
F2 mau 1 copy F2.1 85.5 76.0 90.0
F2.2 73.5 70.5 75.5
F2.3 68.0 67.0 70.0
F2.4 65.0 64.5 66.5
F2.5 62.5 61.5 64.0
F2.6 58.5 56.5 61.0
101
101
Phụ lục 10: Kết quả chạy phản ứng Real-Time PCR với mẫu dò Taqman
Đợt 1: Đƣờng chuẩn p35S
PCR Standard Curve Report
with PCR Amp Cycle Graph
PCR Base Line Subtracted Data
Current Date: 20-Aug-05 06:17 PM
Data generated on: 22-Jul-05 at 06:15 PM.
Optical data file name: Data 22-Jul-05 1815-Truong-35S-dot 1-sua2.odm
Plate Setup file used: GMO-35S.psm
Protocol file used: GMO-35S.tmo
Sample volume: 25.00 ul
Hot Start? No
Well factor collection: Experimental Plate
Comments
Protocol
Cycle 1: ( 1X)
Step 1: 95.0ºC for 10:00
Cycle 2: ( 45X)
Step 1: 95.0ºC for 00:15
Step 2: 60.0ºC for 01:00
Data collection and real-time analysis enabled.
Cycle 3: ( 1X)
Step 1: 4.0ºC HOLD
PCR Amp/Cycle Graph for FAM-490
Standard Curve Graph for FAM-490
102
102
Data Analysis Parameters
Calculated threshold using the maximum correlation coefficient approach is 33.9.
User selected baseline cycles are 2 to 20.
Data analysis window is set at 95.00% of a cycle, centered at end of the cycle.
Weighted Mean digital filtering has been applied. Global filtering is off.
Standard Curve Spreadsheet Data for FAM-490 Units: copy number
Type Identifier Rep Ct Log SQ SQ SQ Ct Ct Set
SQ Mean SD Mean SD
Point
E02 Standard Stan Corn-Ref 5 26.83 3.709 5.12E+03 5.12E+03 N/A 26.83 N/A
E04 Standard Stan Corn-Ref 6 30.04 2.806 6.40E+02 6.40E+02 N/A 30.04 N/A
E06 Standard Stan Corn-Ref 7 33.07 1.903 8.00E+01 8.00E+01 N/A 33.07 N/A
Đợt 2: Định lƣợng bắp chuyển gen Bt 176 1% (lần 1)
Promoter 35S:
PCR Standard Curve Report
with PCR Amp Cycle Graph
PCR Base Line Subtracted Data
Current Date: 19-Aug-05 12:01 PM
Data generated on: 22-Jul-05 at 06:15 PM.
Optical data file name: Data 22-Jul-05 1815-Truong-35S-dot 1-sua2.odm
Plate Setup file used: GMO-35S.psm
Protocol file used: GMO-35S.tmo
Sample volume: 25.00 ul
Hot Start? No
Well factor collection: Experimental Plate
Comments
Protocol
Cycle 1: ( 1X)
103
103
Step 1: 95.0ºC for 10:00
Cycle 2: ( 45X)
Step 1: 95.0ºC for 00:15
Step 2: 60.0ºC for 01:00
Data collection and real-time analysis enabled.
Cycle 3: ( 1X)
Step 1: 4.0ºC HOLD
PCR Amp/Cycle Graph for FAM-490
Standard Curve Graph for FAM-490
Data Analysis Parameters
Calculated threshold has been replaced by the user selected threshold 67.5.
User selected baseline cycles are 2 to 20.
Data analysis window is set at 95.00% of a cycle, centered at end of the cycle.
Weighted Mean digital filtering has been applied. Global filtering is off.
Standard Curve Spreadsheet Data for FAM-490 Units: copy number
Type Identifier Rep Ct Log SQ SQ SQ Ct Ct Set
SQ Mean SD Mean SD
Point
E02 Standard Stan Corn-Ref 5 27.88 3.709 5.12E+03 5.12E+03 N/A 27.88 N/A
E04 Standard Stan Corn-Ref 6 31.35 2.806 6.40E+02 6.40E+02 N/A 31.35 N/A
E06 Standard Stan Corn-Ref 7 34.25 1.903 8.00E+01 8.00E+01 N/A 34.25 N/A
E08 Standard Stan Corn-Ref 8 36.22 1.000 1.00E+01 1.00E+01 N/A 36.22 N/A
E11 Unknown Bt 10 32.59 2.302 2.00E+02 2.00E+02 N/A 32.59 N/A