Atomic Force Microscopy in Cell Biology Episode 1 Part 9 docx
Bạn đang xem bản rút gọn của tài liệu. Xem và tải ngay bản đầy đủ của tài liệu tại đây (1007.22 KB, 20 trang )
164 Davis et al.
10. Perfusion apparatus; standard system for retrograde coronary perfusion (see ref.
24 for details).
11. DMEM solution (Life Technologies, UK).
12. Serum substitute; Ultroser G ( Life Technologies, UK, cat. no. 81-003).
13. Collagenase; Worthington Type CLS I (Lorne Laboratories, UK).
14. Glutaraldehyde (Sigma-Aldrich).
15. 10-mL Sterile tubes (Sigma-Aldrich, cat. no. C-3084).
Centrifuge Note: with heart cells, small benchtop centrifuges are not to be
recommended because their rapid acceleration can damage myocytes. Much
better are the larger free-standing cooled types, such as the Mistral 4L.
3. Methods
The methods described below outline the process of (1) cell preparation,
isolation, and electron microscopy characterization and (2) scanning force char-
acterization.
3.1. Cell Preparation and Electron Microscopy Characterization
The detailed tissue dissociation protocols for the adult heart (24) will pro-
vide isolated myocytes suspended in Dulbecco’s modified Eagle’s medium
supplemented with pyruvate and 10 mM HEPES to which has been added 2%
(v/v) serum substitute. It is convenient to store cells at room temperature in
sterile 10-mL tubes from Sigma-Aldrich. As long as standard precautions have
been taken during isolation, these myocytes can be used for up to 24 h without
any antibiotics. When incubation at 37°C is used (100% O
2
with HEPES media
or 95 % O
2
/5% CO
2
v/v if bicarbonate buffered only) then antibiotics must be
added. Myocytes can be plated directly on to cover slips. Alternatively, cells
can be fixed by first resuspending in Krebs’ buffer (NaCl, 134.1; KCl, 5.4;
NaH
2
PO
4
.2H
2
O, 0.3; MgCl
2
, 1; Na acetate.3H
2
O, 5; Na pyruvate, 5; glucose,
11.1; HEPES, 5; all mM, pH adjusted to 7.4 with NaOH) and then adding 1
volume of myocytes to 2.5 % v/v glutaraldehyde in 1/3 Krebs’ buffer. Though
fixation is rapid, the cells are typically left for at least 30 min, then resus-
pended in phosphate-buffered saline and stored at 4°C. This fixative procedure
has been designed to reduce the osmotic strength of the fixation solution and
thereby reduce cell shrinkage.
High yields of ventricular myocytes from adult mammalian hearts are
obtainable using retrograde (Langendorff) coronary perfusion of the whole
organ, with fluids low in calcium, containing collagenase and protease. Details
of the procedures have been presented elsewhere (see, for example, ref. 24; see
Note 1). Examination of suspensions of isolated myocytes by bright-field light
microscopy showed two distinct cell types; a dominant rod-shaped form
together with a population of rounded cells (Fig. 1). It is clear from a number
AFM and Cardiac Physiology 165
Fig. 1. (1) Bright-field survey view of a preparation of isolated ventricular
myocytes. Damaged cells appear dark and round and are easily distinguished from the
intact rod-shaped cells. (magnification ×100). (2) Light microscope view at higher
magnification (×800) showing the structural details of rod-shaped cells. (3) Electron
micrograph of a longitudinal thin-section through an isolated rod-shaped myocyte.
Characteristic banded-structure myofilament bundles alternate between rows of mito-
chondria. In this example, there are 64 sarcomeres along the length of the cell. (mag-
nification ×1500). From ref. 25, with permission from Elsevier.
166 Davis et al.
of tests (dye exclusion, morphology from low-power light microscopy and elec-
tron microscopy) that the rounded cells are myocytes damaged by the dissocia-
tion protocols. Standard purification procedures can reduce the round cell
population to <10 % of the total. Of major interest are the rod-shaped cells,
which display many of the gross morphological characteristics expected from
studies of whole cardiac tissue. Isolated myocytes are more rectangular than
cylindrical with irregular profiles, and also large, being some 80–180 µm long,
8–20 µm wide, and 8–16 µm thick. This wide range of sizes reflects the com-
plex ventricular ultrastructure, which is illustrated more clearly by scanning
electron microscopy, where individual cells are seen to be most irregular in
shape (Fig. 2) with longitudinal grooves. On occasion, very flat cells are also
Fig. 2. The typical transverse ridges and longitudinal grooves of heart muscle cells,
obtained with scanning electron microscopy. Scale bar, 10 µm (magnification ×1158).
From ref. 26, with permission from Elsevier.
AFM and Cardiac Physiology 167
observed (Fig. 3A). If it were possible to fit the cells back together again, then
it becomes clear how the spiraling and horizontal bands of whole muscle (see
above) arise from the complex interdigitation of myocytes with grossly vary-
ing shapes. Also apparent in Fig. 2 are the regular transverse ridges on the
surface of each cell. These reflect the action of the underlying contractile pro-
teins, which run longitudinally within each myocyte and partially overlap, giv-
ing rise to the striated appearance of cardiac muscle, when longitudinal sections
are viewed with the electron microscope (Fig. 1, Plate 3). As will be seen
below, these general morphological features of cardiac ventricular myocytes
are apparent at magnifications comfortably achievable by AFM.
Fig. 3. (A) Scanning electron micrograph of cell having flatter profile than those
shown in Fig. 2. Scale bar, 10 µm (magnification ×1158). From ref. 26, with permis-
sion from Elsevier.
168 Davis et al.
The scalloped appearance of the surface membrane is seen in more detail in
Fig. 4A. Evident at these levels of magnification are the regular apertures in
the surface sarcolemma, the mouths of tubules dipping transversely into the
cell. These T-tubules conduct the wave of electrical depolarization traveling
across the myocyte surface down into the cell, so that contraction is triggered
synchronously throughout the cell interior during each heartbeat. These scan-
Fig. 3. (B) Large-scale deflection AFM micrograph of a single isolated cardiac
myocyte immobilized on mica substrate. Note the intercalated disc region evident on
the right-hand-side of the cell. Scale bar, 5 µm. From ref. 9, with permission from
Elsevier.
AFM and Cardiac Physiology 169
ning electron micrographs, taken on air-dried specimens of fixed myocytes,
are directly relevant to observations made by AFM (see paragraphs following
and Note 2).
Under these conditions, the surface membrane is forced down on the
underlying structures, and in Fig. 4A there are seen rectangular “packets” at
the periphery of the cell, lying along what appears to be a cylindrical struc-
ture within the cell. These packets are mitochondria, the oxidative motors in the
heart, providing the aerobic production of ATP for the contractile proteins,
which is essential for a normal mechanical output from each ventricle in the
whole organ. It follows that if scanning force microscopy is applied to
Fig. 4. (A) Scanning micrograph showing array of T-tubule openings, which have
both ovoid and circular cross-sectional geometry. Scale bar, 2 µm (magnification
×8000). From ref. 26, with permission from Elsevier.
170 Davis et al.
myocytes prepared using the same protocols, similar subsurface structures
should be apparent (see Note 3).
Figure 5 demonstrates that all the normal features of sarcolemmal structure,
including the glycocalyx, are preserved in these isolated cells. The structure
of intracellular membranes and organelles also shows excellent preservation,
indistinguishable from that reported in cells of the intact heart. A network of
tubules in the M region, the M rete (MR), is connected by longitudinal ele-
ments (L) to a z tubule (ZT
L
) seen here in longitudinal section. Examples of
transversely sectioned z tubules, seen elsewhere, are indicated by ZT
T
. Junc-
tional sarcoplasmic reticulum (JSR) is continuous with the free SR (arrow) and
consists of flattened cisternae closely apposed to the sarcolemma. Peripheral
junctional SR (JSR
p
) occurs in association with the surface sarcolemma, and
interior junctional SR (JSR
I
) occurs against transverse-tubule membrane. The
latter may take the form of dyads (D), which consist of a transverse tubule plus
one JSR cisterna, or triads (T), which consist of a transverse tubule sandwiched
Fig. 4. (B) Deflection AFM micrograph of a myocyte surface in which T-tubule
openings are indicated by arrows. Compressed between the contractile machinery are
mitochondria. Scale bar, 2 µm. From ref. 9, with permission from Elsevier.
AFM and Cardiac Physiology 171
between two JSR cisternae. The JSR lumen is characteristically bisected by an
electron-dense line, and regularly spaced electron-dense feet project from the
membrane facing the sarcolemma. Mitochondria (M) show well-preserved
membranes and cristae.
Finally, if the plasma membrane is freeze-fractured, intramembrane particles
can be observed (Fig. 6) reflecting aggregations of membrane proteins involved
in cellular function; the density of these particles in isolated myocytes is very
similar to that observed in whole hearts (Fig. 7). Note that the scale bar for
these measurements (100 nm) is approaching the range more usually associ-
ated with scanning force microscopy. Clearly, freeze-fractured membranes
would make most interesting specimens for AFM imaging. From the evidence
presented here, and from many other studies, of those myocytes surviving the
dissociation procedures, the structure of intracellular membranes and
organelles shows excellent preservation, indistinguishable from that reported
in cells of the intact heart.
Fig. 5. Electron micrograph detailing the structural complexity of the interior of
mammalian ventricular heart cells. See text for further description and abbreviations.
(magnification ×50 000). D, dyad; M, mitochondria; JSR, junctional sarcoplasmic
reticulum; JSR
p
, peripheral JSR; L, longitudinal elements; ZT
T
, transversely sectioned
Z tubules; ZL, Z line; ZT
L
, longitudinally sectioned Z tubule; ML, M line; g, glycalyx.
From ref. 26, with permission from Elsevier.
172 Davis et al.
3.2. AFM (
see
Notes 4–6)
Aliquots of myocytes (approx 100 µL of cell suspension) were added to a
freshly cleaved mica (Agar Scientific, Cambridge, UK) surface. The sample
was then gently blown dry with high purity argon or allowed to dry overnight
Fig. 6. (A) P-face view of isolated myocyte sarcolemma. (B) P-face view of myo-
cyte sarcolemma from intact left-ventricular myocardium. Scale bars 0.1 µm. Taken
From ref. 27, with permission from Elsevier.
AFM and Cardiac Physiology 173
at 5°C. Experiments were performed with a Digital Instruments MultiMode
microscope in conjunction with a Nanoscope IIIa control system. A “J” scan-
ner (with a lateral range of approximately 125 µm) was used. Etched silicon
probes, attached to triangular cantilevers 100–200 µm in length, were used
(Digital Instruments, UK Ltd, model TESP) operated at resonances in the 300–
400 KHz range (nominal force constant 20–100 N/m). Drive amplitude was
adjusted so as to give the sharpest resolution at the minimum amplitude (typi-
cally 1–2 V rms). Integral and proportional gains were balanced so as to allow
simultaneous acquisition of sharp, noise-free, height and amplitude data sets.
With the aid of a ×30 magnification eyepiece, the scanning cantilever was
positioned directly above a surface-immobilized cell (see Note 4). Because the
vertical dimensions of the cells exceed the full vertical range of the scanner
(ca. 4 µm), scanning laterally into a cell commonly led to destruction of the
probe. Vibrational/acoustic shielding was achieved by mounting the micro-
scope in a PicoIsolation chamber (Molecular Imaging Co) during scanning.
Height, amplitude and phase data were simultaneously collected, the latter with
a Digital Instruments Phase Extender Module. Data sets were subject to a first
order flattening and low band pass filtering only when stated. Thermal noise
levels were estimated to be approx 0.4 Å.
As shown in Fig. 3, whole-cell images obtained by AFM methods compare
very favorably with scanning electron micrographs. Even at this relatively low
Fig. 7. Numerical density of membrane particles (expressed as numbers per square
micrometer) for isolated myocytes and intact myocardium. From ref. 27, with permis-
sion from Elsevier.
174 Davis et al.
magnification, both the cellular cross-striations and the step-like morphology
of the intercalated disc regions are clearly evident. Fine details of the subsur-
face structure were, in general, more easily observed in deflection mode than
height mode, though imaging was somewhat sensitive to the scanning set point
and drive amplitude (equivalent to energy dissipation by the probe rather than
the imaging force directly; see Note 5). Scanning at high amplitude produced
no noticeable structural damage (though increased deformation of the plasma
membrane is likely as the drive amplitude is increased), that is, when the same
area was subsequently reimaged at lower drive no significant image deteriora-
tion was observed. The fact that cell dimensions exceeded the full vertical range
of the scanners prevented a quantification of the effect of increased dissipation
on cell height though changes in surface roughness were minimal across the
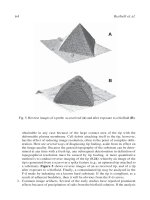
range of values used. At increased magnification, the general morphology of
working ventricular myocytes can be seen in more detail (Fig. 8). This AFM
image strikingly reveals all the major characteristics of cellular morphology
that have been discussed previously in reference to electron microscopy (see
Note 6). The parallel arrays of longitudinal contractile machinery, separated
by embedded organelles and transversed by regular tubular structures to
demarcate sarcomeres, all reflect the integrated structure to be expected of this
syncytial tissue.
The scalloped nature of the external sarcolemma, with the grooved surface
structure reflecting the underlying contractile apparatus alternating between
rows of mitochondria, is shown in Fig. 4B, which is presented with a corre-
sponding scanning electron micrograph to emphasize the remarkable similar-
ity in the two images. Z grooves, which run at right angles to the long axis of
the myofilaments, mark the sarcomeres from one Z line to the next and can be
quite deep and narrow, especially in contracted tissue. It is clear that there is a
consistent relationship between these grooves and the Z lines, suggesting
strongly that the Z line material must be attached firmly to the interior face of
the plasmalemma. Using such images, resting sarcomere length is measured as
1.6–2 µm and T-tubules of diameter 200–260 nm are present in rows at
approximately every 1.8–1.9 µm. The measured lateral spacing between T-
tubule openings (Fig. 4B) is 2–2.3 µm. These dimensions are comparable to
those reported for fixed ventricular cells.
4. Notes
1. It is clear that to exploit the many advantages that AFM imaging has to offer for
the study of heart cells, the obvious prerequisite is a preparation of stable, iso-
lated myocytes. Though more than 30 yr have elapsed since dissociation tech-
niques were first reported, this initial step remains one of the most difficult. Much
has been written about isolation protocols (see references in 24) and here we can
AFM and Cardiac Physiology 175
give only a few of the main stumbling blocks that might prevent successful disso-
ciation of heart tissue. The first very important procedure is retrograde coronary
perfusion of the whole heart. A simple alternative would be to chop the organ and
incubate the tissue chunks in the appropriate solutions, but this produces very
low yields of poor quality myocytes. Cardiac tissue is predominantly aerobic, so
any delay in excising and mounting the organ for in vitro perfusion can cause
Fig. 8. High-resolution deflection AFM micrograph of a myocyte cell surface. Lon-
gitudinal columns of underlying contractile proteins, separated by valleys having regu-
lar transverse grooves. The globular features evident (M and elsewhere) are subsurface
mitochondria. Also evident are the invaginations of the surface membrane by trans-
verse tubules. Scale bar, 2 µm. From ref. 9, with permission from Elsevier.
176 Davis et al.
irreversible damage to the constituent cells. Experience has shown that the high-
est-quality reagents should be used in the perfusion fluids (but not generally of
spectroscopic grade) made up with high quality distilled water. Ideally, the whole
dissociation protocol should be conducted in a sterile environment and the cells
stored under tissue culture conditions, but as long as standard levels of cleanli-
ness are observed, this should not be a limiting condition. Like most physiologi-
cal investigations, living tissue is very susceptible to minor changes in buffer
quality; therefore, new reagents should be screened before routine use. We, for
example, purchase enzymes and serum albumin in bulk to minimize any major
variations in myocyte quality.
2. The cells of choice should be immobilized on a flat, stable, and (ideally) optically
transparent substrate surface. This may require pretreatment of cell and/or sub-
strate surface.
3. The scanning force microscope is set up with a low spring, sharp lever and
allowed to stabilize. High-powered inverted optics are used to locate the cells
and carefully position the scanning probe above the one of choice. This is of
particular importance with very large cells, such as cardiac myocytes, as they are
typically about 8 µm thick. Tapping Probes, in particular, are expensive and eas-
ily damaged during alignment or if scanning is initiated when the tip lies to the
side of a cell.
4. Surface-dried isolated myocytes are easily visible in the bright field. The cells
become opaque and considerably more difficult to see in bright field on immer-
sion in fluid. Higher optical magnification (>500×) under such conditions is of
considerable benefit.
5. It is important that the cells be mechanically stable under the lateral forces im-
parted by the scanning probe. The worst-case scenario is when the cell is dragged
across the supporting surface as scanning starts. Several imaging modes should,
ideally, be available, for example, contact, noncontact, “tapping,” magnetic AC
(“MAC”). Each has its advantaged and disadvantages and selection should be
based on maximizing resolution at minimal cellular perturbation. Occasionally,
and especially in fluid, imaging will suddenly deteriorate as matter adsorbs to the
scanning tip. Though commonly terminal (in terms of the tips usefulness), it may
be possible to clean the probe using oxygen plasma.
6. Although surprisingly underused by physiologists and cell biologists, it is clear
that AFM imaging techniques can be adapted for a large variety of cellular stud-
ies and, in terms of three-dimensional topographic resolution, compete well with
classic scanning electron microscopy. By integrating AFM technology with com-
mercially available (or adaptable) optical microscopes (such as the Nikon TE2000
inverted) one can generate a powerful imaging and characterization system. Such
multiport systems can incorporate, rather straightforwardly, epi-fluorescence and
confocal microscopy (with electronic motorized transfer between the two) and
do not require complex set-up and alignment procedures. By integrating charac-
terization systems in this way, it should be possible to address important ques-
tions of structure–function relationships in living cellular systems or preparations.
AFM and Cardiac Physiology 177
Acknowledgments
The authors thank The Royal Society (JJD), Abbott Diagnostics, and the
EPSRC (HAOH). JJD also acknowledges The Queen’s College, Oxford for an
Extraordinary Junior Research Fellowship. TP is supported by the British Heart
Foundation.
References
1. Kasas, S., Gotzos, V., and Celio, M. R. (1993) Observation of living cells using
the atomic force microscope. Biophys. J. 64, 539–544.
2. Lehenkari, P. P., Charras, G. T., Nykanen, A., and Horton, M. A. (2000) Adapting
atomic force microscopy for cell biology. Ultramicroscopy 82, 289–195.
3. Gunning, P. A., Kirby, A. R., Parker, M. L., Gunning, A. P., and Morris, V. J.
(1996) Comparative imaging of Pseudomonas putida bacterial biofilms by scan-
ning electron microscopy and both dc contact and ac non-contact atomic force
microscopy. J. Appl. Bacteriol. 81, 276–282.
4. Zhang, P., Bai, C., Huang, Y., Zhao, H., Fang, Y., Wang, N., and Li, Q (1995)
Atomic force microscopy study of fine structures of the entire surface of red blood
cells. Scanning Microscopy 9, 981–988.
5. Siedlecki, C. A. and Marchant, R. E. (1998) Atomic force microscopy for charac-
terization of the biomaterial interface. Biomaterials 19, 441–454.
6. Barbee, K. A. (1995) Changes in surface topography in endothelial cells imaged
by atomic force microscopy. Biochem. Cell. Biol. 73, 501–505.
7. Braet, F., Seynaeve, C., de Zanger, R., and Wisse, E. (1998) Imaging surface and
submembraneous structures with the atomic force microscopy: A study on living
cancer cells, fibroblasts and macrophages. J. Microscopy 190, 328–338.
8. Canet, D., Rohr, R., Chamel, A., and Guillian, F. (1996) Atomic force micros-
copy study of isolated ivy leaf cuticles observed directly and after embedding in
Epon. New Phytol. 134, 571–577.
9. Davis, J. J., Hill, H. A. O., and Powell, T. (2001) High resolution scanning force
microscopy of cardiac myocytes. Cell Biol. Int. 25, 1271–1277.
10. Hand, G. M., Muller, D. J., Nicholson, B. J., Engel, A., and Sosinsky, G. E. (2002)
Isolation and characterization of gap junctions from tissue culture cells. J. Mol.
Biol. 315, 587–600.
11. Schar-Zammaretti, P., Ziegler, U., Forster, I., Groscurth, P., and Spichiger-Keller,
U. E. (2002) Potassium-selective atomic force microscopy on ion-releasing sub-
strates and living cells. Anal. Chem 74, 4269–4274.
12. Braunstein, D. and Spudich, A. (1994) Structure and activation dynamics of RBL-
2H3 cells observed with scanning force microscopy. Biophys. J. 66, 1717–1725.
13. Schoenberger, C. A. and Hoh, J. H., (1994) Slow cellular dynamics in MDCK and R5
cells monitored by time-lapse atomic force microscopy. Biophys. J. 67, 929–936.
14. Schauss, S. S. and Henderson, E. R. (1997) Cell viability and probe-cell mem-
brane interactions of XR1 glial cells imaged by atomic force microscopy. Biophys.
J. 73, 1205–1214.
178 Davis et al.
15. Haydon, P. G., Lartius, R., Parpura, V., and Marchese-Ragona, S. P. (1996) Mem-
brane deformation of living glial cells using atomic force microscopy. J. Micros-
copy 182, 114–120.
16. Klebe, R. J., Bentley, K. L., and Schoen, R. C. (1981) Adhesive substrates for
fibronectin. J. Cell. Physiol. 109, 481–488.
17. Butt, H. J., Wolff, E. K., Gould, S. A. C., Northern, B. D., Peterson, C. M., and
Hansma, P. K. (1990) Imaging cells with the atomic force microscope. J. Struct.
Biol. 105, 54–61.
18. Kasas, S. and Ikai, A. (1996) A method for anchoring round shaped cells for
atomic force microscope imaging. Biophys. J. 68, 1678–1680.
19. Gab, M. and Ikai, A. (1996) Method for immobilizing microbial cells on gel sur-
face for dynamic AFM studies. Biophys. J. 69, 2226–2233.
20. Yamashina, S. and Shigeno, M. (1995) Application of atomic force microscopy to
ultrastructural and histochemical studies of fixed and embedded cells. J. Electron
Microsc. 44, 462–466.
21. Zhang, Y., Sheng, S. J., and Shao, Z. (1996) Imaging biological structures with
the cryo atomic force microscope. Biophys. J. 71, 2168–2176.
22. Hoh, J. H. and Schonenberger, C. A. (1994) Surface morphology and mechanical
properties of MDCK monolayers by atomic force microscopy. J. Cell. Sci. 107,
1105–1114.
23. Domke, J., Parak, W. J., George, M., Gaub, H. E., and Radmacher, M. (1999)
Mapping the mechanical pulse of single cardiomyocytes with the atomic force
microscope. Eur. Biophys. J. Biophys Lett. 28, 179–186.
24. Powell, T., Noma, A., and Severs, N.J. (1998) Isolation and culture of adult car-
diac myocytes, in Cell Biology: A Laboratory Handbook, 2nd ed, vol. 1 (Celis, J.
E., ed). Academic Press, San Diego, CA, 1pp. 25–132:
25. Severs, N. J., Slade, A. M., Powell, T., Twist, V. W., and Warren, R. L. (1982)
Correlation of ultrastructure and function in calcium-tolerant myocytes isolated
from the adult rat heart. J. Ultrastruct. Res. 81, 222–239.
26. Powell, T., Steen, E.M., Twist, V.W., and Woolf, N. (1978) Surface characteristics
of cells isolated from adult rat myocardium. J. Mol. Cell. Cardiol. 10, 287–292.
27. Slade, A. M., Severs, N. J., Powell, T., Twist, V. W., and Jones, G. E. (1985)
Morphometric analysis of calcium-tolerant myocytes isolated from the adult rat
heart, in Advances in Myocardiology, vol. 6 (Dhalla, N. S. and Hearse D. J., eds.),
Plenum Publishing Corporation, New York, pp. 3–12.
Imaging of Bacteria Treated With Antibiotics 179
179
13
Imaging Bacterial Shape, Surface, and Appendages
Before and After Treatments With Antibiotics
Pier Carlo Braga and Davide Ricci
1. Introduction
Bacteria are typically smaller than eukaryotic cells. The average diameter of
Staphylococcus aureus is 1 ± 0.5 µm, whereas Escherichia coli is on average
0.5 × 1.5 µm. The bacterial cell is also characterized by the presence of a com-
plex external rigid structure called cell wall, which protects the internal proto-
plast and gives also the cellular shape, that generally falls into one of the, three
basic morphologic categories, spherical (cocci), rod-shaped (bacilli), and spi-
ral. Some bacteria show an atypical bacterial shape.
Bacteria are also able to extrude some material that collects outside the cell
wall to form an additional, surface layer. Many genera of bacteria possess also
filamentous structures projecting through the cell wall to form the so-called
surface appendages. The most commonly observed bacterial appendages are
flagella, fimbriae or pili, and filaments.
Antibiotics are particular type of drugs able to interfere in different ways to
the metabolic pathways of bacteria. This causes also changes directly or indi-
rectly in the structure of cell wall and consequent alterations in the shape of
bacteria. The integrity of cell wall and bacterial shape are important to main-
tain the vitality and the virulence of bacteria. Morphostructural alterations not
only cause bacteria to loose cytoplasm but also to be more easily phagocytized
and killed by human phagocytic cells. A large amount of basic and clinical
researches in microbiology, chemotherapy, and infectious diseases have been
performed to investigate the morphology and structure of bacteria. These stud-
ies have been previously conducted by means of optical microscopy and scan-
ning electron microscopy (SEM).
From:
Methods in Molecular Biology, vol. 242: Atomic Force Microscopy: Biomedical Methods and Applications
Edited by: P. C. Braga and D. Ricci © Humana Press Inc., Totowa, NJ
180 Braga and Ricci
Optical and scanning (or transmission) electron microscopes are classified
as far-field microscopes because the distance between the sample and the point
at which the image is obtained is long in comparison with the wavelengths of
the photons or electrons involved. In this case, the image is a diffraction pat-
tern and its resolution is wavelength limited (1,2): in optical microscopy, reso-
lution is determined by the Nyquist relation to the wavelength of the light used
(typically about 1 µm); in a general purpose SEM, it is limited by the proper-
ties of the electromagnetic lenses (typically about 50 Å; ref. 3).
In 1986, a completely new type of microscopy was proposed: without lenses,
photons, or electrons, it involved the mechanical scanning of samples (4) and
opened up unexpected possibilities for the surface analysis of biological speci-
mens. Initially called the scanning force microscope (SFM), it was a develop-
ment of the previous scanning tunneling microscope (5), which provided
information at atomic resolution of specimens that are electrically conducing.
Because SFMs involve interactions between atomic forces (about 10
–9
New-
ton), they are also and more frequently called atomic force microscopes (AFMs;
ref. 3).
These new types of scanning probe microscopes (SPMs) are based on the
concept of near-field microscopy, which overcomes the problem of the limited
diffraction-related resolution inherent in conventional microscopes. Located
in the immediate vicinity of the sample itself (usually within a few nanom-
eters), the probe records the intensity and not the interference signal, and this
greatly improves resolution (1).
As shown in Fig. 1, AFM explores the surface of a sample not by means of
a system of lenses that form an image using the diffraction patterns of rays of
different wavelengths but by means of a very small sharp-tipped probe located
at the free end of a cantilever driven by the interatomic repulsive or attractive
forces (van der Waals forces) between the molecules at the probe tip and those
on the surface of the specimen. This can be done by scanning the sample later-
ally (x, y) while a closed loop control system keeps the tip in proximity to the
surface by adjusting the z position of the sample. In most AFMs, tip move-
ments are monitored by reflecting a laser beam from the back of the cantilever
on to a position-sensitive photodiode (6).
AFM is extremely useful for analyzing the three-dimensional structure of
the surface of biological specimens, particularly bacteria. Although SEM is
still frequently used, the introduction of the AFM technique offers substantial
benefits in real quantitative data acquisition in three dimensions, minimal
sample preparation times, flexibility in ambient operating conditions (i.e., no
vacuum is necessary), and effective three-dimensional magnification at the
submicron level (7,8).
Imaging of Bacteria Treated With Antibiotics 181
Fig. 1. Comparative schematic view of the elements characterizing light micros-
copy, scanning electron microscopy, and atomic force microscopy, together with their
specific technical parameters.
182 Braga and Ricci
To investigate the shape and the surface of bacteria offers the possibility of
investigating the efficacy and the mechanism of action of antibiotics that dis-
rupt this structure as an epiphenomenon of internal biochemical action (9–13)
and at the same time the possibility of investigating their lack of activity, as in
the case of resistance.
2. Materials
1. Test organisms. Both Gram-positive and Gram-negative bacteria are suitable
for AFM.
2. Tryptic soy broth or other suitable medium.
3. Phosphate buffer saline (PBS): 0.02 M phosphate and 0.15 M NaCl, pH 7.3.
4. Glutaraldehyde: 2.5%.in 0.1 M cacodylate buffer, pH 7.0.
5. Graded alcohols (60, 70, 80, 90, and 100%).
6. Incubator.
7. Centrifuge.
8. Micropipette and sterilized disposables for culturing bacteria.
9. Round glass coverslides, diameter 6–7 mm (or mica).
10. AFM (including probe-tips, software for processing signals and three-dimen-
sional rendering, and computer).
3. Methods
1. Prepare the cultures of chosen microorganism according to common standard
procedures.
2. Wash the test microorganism from the suspension in broth (i.e., 10
6
cells/mL)
three times with PBS.
3. Resuspend the final pellet in 1–2 mL of PBS.
4. Collect 0.1 mL (or less) of this suspended bacteria with a micropipet and place it
on round glass coverslide (see Note 1).
5. Dry the coverslip in air.
6. Fix with 2.5% glutaraldehyde in 0.1 M cacodylate buffer (pH 7.1).
7. Dehydrate in graded alcohols.
8. Dry the coverslip in air (see Note 2).
9. Repeat steps 1–8, incubating bacteria with various supra-minimum inhibitory
concentrations (MICs) or sub-MICs of antibiotic.
10. AFM observation (see Notes 3 and 4). A typical AFM imaging session begins by
firmly fixing the sample cover slide to the microscope holder to avoid even the
slightest movement (see Note 5) and then positioning it under the probe tip and
locating the area of interest by moving the x–y table.
11. A good-quality on-axis optical microscope is essential to be able to position the
probe tip in the proximity of a bacterium to be imaged by AFM. Because bacteria
are about 1 µm in size, it is necessary to have appropriate lighting conditions to
distinguish them from any debris on the slide surface. In the experiments
described here, a reflection optical microscope equipped with long-range objec-
Imaging of Bacteria Treated With Antibiotics 183
tives was used. Although the cantilever bearing the probe partially obstructs the
optical view of the underlying bacteria, it does allow the probe to be positioned
sufficiently accurately in the area of interest (see Notes 6 and 7). Commercial AFM
instrumentation coupled to a transmitted light optical microscope offers a higher
degree of precision in the first approach of the probe to the sample (see Note 8).
12. Once an area has been located after the tip-to-sample approach, a first large scan
(i.e., 30 × 30 µm) using a high scan speed and small number of pixels per line can
be made in order to assess its exact position within the scanner coordinate sys-
tem, identify the nature of the bacteria and select an interesting one. Further
smaller scans may be necessary in order to position the bacterium exactly at the
centre of the scanning area.
13. Record high-resolution images (see Note 6) by using appropriate instrument set-
tings depending on the imaging mode selected (contact, intermittent contact, non-
contact; see Note 7). In general, accurate feedback setting is necessary to obtain
the maximum possible gain for the resolution of bacterial surface structures while
avoiding oscillation when scanning along the cell sidewalls (see Note 2).
14. Acquire image (typically acquired at 512 × 512 pixels) and process by means of
plane fitting, high-frequency filtering, and three-dimensional-shaded rendering
(Figs 2 and 3).
15. Postprocessing analysis and the spatial representation of AFM-generated data
are essential to extract all of the available information from the image dataset.
Because the recorded data are an intrinsically three-dimensional digital matrix
(the height of the sample recorded at each x, y coordinate), the software makes it
easy to obtain numerical data of cross-sections of interesting features expressed
with sub-nanometer accuracy (see Note 8). The same software allows three-
dimensional rendering of the surface and rotation in space so that only one acqui-
sition is needed to be able to observe the same object from many different points
of view (see Notes 9–11).
4. Notes
1. It is better to use low concentrations of bacteria because they tend to concentrate in
small areas during the air-drying phase, whereas a single bacterium provides a
clearer image. Be sure to mark the location of your specimen on the upper surface
of your round glass coverslide to avoid wasting time investigating the wrong side.
2. If the sample is kept dry, repeated sessions could generally be performed without
any loss of resolution.
3. Bacterial sample preparation for AFM is very simple and rapid. There is no need
for critical point drying, which also avoids shrinkage effects; there is no need for
gold sputtering, a procedure that covers and smooths fine surface details. There
is no need for vacuum conditions, as with SEM.
4. A recent technical evolution has also opened up the possibility of using AFM on
wet samples, that is, living cells immersed in biological fluids in culture cham-
bers (14,15).