Atomic Force Microscopy in Cell Biology Episode 1 Part 4 docx
Bạn đang xem bản rút gọn của tài liệu. Xem và tải ngay bản đầy đủ của tài liệu tại đây (576.17 KB, 20 trang )
46 Jena and Cho
Fig. 10 Schematic representation of total fusion (A) where secretory vesicle membranes are completely
incorporated with the plasma membrane and transient fusion (B) of secretory vesicles at specific sites (de-
pressions) of the cell plasma membrane to release vesicular contents to the cell exterior during exocytosis.
Reproduced with permission from Jena, B. P. (1997). Exocytic fusion: Total or transient? Cell. Biol. Int. 21(5),
257–259.
fusion would requirethe cellto expend much more energy thantransient fusion(Fig. 10B).
In fact, there is little evidence to support total fusion. Studies using transmission electron
microscopy (TEM) rarely show the total incorporation of secretory vesicle membrane at
the cell plasma membrane. On the contrary, the majority of the TEM studies demonstrate
that following stimulation of secretion, there is an enriched presence of several intact but
empty or partially empty secretory vesicles within cells (Lawson et al., 1975). Similar
changes are also identifiable in the pancreas and parotid exocrine cell of rats (Jamieson,
1972). Fast freeze-fracture EM studies on mast cells (Chandler and Heuser, 1980) show
that, even after fusion of the vesicle membrane at the cell plasma membrane, much of the
2. AFM, Cellular Structure–Function Studies 47
granule membrane is present and well separated from the plasma membrane (Chandler
and Heuser, 1980). Electrophysiological studies in mast cells (Alvarez de Toledo et al.,
1993; Monck et al., 1995) as well as in adrenal chromaffin cells (Chow et al., 1992)
suggest that the fusion pores either irreversibly expand (total fusion) or close following
stimulation of secretion (transient fusion). Quantitative electron microscopy on stimu-
lated and resting bovine chromaffin cells demonstrates no significant change following
stimulation of secretion, in the number of peripheral densecore vesicles (Plattner et al.,
1997). An increase followed by a decrease in plasma membrane capacitance suggests
that vesicles transiently fuse and dissociate. Alternately, the step increase in membrane
capacitance is interpreted as evidence of total vesicle fusion. The step increase observed
could result from secretory vesicles undergoing transient fusion at the plasma membrane,
and before they dissociate, others fuse, causing a step increase in membrane capacitance.
The capacitance measurements in a slow secretory cell such as the pancreatic acinar cell
in either mice (Maruyama and Petersen, 1994), or rats (personal observation) demon-
strate the occurrence of only transient fusions following stimulation of secretion. In fast
secretory cells like neurons or mast cells, the number of secretory vesicles fusing at the
plasma membrane at one time is far greater than that in pancreatic acinar cells. There-
fore, the possibility of encountering a step increase in membrane capacitance is greater
in mast cells or neurons. Due to the rapid fusion of secretory vesicles at the presynaptic
membrane of a neuron, the rapid and selective retrieval of vesicle membrane would be a
requirement. Since time and energy are critical factors, it would be efficient for such fast
secretory cells (neurons or neuroendocrine cells) to exocytose via the transient mecha-
nism of vesicle fusion. If total fusion at the presynaptic membrane were the case, what
use do neurotransmitter transporters have in the synaptic vesicle membrane? Similarly,
none of the secretory vesicle-associated proteins implicated in exocytosis (Rothman,
1992), have been confirmed to incorporate at the cell plasma membrane following stim-
ulation of secretion. In our AFM studies (Schneider et al., 1997) a 35% increase in the
diameter and a 25–50% increase in the depth of depressions are observed during exocy-
tosis. If secretory vesicles were to fuse completely at depressions, these structures would
have dilated much more than what was observed. Since zymogen granules measure
0.2–1.2 μm in diameter, their total fusion at the cell plasma membrane would obliterate
depressions. Based on these findings and supporting evidence, the transient fusion of
secretory vesicles at the plasma membrane occurs at depressions in pancreatic acinar
cells during exocytosis. Total fusion may occur when plasma membrane receptors, signal
transducing molecules, transporters, or ion channels are required to be incorporated at
the cell plasma membrane or when the plasma membrane undergoes recycling.
V. Future of AFM in the Study of Live Cells
Although much progress in AFM research has been achieved due to the optimization
of sample preparation (Shao et al., 2000; Linder et al., 1999), delicate image acquisi-
tion software (M¨oller et al., 1999; M¨uller et al., 1999; Vie et al., 2000) and continuous
developments in instrumentation (Lehenkari et al., 2000) are required. Soft and elastic
48 Jena and Cho
properties of a live cell surface still remain as major hurdles in obtaining atomic or
even angstrom resolution images. The development of highly flexible cantilever springs,
extremely sensitive in the contact mode of AFM operation, combined with fine yet less
damaging and nonsticky probes will greatly alleviate major problems in AFM studies
on live cells. Although current technology precludes such high-resolution imaging of
living cells by the AFM, the AFM in combination with excellent optics and electro-
physiological measurements has and will greatly enhance our understanding of cellular
structure–function. Additionally, functionalized scanning probes have recently enabled
us for the first time to understand the secretion, interaction, and the biophysical and
biochemical properties of molecules at the surface of live cells. These multicapabilities
of the AFM will certainly be exploited further in the studies of living cells, bringing our
understanding of cellular structure and function to a new dimension. The full potential,
however, of the AFM on examining the structure–function of live cells has yet to be
realized.
Acknowledgments
This study was supported by grants from the National Institute of Health (BPJ).
References
Albrecht, T. H., Akamine, S., Carver, T. E., and Quate, C. F. (1990). Microfabrication of cantilever styli for
the atomic force microscope. J. Vac. Sci. Technol. A8, 3386–3396.
Alexander, S., Hellemans, L., Marti, O., Schneir, J., Elings, V., and Hansma, P. K. (1989). An atomic resolution
atomic force microscope implemented using an optical lever. J. Appl. Phys. 65, 164–167.
Alvarez de Toledo, G., Fern´andez-Chac´on, R., and Fernandez, J. M. (1993). Release of secretory products
during transient vesicle fusion. Nature 363, 554–558.
Binnig, G., Quate, C. F., and Gerber, Ch. (1986). Atomic force microscope. Phys. Rev. Lett. 56, 930–933.
Binnig, G., and Smith, D. P. F. (1986). Single-tube three-dimensional scanner for scanning tunneling
microscopy. Rev. Sci. Instrum. 57(8), 1688–1689.
Braet, F., Seynaeve, C., De Zanger, R., and Wisse, E. (1998). Imaging surface and submembranous structures
with the atomic force microscope: a study on living cancer cells, fibroblasts and macrophages. J. Microsc.
190(Pt 3), 328–38.
Chandler, D. E., and Heuser, J. E. (1980). Arrest of membrane fusion events in mast cells by quick-freezing.
J. Cell Biol. 86, 666–674.
Chow, R. H., von R¨uden, R., and Neher, E. (1992). Delay in vesicle fusion revealed by electrochemical
monitoring of single secretory events in adrenal chromaffin cells. Nature 356, 60–63.
Danker, T., and Oberleithner, H. (2000). Nuclear pore function viewed with atomic force microscopy. Pfluegers
Arch. 439(6), 671–81.
Domke, J., Dannohl, S., Parak, W. J., Muller, O., Aicher, W. K., and Radmacher, M. (2000). Substratedependent
differences in morphology and elasticity of living osteoblasts investigated by atomic force microscopy.
Colloids Surf. B, Biointerfaces 19(4), 367–379.
Dufrene, Y. F., Boonaert, C. J., Gerin, P. A., Asther, M., and Rouxhet, P. G. (1999). Direct probing of the
surface ultrastructure and molecular interactions of dormant and germinating spores of Phanerochaete
chrysosporium. J. Bacteriol. 181(17), 5350–5254.
Fritz, M., Radmacher, M., and Gaub, H. E. (1994). Granula motion and membrane spreading during activation
of human platelets imaged by atomic force microscopy. Biophys. J. 66, 1328–1334.
Gad, A., and Ikai, A. (1995). Method for immobilizing microbial cells on gel surface for dynamic AFM studies.
Biophys. J. 69, 2226–2233.
2. AFM, Cellular Structure–Function Studies 49
H¨aberle, W., H¨orber, J. K. H., Ohnesorge, F., Smith, D. P. E., and Binnig, G. (1992). In situ investigation of
single living cell infected by viruses. Ultramicroscopy 42–44, 1161–1167.
Henderson, E., Haydon, P. G., and Sakaguchi, D. S. (1992). Actin filament dynamics in living glial cells imaged
by atomic force microscopy. Science 257, 1944–1946.
Hoh, J. H., and Hansma, P. K. (1992). Atomic force microscopy for high-resolution imaging in cell biology.
Trends Cell Biol. 2, 208–213.
Hoh, J. H., and Schoenenberger, C. A. (1994). Slow cellular dynamics in MDCK and R5 cells monitored by
time-lapse atomic force microscopy. Biophys. J. 67, 929–936.
H¨orber, J. K. H., H¨aberle, W., Ohnesorge, F., Binnig, G., Liebich, H. G., Czerny, C. P., Mahnel, H., and
Mayr, A. (1992). Investigation of living cells in the nanometer regime with the scanning force microscope.
Scanning Microsc. 6, 919–930.
Jamieson, J. D. (1972). Transport and discharge of exportable proteins in pancreatic exocrine cells: In vitro
studies. In “Current Topics in Membranes and Transport” (F. Bronner and A. Kleinzeller, eds.), pp. 273–338.
Academic Press, New York/London.
Jena, B. P. (1997). Exocytotic fusion: Total or transient? Cell. Biol. Int. 21(5), 257–259.
Jena, B. P., Schneider, S. W., Geibel, J. P., and Sritharan, K. C. (unpublished).
Jena, B. P., Schneider, S. W., Geibel, J. P., Webster, P., Oberleithner, H., and Sritharan, K. C. (1997).
Gi regulation of secretory vesicle swelling examined by atomic force microscopy. Proc. Natl. Acad. Sci.
U.S.A. 94(24), 13,317–13,322.
Kasas, S., Gotzos, V., and Celio, M. R. (1993). Observation of living cells using the atomic force microscope.
Biophys. J. 64, 539–544.
Lal, R., Drake, B., Blumberg, D., Saner, D. R., Hansma, P. K., and Feinstein, S. C. (1995). Imaging real-
time neurite outgrowth and cytoskeletal reorganization with an atomic force microscope. Cell Physiol. 38,
C275–C285.
Langer, M. G., Koitschev, A., Haase, H., Rexhausen, U., H¨orber, J. K. H., and Ruppersberg, J. P. (2000).
Mechanical stimulation of individual stereocilia of living cochlear hair cells by atomic force microscopy.
Ultramicroscopy 82(1–4), 269–78.
Langer, M. G.,
¨
Offner, W., Wittmann, H., Fl¨osser, H., Schaar, H., H¨aberle, W., Pralle, A., Ruppersberg,
J. P., and H¨orber, J. K. H. (1997). A scanning force microscope for simultaneous force and patch-clamp
measurements on living cell tissues. Rev. Sci. Instr. 68(6), 2583–2590.
Lawson, D., Fewtrell, C., Gomperts, B., and Raff, M. C. (1975). Anti-immunoglobulin-induced histamine
secretion by rat peritoneal mast cells studied by immunoferritin electron microscopy. J. Exp. Med. 142,
391–401.
Le Grimellec, C., Lesniewska, E., Giocondi, M. C., Finot, E., Vie, V., and Goudonnet, J. P. (1998). Imaging
of the surface of living cells by low-force contact-mode atomic force microscopy. Biophys. J. 75(2), 695–
703.
Lehenkari, P. P., Charras, G. T., Nykanen, A., and Horton, M. A. (2000). Adapting atomic force microscopy
for cell biology. Ultramicroscopy 82(1–4), 289–295.
Linder, A., Weiland, U., and Apell, H. J. (1999). Novel polymer substrates for SFM investigations of living
cells, biological membranes, and proteins. J. Struct. Biol. 126(1), 16–26.
Maruyama, Y., and Petersen, O. H. (1994). Delay in granular fusion evoked by repetitive cytosolic Ca
2+
spikes
in mouse pancreatic acinar cells. Cell Calcium 16, 419–430.
Meyer, E. (1992). Atomic force microscopy. Prog. Surf. Sci. (UK) 41, 3–49.
M¨oller, C., Allen, M., Elings, V., Engel, A., and M¨uller, D. J. (1999). Tapping-mode atomic force microscopy
produces faithful high-resolution images of protein surfaces. Biophys. J. 77(2), 1150–1158.
Monck, J. R., Oberhauser, A. F., and Fernandez, J. M. (1995). The exocytotic fusion pore interface: a model
of the site of neurotransmitter release. Mol. Membr. Biol. 12, 151–156.
M¨uller, D. J., Fotiadis, D., Scheuring, S., M¨uller, S. A., and Engel, A. (1999). Electrostatically balanced
subnanometer imaging of biological specimens by atomic force microscope. Biophys. J. 76(2), 1101–1111.
Nagayama, S., Morimoto, M., Kawabata, K., Fujito, Y., Ogura, S., Abe, K., Ushiki, T., and Ito, E. (1996).
AFM observation of three-dimensional fine structural changes in living neurons. Bioimages 4, 111–116.
Oberleithner, H., Giebisch, G., and Geibel, J. (1993). Imaging the lamellipodium of migrating epithelial cells
in vivo by atomic force microscope. Pfluegers Arch. 425, 506–510.
50 Jena and Cho
Ohnesorge, F. M., Horber, J. K., Haberle, W., Czerny, C. P., Smith, D. P., and Binnig, G. (1997). AFM review
study on pox viruses and living cells. Biophys. J. 73(4), 2183–2194.
Parpura, V., Haydon, P. G., and Henderson, E. (1993). Three-dimensional imaging of living neurons and glia
with the atomic force microscope. J. Cell Sci. 104, 427–432.
Plattner, H., Artalejo, A. R., and Neher, E. (1997). Ultrastructural organization of bovine chromaffin cell
cortex-analysis by cryofixation and morphometry of aspects pertinent to exocytosis. J. Cell Biol. 139(7),
1709–1717.
Pralle, A., Prummer, M., Florin, E L., Stelzer, E. H. K., and H¨orber, J. K. H. (1999). Three-dimensional high-
resolution particle tracking for optical tweezers by forward scattered light. Microsc. Res. Technol. 44(5),
378–386.
Quinn, A. S., Taatjes, D. J., and Jena, B. P. (unpublished).
Radmacher, M. (1997). Measuring the elastic properties of biological samples with the atomic force micro-
scope. IEEE Eng. Med. Biol. 16, 47–53.
Radmacher, M., Fritz, M., and Hansma, P. K. (1995). Imaging soft samples with the atomic force microscope:
Gelatin in water and proponal. Biophys. J. 69, 264–270.
Rothman, J. E. (1992). Mechanism of intracellular transport. Nature 355, 409–415.
Rotsch, C., Jacobson, K., and Radmacher, M. (1999). Dimensional and mechanical dynamics of active and
stable edges in motile fibroblasts investigated by using atomic force microscopy. Proc. Natl. Acad. Sci.
U.S.A. 96(3), 921–926.
Rugard, D., and Hansma, P. (1990). Atomic force microscopy. Physics Today 43, 23–30.
Schneider, S. W., Pagel, P., Rotsch, C., Danker, T., Oberleithner, H., Radmacher, M., and Schwab, A. (2000).
Volume dynamics in migrating epithelial cells measured with atomic force microscopy. Pfluegers Arch.
439(3), 297–303.
Schneider, S. W., Sritharan, K. C., Geibel, J. P., Oberleithner, H., and Jena, B. P. (1997). Surface dynamics
in living acinar cells imaged by atomic force microscopy: Identification of plasma membrane structures
involved in exocytosis. Proc. Natl. Acad. Sci. U.S.A. 94, 316–321.
Schoenenberger, C. A., and Hoh, J. H. (1994). Slow cellular dynamics in MDCK and R5 cells monitored by
time-lapse atomic force microscopy. Biophys. J. 67(2), 929–936.
Shao, Z., Shi, D., and Somlyo, A. V. (2000). Cryoatomic force microscopy of filamentous actin. Biophys. J.
78(2), 950–958.
Spudich, A., and Braunstein, D. (1995). Large secretory structures at the cell surface imaged with scanning
force microscopy. Proc. Natl. Acad. Sci. U.S.A. 92, 6976–6980.
Taatjes, D. J., Quinn, A. S., Lewis, M. R., and Bovill, E. G. (1999). Quality assessment of atomic force
microscopy probes by scanning electron microscopy: Correlation of tip structure with rendered images.
Micro. Res. Tech. 44(5), 312–326.
Tojima, T., Yamane, Y., Takagi, H., Takeshita, T., Sugiyama, T., Haga, H., Kawabata, K., Ushiki, T., Abe,
K., Yoshioka, T., and Ito, E. (2000). Three-dimensional characterization of interior structures of exocytotic
apertures of nerve cells using atomic force microscopy. Neuroscience 101(2), 471–481.
Vie, V., Giocondi, M. C., Lesniewska, E., Finot, E., Goudonnet, J. P., and Le Grimellec, C. (2000). Tapping-
mode atomic force microscopy on intact cells: optimal adjustment of tapping conditions by using the
deflection signal. Ultramicroscopy 82(1–4), 279–288.
Weissmuller, G., Garcia-Abreu, J., Mascarello Bisch, P., Moura Neto, V., and Cavalcante, L. A. (2000). Glial
cells with differential neurite growth-modulating properties probed by atomic force microscopy. Neurosci.
Res. 38(2), 217–20.
You, H. X., Lau, J. M., Zhang, S., and Yu, L. (2000). Atomic force microscopy imaging of living cells: a
preliminary study of the disruptive effect of the cantilever tip on cell morphology. Ultramicroscopy 82(1–4),
297–305.
CHAPTER 3
Atomic Force Microscope Imaging
of Cells and Membranes
Eric Lesniewska,
∗
Pierre Emmanuel Milhiet,
†
,
‡
Marie-C´ecile Giocondi,
‡
and Christian Le Grimellec
‡
∗
Laboratory of Physics, National Center for Scientific Research, URA 5027
UFR Sciences et Techniques
21078 Dijon Cedex, France
†
Laboratory CRRET
Universit
´
e Paris 12
94000 Cr
´
eteil Cedex, France
‡
Center of Str uctural Biochemistry
French National Institute for Health and Medical Research, U414
34090 Montpellier Cedex, France
I. Introduction
II. AFM Equipment
III. AFM Operating Modes
IV. Requirements for the Imaging of Intact Cells
A. Cell Immobilization
B. Scanning Forces
C. Cell Viability
V. Imaging of Cells
A. Contact Mode
B. Oscillating Mode
C. Actual Possibilities and Limits
VI. Imaging of Isolated Membranes
VII. Conclusion and Per spectives
References
METHODS IN CELL BIOLOGY, VOL. 68
Copyright 2002, Elsevier Science (USA). All rights reserved.
0091-679X/02 $35.00
51
52 Eric Lesniewska et al.
I. Introduction
Because of the plasma membrane’s fundamental role in nature, i.e., no membrane
no cell, and in the relationships between a living cell and its environment, including
the supply of nutrients and the necessary transmission of signals needed for the various
adaptation processes, the knowledge of both cell membrane and cell-surface organiza-
tions remains a major goal in biology. Numerous techniques and methods, from physio-
pathological studies to X-rays and neutron diffraction, have been developed or used to
better define the structural dynamic arrangement of molecules in membranes. Biologi-
cal membranes are now modeled as two-dimensional structures essentially composed
of lipids and proteins organized in domains (Jacobson et al., 1995; Simons and Ikonen,
1997). Sugar residues, most often covalently linked to the lipid polar headgroups and to
peptidic chains exposed at the cell/liquid medium external interface, and cytoskeleton
elements are the other partners involved in the plasma membrane organization.
The atomic force microscope (AFM), which can obtain the highest resolution images
of surfaces in aqueous medium, has recently attracted the interest of cell and membrane
biologists (Radmacher et al., 1992). As reported 10 years ago, AFM imaging of RBC
examined in liquid medium strongly suggested that this new approach could provide
topological information on the imaging of both cell surface and membrane structures
at a significantly higher resolution than the optical microscope (Butt et al., 1990). This
approach is now established, although the highest lateral resolution that can be obtained
remains a matter of debate. Topographical images of eukaryotic, prokaryotic, plant cell
surfaces, and isolated membranes were published and revealed structural details that
could not be detected by other approaches, thus presenting the AFM as a potent addi-
tionnal tool for the biologist.
The principle of the AFM, which consists in raster scanning a surface with a tip of
finite size, imposes constraints on the type of material that can be examined. For instance,
the AFM does not perform imaging of cells in suspension. Due to the very soft nature
of biological material, particular attention must also be paid to not only the sample
preparation but also the adjustment of experimental conditions. This chapter aims to
provide a practical basis for the imaging of cells and membranes by the AFM.
II. AFM Equipment
Most of the commercial equipment currently used in physics and chemistry depart-
ments is suited to image cells and membranes and must be equipped with a liquid cell for
the work in aqueous medium and, if possible, with the accessories necessary for scanning
in an oscillating mode. Stand-alone AFMs coupled to an inverted optical microscope
are also available. For heterogeneous or dispersed samples, such as nonconfluent cell
cultures or membrane preparations, stand-alone AFMs offer the advantage of allowing
the selection, by either morphological criteria or by the use of fluorescent markers, of the
zone to be probed rather than probing at random. A generally slightly decreased stability
and resolution are the consequences. So far, practically all the biological applications of
3. AFM Imaging of Cells and Membranes 53
the AFM have been conducted at room temperature, but temperature-controlled stages
are presently being proposed by different companies.
III. AFM Operating Modes
The essential difference between the physicochemical, and the biological applications
of the AFM is the constraint imposed by the softness and the fragility of the samples. The
modes of operation are identical, i.e., contact and oscillating modes. These modes have
been described in detail in other chapters of this book and will be only briefly discussed
here. The principle of the AFM is based on the measurement of the repulsive (hard sphere)
or attractive (van der Waals) interaction forces between the atom(s) at the extremity of a
fine tip and the atom(s) at the sample surface (Binnig et al., 1986). In the contact mode,
the user fixes the value of the repulsive force between the tip and the sample which will
be maintained constant during the raster scan of the sample, providing an isoforce image
of the surface. Theoretically, the tip extremity and the sample remain in contact during
scanning. In the oscillating mode, the tip oscillates at a high frequency, determined by
the cantilever spring constant, and interacts with the surface only at the lower end of each
cycle. When the interaction involves atomic repulsion (Putman et al., 1992) the mode
is usually called the tapping mode (Digital Instruments, Santa Barbara, CA). The main
advantage of this mode, as compared to the contact mode, resides in a marked reduction of
the friction forces during scanning. Biological applications of the oscillating noncontact
mode, which is based on the use of attractive interactions, remain to be established.
IV. Requirements for the Imaging of Intact Cells
By imaging intact cells we mean imaging cells, living or fixed, in their natural en-
vironment, which is essentially aqueous for eukaryotes. The requirements for imaging
under liquid are the same for cells and isolated membranes.
A. Cell Immobilization
The first requirement for cell imaging is general and applies to all categories of sam-
ples: by principle, the AFM can only image material which adheres or is fixed to a
support. Thus, cells or membranes in suspension would be pushed away by the scanning
tip and could not be imaged by this technique. Trapping of cells like red blood cells
or bacteria in pores of filters can allow their immobilization and provide access to the
AFM imaging of their upper exposed surface (Kasas and Ikai, 1995). Upon settling, cells
in suspension can also spontaneously adhere to the surface of glass coverslips or mica.
The well-known recipe among cell biologists which consists of coating a glass coverslip
with positively charged material like polylysine can also help in attaching cells to a
flat surface. A very elegant way to immobilize cells for AFM examination is by using
micropipettes. An adapted, home-built AFM must, however, be used in conjunction with
54 Eric Lesniewska et al.
Fig. 1 Contact mode AFM imaging of corneal tissue in liquid medium. (A) Corneal epithelial surface of
adult albino rabbit. (B) Collagen fibrils of corneal stroma arranged in bundles after mechanical ablation.
the micropipette holder (H¨orber et al., 1995). Fortunately, a large number of cell types
can be grown directly either on glass coverslips or on plasticware treated by a Bunsen
burner flame which markedly reduces the plastic surface corrugations (Thimonier et al.,
1997). Before placing a cell preparation under the AFM, a good test to run consists of
rinsing the preparation several times with medium or buffer and then, by using an optical
microscope, checking whether the cells are still attached to their substrate. Recently, flat
pieces of fresh tissues were examined by the AFM (Fig. 1) (Tsilimbaris et al., 2000).
Such experiments were made possible by gluing the tissue pieces directly to the AFM
magnetic disks. Firm fixation of the glass coverslips or plastic or filter supports used for
cell immobilization onto the magnetic disks is also of crucial importance. For cells or
membranes adsorbed on glass coverslips, after drying the bottom of the support, we use
cyanoacrylate glue which resists to long exposure to aqueous medium. The stability of
the imaging on stand-alone equipment can also be improved by screwing a teflon ring
to the round glass coverslips used as a support on the inverted microscope stage.
B. Scanning Forces
The second requirement is using imaging forces, as low as possible, to avoid damaging
the soft cell structures. Thermal fluctuation experienced by a free cantilever provides a
first indication about the lower limit of the imaging forces. Considering the cantilever
as an uncompressed spring, thermal fluctuation results in spontaneous tip movements
whose amplitude can be estimated using (Shao et al., 1996)
= (k
B
T/k)
1/2
,
where k
B
is the Boltzmann constant (1.38 × 10
−23
J/K), T is the temperature in Kelvin,
and k is the cantilever spring constant (N/m). Fluctuation amplitudes and the
3. AFM Imaging of Cells and Membranes 55
Table I
Thermal Fluctuation, Uncertainties, and Signal-to-Noise Ratio of
Soft Cantilevers
a
Spring constant Thermal fluctuation
˚
A Force determination uncertainty Signal/noise
(N/m) (equivalent force, pN) pN (for 50-pN force) (for 50-pN force)
0.01 6.4 0.4 126
(6.4)
0.03 3.7 1.2 42
(11.1)
0.06 2.6 2.4 21
(15.6)
0.10 2.0 4.0 12.5
(20.0)
0.36 1.1 14.4 3.5
(39.6)
a
Calculated from Shao et al. (1996).
corresponding force noise at room temperature (20
◦
C) for the cantilevers com-
monly used in contact mode imaging under aqueous medium are given in Table I. These
amplitudes vary from 6.4 to 1.1
˚
A for cantilevers with spring constants between 0.01 and
0.36 N/m. The equivalent forces, F, are 6.4 and 39 pN, respectively (F = k). Thus,
the use of softer cantilevers markedly reduces the limiting value of the scanning forces,
which must be larger than that of the thermal fluctuations. Fluctuations are reduced, as
a function of the force applied, once the tip is in contact with the surface, according to
c
= (k
B
T )/2F,
where
c
is the amplitude of the fluctuation of the tip position in contact, and F is
the force applied. For instance, applying a force of 20 pN to a 0.01 N/m cantilever,
corresponding to a 2-nm deflection of the tip position, results in a decrease in fluctuation
from 6.4 to 1.0
˚
A; i.e., the spontaneous fluctuation is 1/20 of the imposed deflection
value. This value of 20 pN is close to the limiting value for imaging reported in the
literature (Le Grimellec et al., 1998). It must be mentionned that, due to the drift of
piezo-electric elements, maintaining a constant imaging value below 100 pN requires
the readjustment of the tension applied to the z element during imaging. The use of
radiation pressure brought by a second laser acting on the cantilever, associated with very
low spring constant homemade cantilevers, has been reported to decrease the limiting
imaging force to values below 1 pN (Tokunaga et al., 1997).
Adjustment of the scanning force via the force versus distance curves to the lowest
accessible value, prior to cell imaging, is the first step to avoiding cell damage and im-
plies that both the spring constant of the cantilever and the sensitivity of the detection of
the AFM tip response to a known vertical displacement must be, at least approximately,
known before imaging. Sensitivity to vertical displacement is simply obtained by force
versus distance curves, under the liquid medium, on regions of the support (glass, mica,
HOPG) devoid of biological material. Both the spring constant and the sensitivity of
56 Eric Lesniewska et al.
the detection system transform the voltage reading from the photo-diode into an ab-
solute displacement (d) leading to the force experienced (F) by the cantilever during
the scan (F = k · d). In the spring constant of the cantilever (k), the values provided
by manufacturers are in general a reasonable estimate of the mean value obtained for a
population of cantilevers of comparable length and thickness. A better evaluation of the
spring constant of the cantilever used for the experiment can be obtained through the
determination of its resonance frequency or of its thermal noise (Cleveland et al., 1993;
Butt and Jaschke, 1995). The laser light reflected by the cantilever dissipates heat around
the tip, resulting in instabilities in the position of the cantilever as long as the thermal
equilibrium with the surrounding medium is not achieved. For the softest commercial
cantilevers (k = 0.01 N/m) the equilibrium period can take more than 1 h. For low-force
AFM in the contact mode, this equilibrium must be obtained before starting the imaging.
The oscillating mode is less sensitive to temperature equilibration.
C. Cell Viability
Until very recently, there was no temperature control unit commercially available for
the AFM. Accordingly, with few exceptions, experiments on cells were performed at
about 3
◦
C above room temperature, because of the heating of the solution by the energy
dissipated from the laser diode. Most of the mammalian cell lines which grow at 37
◦
C are
still active, albeit at a reduced rate, at this temperature. It is important, however, to check
under an optical microscope whether the shape of the cells is not altered by the change
in temperature. In the 5% CO
2
atmosphere of incubators, growth media are buffered
by bicarbonate. In an air atmosphere, maintaining the pH constant requires the replace-
ment, at least partial, of the culture medium. Hank’s medium, phosphate saline buffer
(PBS) complemented with glutamine and calcium, or mixtures of the growth medium
(without serum) with PBS (1/1 or 1/2, vol/vol) generally offer satisfying solutions. For
long-duration experiments on cells, care must be taken to prevent changes in the buffer
composition resulting from water evaporation. Dye exclusion tests, like the trypan blue
test, allow the establishment of the viability of the preparation at the end of the exper-
iment (Le Grimellec et al., 1994). Hoh and Schoenenberger (1994) demonstrated that
the viability of cells under the AFM can be maintained for periods as long as 44 h.
V. Imaging of Cells
Using stand-alone AFM coupled with an inverted optical microscope makes the po-
sitioning of the tip above a cell body easy, even when using either nonconfluent cell
cultures or isolated plated cells. For traditional AFMs, with the piezo-system located
below the sample, finding dispersed cells often requires patience, and working under
liquid also imposes to protect the piezo from leaks. Some manufacturers propose spe-
cial chambers with O-ring seals. Very often these seals are not perfectly efficient. Most
investigators work without the O rings and prefer to protect the piezo with pieces of thin
aluminum foil, stretch n’ seal, or equivalent films.
3. AFM Imaging of Cells and Membranes 57
A. Contact Mode
Once the sensitivity of the optical lever is determined and the thermal equilibrium is
reached, the system is ready for cell imaging. For reasons cited previously, cantilevers
with the lowest spring constants (0.01 to 0.06 N/m) are preferred. The usual silicon
nitride tips are also preferred for intact cell imaging because sharpened tips penetrate
the cell membrane (Haydon et al., 1996). The first step consists of the obtention on the
cell surface of a force versus distance ( f–d) curve, where the approaching and retracting
curves coincide as much as possible. To limit the damage, the force curve is performed
with the x,y scan size set to 0 nm. The vertical (z) scan range is fixed to a value between
500 and 1500 nm, with a scan rate of 1 Hz. Generally, using the default engagement
conditions, force versus distance curves obtained from the cells have a poor aspect
(Fig. 2A): a marked hysteresis between approaching and retracting curves is observed,
and it is very difficult, if not impossible, to determine the onset of the tip–cell surface
interaction and thus the scanning force. Such curves reflect the fact that, for the whole
vertical scanning distance z, the tip is in contact with the surface which is progressively
pushed down. This is most likely a consequence of the low spring constant of the cell
surface. Imaging under conditions where a large hysteresis between approaching and
retracting f–d curves occurs results, for cells as for any material, in very poor AFM height
images. Relatively good deflection images of the cell surface can, however, be obtained
under these conditions, but they need to be critically analyzed due to lack of control on
the scanning force. It is generally possible to circumvent this problem by raising, step
by step, the position of the tip (tip-up command on Digital Instruments AFMs) while
Fig. 2 Contact mode force versus distance curves at the surface of living CHO cells. (A) Force versus
distance curves obtained using the default engagement conditions. (B) Corresponding curves obtained after
raising the AFM tip according to the procedure described in the text. Cantilever spring constant: 0.03 N/m,
z scan rate 1 Hz.
58 Eric Lesniewska et al.
examining the f–d curves. A progressive decrease in the hysteresis accompanied by a
flattening of curves is observed, which ultimately leads to the detection of the onset
of the tip–cell surface interaction (Fig. 2B). For living cells, the tip often has to be
raised by distances greater than 1 or 2 μm above the engagement position. The z piezo
is accordingly working in an extended configuration. Obtention of the flat portion of
f–d curves, which corresponds to the position of the free cantilever, allows the precise
setting of the imaging force, using the predetermined sensitivity in nanometers, of the
cantilever response. The spring constant of the cell surface is significantly increased
by fixation using either glutaraldehyde or paraformaldehyde (Hoh and Schoenenberger,
1994). Practice in adjusting the tip position in f–d plots on fixed cells helps in subsequent
experiments on living cells.
Once the scanning force has been adjusted to low values, i.e., below 100 pN, a x–y
scanning range of, for example, 10 μm is chosen. Imaging conditions must be refined
using the oscilloscope traces accessible to the user via the AFM equipment. As for force
curves, good imaging requires that the trace and retrace traces coincide with
each other as much as possible. Again, a poor coincidence means poor quality imaging.
For large scans (>5 μm), the adjustments begin by using a scan rate of 1 Hz, integral and
proportional gains around 2 (Nanoscope III, D.I), and a scanning angle of 0
◦
. The effect
of varying the scanning force, through changes in the set-point voltage, is first checked
in the oscilloscope traces. Then gains and scanning rate are readjusted and, finally,
the best scanning angle is selected. This procedure is applied each time the imaging
field is changed. Once this is achieved, a new f–d curve is recorded which enables the
determination of the precise value of the force used for starting the imaging. A second
f–d plot is recorded once the image is acquired, leading to the force value at the end of the
imaging. If the forces prior to and after imaging are too different, which is often the case
for imaging forces below 200 pN, the set point must be readjusted manually during the
image acquisition. Following this procedure, height images of the surface of living CV-1
cells and MDCK cells were obtained with forces as low as 20 pN (Le Grimellec et al.,
1998). On these cell types, imaging below 100 pN was routinely achieved. It is important
to mention that for such low values it is difficult to estimate the tip force experienced
by the cell surface during scanning. What is measured is a deflection of the cantilever,
which does not mean that the tip is in real contact with the cell surface. Electrostatic
repulsion linked to the fact that Si
3
N
4
tips are negatively charged, as are most of the cell
surfaces, is likely to play a role in the bending of the cantilever (Butt, 1992; M¨uller et al.,
1999). Unfortunately, working with living cells limits the possibilities of changing the
medium composition to precisely determine to what extent the electrostatic repulsion
participates in the recorded cantilever deflection.
B. Oscillating Mode
Basically, for cell imaging in the oscillating mode, one must follow the same procedure
as that for the contact mode. The same triangular cantilevers with low spring constants
are used while working in aqueous medium, and the first step before imaging consists
of selecting the resonance peak (Putman et al., 1994). Using an oscillating piezo-drive
which excites mechanical resonances in both the cantilever holder and the bathing fluid
3. AFM Imaging of Cells and Membranes 59
generates numerous peaks in the frequency sweep. Experimentally, we found that the
peak centered around 8 kHz gives satisfactory results. The imaging frequency is not
at the peak value but is slightly shifted toward the lower frequency end. Establishing
the sensitivity, in nanometers, of the response of the detection system for the cantilever
chosen constitutes the second step. This is obtained through amplitude versus distance
(a–d) plots performed on a clean region of the support, taking care to limit the z scanning
range to the point where the oscillation is completely damped. Alternatively, to limit the
risk of tip damage, an approximate value corresponding to the mean value, determined
in previous experiments from a series of cantilevers of identical nominal spring con-
stant, can be fixed. The true sensitivity is established at the end of the experiments, and
the amplitude values used for imaging are corrected accordingly. Before engagement,
the peak amplitude on the frequency sweep is adjusted to ∼50 nm, with a set point
corresponding to a damping of ∼10 nm. The automatic tip approach command is then
activated, setting a 0-nm xy scan size. Upon engagement, a new a–d plot is performed on
the living cell surface. Most often, as in the contact mode, the plot shows a high curva-
ture which renders the detection of the onset of the change in amplitude slope practically
impossible (Fig. 3A). This precludes the precise adjustment of the feedback damping
(set point) value. By manually readjusting the vertical position of the photodetector it
is possible to acquire a deflection versus distance (de–d) plot simultaneously with the
a–d plot (Vi´e et al., 2000). Such plots, which compare with the f–d curves obtained in
Fig. 3 Tapping mode amplitude and deflection versus distance curves at the surface of living CHO cells.
The plots were performed with the same cells and the same cantilever as those used in Fig. 2. (A) and (B)
correspond to the amplitude (upper panels) and deflection (lower panels) versus distance curves obtained using
the default engagement condition and after the tip position adjustment, respectively. The arrow in (A) indicates
that the tip interacts with the cell surface during the entire z scan. On the other hand, in (B), the change in slope
in the deflection curve (arrow) allows the precise determination of the onset of the tip-cell surface interaction
and the adjustment of the amplitude damping for imaging.
60 Eric Lesniewska et al.
contact mode, result from the change in the cantilever median position upon interaction
of the oscillating tip with the sample surface and they are obtained only when work-
ing under liquid. As previously described for low-force imaging in the contact mode,
raising the position of the tip to work with the z piezo in an extended configuration
markedly reduces the hysteresis in both the a–d and the de–d curves (Fig. 3B). Once this
is achieved, the damping amplitude set point can be adjusted to the chosen value at the
position corresponding to the change in slope in the de–d plot. The end of the procedure
for cell imaging is the same as that for the contact mode. The exact determination of the
loading force applied to the cells during scanning in the oscillating mode is actually not
possible, but a rough estimate can be made from the amplitude and the spring constant
of the cantilever. Images of cells have been obtained using 0.01 N/m cantilevers with a
set point corresponding to a reduction in amplitude of less than 2 nm, i.e., with estimated
imaging forces below 20 pN. Interestingly, the deflection signal obtained in the oscillat-
ing mode is sensitive to local stiffness (Vi´e et al., 2000) and can provide images of the
organization of the submembranous cytoskeleton simultaneously with the acquisition of
the cell-surface topography via the height and amplitude signals. Deflection images are
close to but not identical to phase images which are reporting, at least partly (Chen et al.,
1998), on the local viscoelastic properties of the surfaces (Fig. 4).
Fig. 4 Low-magnification tapping mode images of living CV-1 cells. Scan size, 25 μm; scan rate, 1 Hz;
approximate scanning force; 50 pN (cantilever spring constant: 0.01 N/m).
3. AFM Imaging of Cells and Membranes 61
The Oscillating mode in liquid can also be obtained via an oscillating magnetic field
driving a magnetized cantilever (Han et al., 1996; MAC mode, Molecular Imaging,
Phoenix, AZ). This new mode offers the advantage of driving the tip directly, thus
leading to a unique resonance peak, with a reduced perturbation of the liquid medium.
The performances of this mode in cell imaging mostly remain to be established.
C. Actual Possibilities and Limits
Topographical images, under aqueous media, of the surface of various cell types either
in culture or even in tissue slices have now been reported with a resolution much better
than that of an optical microscope (see, for example, Fig. 5). Because it reduces the
friction forces, and therefore reduces the accumulation of membrane components on the
tip (Schaus and Henderson, 1997), the oscillating mode seems to be actually the best
choice for imaging cells. In terms of topography, several groups have reported lateral
resolutions close to 10 nm for the surface of various unfixed cells (Butt et al., 1990; H¨orber
et al., 1992; Le Grimellec et al., 1994, 1998). Indeed, this can only be achieved using
very low scanning forces and most often after an enzymatic treatment for disrupting the
glycocalix organization. Clearly not all cells are suitable for high-resolution imaging.
Besides the abundancy of the cell surface glycocalix, cells moving or growing fast
at room temperature can only provide fuzzy images when examined at a sufficiently
high magnification. Another type of problem that can be encountered is the presence
of tightly packed microvilli covering the surface, a situation often found in epithelial
Fig. 5 High-magnification imaging of outer hair cells from the inner ear. Cells were fixed with 0.5%
glutaraldehyde in buffer, and rinsed and examined in the same buffer. Height image, mode: tapping; scan size,
500 nm; scan rate,1.5 Hz; approximate force, 20 pN; z range, 200 nm/division.
62 Eric Lesniewska et al.
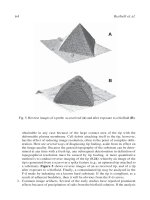
Fig. 6 Time-dependent reorganization of the surface of living cells after addition of 2.5 mM db-cAMP.
Upper part, height images; lower part, deflection images. Scan size, 25 μm; scan rate, 1.5 Hz; force, <100 pN
(contact mode); cantilever spring constant, 0.01 N/m.
cells. In that case, even working at low forces, the tip can only access the upper part
of the flexible microvilli, precluding the obtention of high-resolution images. Lateral
diffusion of membrane constituents, in the order of 1 μm
2
/s for membranes in the fluid
state, constitutes the ultimate limitation to high-resolution cell-surface imaging by AFM.
Accordingly, fixation is an absolute requirement for a precise localization of a particular
3. AFM Imaging of Cells and Membranes 63
protein (unless it spontaneously forms two-dimensional crystals) at the cell membrane.
In fact, a resolution better than 5 nm was recently obtained for the lateral surface of
glutaraldehyde-fixed inner ear cells examined in buffer (Le Grimellec et al., 2000). This
strengthens the view that AFM can, in the near future, provide key information on the
understanding of the organization of membranes at the molecular level.
For physiologists, a final important point about AFM imaging of living cells is the time
required for imaging. In the best circumstances, good resolution scanning of a limited
(∼10-μm
2
) cell region with a commercial apparatus takes about 2 min. Accordingly, this
limits the studies on cell topography-function to slow processes as illustrated in Fig. 6,
where the changes in the cell surface of CV-1 cells resulting from the addition, under
the AFM, of dibutyryl-cAMP, are described.
VI. Imaging of Isolated Membranes
The main difficulty encountered both in AFM imaging of intact cells and in the
interpretation of the images obtained lies in not only the chemical heterogeneity of cell-
surface constituents but also the relative softness of the plasma membrane with regard
to the other cellular elements, cytoskeleton, cytosol, and intracellular organelles, it sur-
rounds. For instance, even by using low scanning forces, it remains difficult to assess
the relative contributions of both real plasma membrane elements and subplasma mem-
brane structures in the images of the cell surface. This also holds true when estimating
the local mechanical properties of cells. The use of purified membranes adsorbed on a
hard support, generally mica or glass, provides direct information about the structure of
isolated biological membranes. Unroofing with filters followed by the extensive wash-
ing of support-attached cells, which results in the exposure of the cytoplamic leaflet
of the basal membrane to the medium (Le Grimellec et al., 1995; Ziegler et al., 1998)
direct examination at the tip of a pipette (H¨orber et al., 1995), or the examination after
transfer to the support of patch-clamp membrane fragments (L¨armer et al., 1997), has
thus far provided AFM images resembling those obtained at the surface of intact cells.
The general conditions for imaging these structures are equivalent to those followed for
cells, i.e., minimizing the imaging force; except that a greater degree of freedom exists in
the choice of the imaging buffer compositions, which can result in improved resolution
images (M¨uller et al., 1999).
VII. Conclusion and Perspectives
Difficulties encountered in adjusting the imaging parameters have limited the use of
the AFM in cell biology and physiology. With the recent improvements in the procedure,
it is now possible to image the surface of cells on a nearly routine basis. For living cells,
this opens up the possibility to investigate the three-dimensional structure–function re-
lationships of the cell surface at a mesoscopic scale, a procedure thus far inaccessible by
conventional microscopic techniques. Two technical improvements would contribute to
64 Eric Lesniewska et al.
facilitate the use of AFM in cell studies and to widen the field of its applications. The first
concerns the availability of short cantilevers with lower spring constants (<0.005 N/m),
eventually coupled with radiation pressure compensation for thermal bending motion
(Tokunaga et al., 1997), which would further increase the control on the forces used
for imaging. Lowering from minutes to seconds the time scale needed for one image
acquisition (Walters et al., 1997) is a second essential improvement which would enable
the study of a much larger number of biological processes. Obtention of high-resolution
images on either fixed cells or isolated membranes presents a problem regarding the
identification of the structures imaged. Scanning near-field fluorescence resonance en-
ergy transfer microscopy (Vickery and Dunn, 1999) and recognition imaging by force
microscopy (Hinterdorfer et al., 1996) constitute the most promising approaches to solve
these problems.
Acknowledgments
This work was supported by grants from La Fondation pour la Recherche M´edicale, l’Association pour la
Recherche sur le Cancer, la R´egion Languedoc-Roussillon, and l’Universit´e Montpellier I.
References
Binnig, G., Quate, C. F., and Gerber, Ch. (1986). Atomic force microscope. Phys. Rev. Lett. 56, 930–933.
Butt, H J. (1992). Electrostatic interaction in scanning probe microscopy when imaging in electrolyte solutions.
Nanotechnology 3, 60–68.
Butt, H J., and Jaschke, M. (1995). Calculation of thermal noise in atomic force microscopy. Nanotechnology
6, 1–7.
Butt, H. J., Wolff, E. K., Gould, A. C., Dixon Northern, B., Peterson, C. M., and Hansma, P. K. (1990). Imaging
cells with the atomic force microscope. J. Struct. Biol. 105, 54–61.
Chen, X., Davies, M. C., Roberts, C. J., Tendler, S. J. B., Williams, P. M., Davies, J., Dawkes, A. C., and
Edwards, J. C. (1998). Interpretation of tapping mode atomic force microscopy data using amplitude-phase-
distance measurements. Ultramicroscopy 75, 171–181.
Cleveland, J. P., Manne, S., Bocek, D., and Hansma, P. K. (1993). A nondestructive method for determining
the spring constant of cantilevers for scanning force microscopy. Rev. Sci. Instrum. 64, 403–405.
Han, W., Lindsay, S. M., and Jing, T. (1996). A magnetically driven oscillating probe microscope for operation
in fluids. Appl. Phys. Lett. 69, 4111–4114.
Haydon, P. G., Lartius, R., Parpura, V., and Marchese-Ragona. (1996). Membrane deformation of living glial
cells using atomic force microscopy. J. Microsc. 182, 114–120.
Hinterdorfer, P., Baumgartner, W., Gruber, H. J., Schilcher, K., and Schindler, H. (1996). Detection and
localization of individual antibody-antigen recognition events by atomic force microscopy. Proc. Natl.
Acad. Sci. U.S.A. 93, 3477–3481.
Hoh, J. H., and Schoenenberger, C A. (1994). Surface morphology and mechanical properties of MDCK
monolayers by atomic force microscopy. J. Cell Sci. 107, 1105–1114.
H¨orber, J. K. H., H¨aberle, W., Ohnesorge, F., Binnig, G., Liebich, H. G., Czerny, C. P., Mahnel, H., and
Mayr, A. (1992). Investigation of living cells in the nanometer regime with the scanning force microscope.
Scanning Microsc. 6, 919–930.
H¨orber, J. K. H., Mosbacher, J., H¨aberle, W., Ruppersberg, J. P., and Sakmann, B. (1995). A look at membrane
patches with a scanning force microscope. Biophys. J. 68, 1687–1693.
Jacobson, K., Sheets, E. D., and Simson, R. (1995). Revisiting the fluid mosaic model of membranes. Science
268, 1441–1442.
3. AFM Imaging of Cells and Membranes 65
Kasas, S., and Ikai, A. (1995). A method for anchoring round shaped cells for atomic force microscope imaging.
Biophys. J. 68, 1678–1680.
L¨armer, J., Schneider, S. W., Danker, T., Schwab, A., and Oberleithner, H. (1997). Imaging excised api-
cal plasma membrane patches of MDCK cells in physiological conditions with atomic force microscopy.
Pfluegers Arch.–Eur. J. Physiol. 434, 254–260.
Le Grimellec, C., Giocondi, M C., Pujol,R., and Leniewska, E. (2000). Tapping mode atomic force microscopy
allows the in situ imaging of fragile membrane structures and of intact cells surface at high resolution. Single
Molecules 1, 105–107.
Le Grimellec, C., Lesniewska, E., Cachia, C., Schreiber, J. P., de Fornel, F., and Goudonnet, J. P. (1994).
Imaging the membrane surface of MDCK cells by atomic force microscopy. Biophys. J. 67, 36–41.
Le Grimellec, C., Lesniewska, E., Giocondi, M C., Cachia, C., Schreiber, J. P., and Goudonnet, J. P. (1995).
Imaging of the cytoplasmic leaflet of the plasma membrane by atomic force microscopy. Scanning Microsc.
9, 401–411.
Le Grimellec, C., Lesniewska, E., Giocondi, M C., Finot, E., Vi´e, V., and Goudonnet, J P. (1998). Imaging
of the surface of living cells by low-force contact-mode atomic force microscopy. Biophys. J. 75, 95–703.
M¨uller, D. J., Fotiadis, D., Scheuring, S., M¨uller, S. A., and Engel, A. (1999). Electrostatically balanced
subnanometer imaging of biological specimens by atomic force microscope. Biophys. J. 76, 1101–1111.
Putman, C. A. J., van der Werf, K. O., de Grooth, B. G., van Hulst, N. F., Greve, J., and Hansma, P. K. (1992).
A new imaging mode in atomic force microscopy based on the error signal. Proc. Soc. Photo-Opt. Instrum.
Eng. 1639, 198–204.
Putman, C. A. J., van der Werf, K. O., de Grooth, B. G., van Hulst, N. F., and Greve, J. (1994). Viscoelasticity
of living cells allows high resolution imaging by tapping mode atomic force microscopy. Biophys. J. 67,
1749–1753.
Radmacher, M., Tillmann, R. W., Fritz, M., and Gaub, H. E. (1992). From molecules to cells: Imaging soft
samples with the atomic force microscope. Science 257, 1900–1905.
Schauss, S. S., and Henderson, E. R. (1997). Cell viability and probe-cell membrane interactions of XR1 glial
cells imaged by atomic force microscopy. Biophys. J. 73, 1205–1214.
Shao, Z., Mou, J., Czajkowsky, D. M., Yang, J., and Yuan, J Y. (1996). Biological atomic force microscopy:
what is achieved and what is needed. Adv. Phys. 45, 1–86.
Simons, K., and Ikonen, E. (1997). Functional rafts in cell membranes. Nature 387, 569–572.
Thimonier, J., Montixi, C., Chauvin, J P., Tao He, H., Rocca-Serra, J., and Barbet, J. (1997). Thy-1 immuno-
labeled thymocytes microdomains studied with the atomic force microscope and the electron microscope.
Biophys. J. 73, 1627–1632.
Tokunaga, M., Aoki, T., Hiroshima, M., Kitamura, K., and Yanagida, T. (1997). Subpiconewton intermolecular
force microscopy. Biochem. Biophys. Res. Commun. 231, 566–569.
Tsilimbaris, M. K., Lesniewska, E., Lydataki, S., Le Grimellec, C., Goudonnet, J. P., and Pallikaris, I. G. (2000).
The use of atomic force microscopy for the observation of corneal epithelium surface. Invest. Ophthalmol.
Vis. Sci. 41, 680–686.
Vickery, S. A., and Dunn, R. C. (1999). Scanning near-field fluorescence resonance energy transfer microscopy.
Biophys. J. 76, 1812–1818.
Vi´e, V., Giocondi, M C., Lesniewska, E., Finot, E., Goudonnet, J. P., and Le Grimellec, C. (2000). Tapping
mode atomic force microscopy on intact cells: Optimal adjustment of tapping conditions by using the
deflection signal. Ultramicroscopy 82, 279–288.
Walters, D. A., Viani, M., Paloczi, G. T., Sch¨affer, T. E., Cleveland, J. P., Wendman, M. A., Gurley, G., Elings,
V., and Hansma, P. K. (1997). S.P.I.E. 3009, 43–47.
Ziegler, U., Vinckier, A., Kernen, P., Zeisel, D., Biber, J., Semenza, G., Murer, H., and Groscurth, P. (1998).
Preparation of basal cell membranes for scanning probe microscopy. FEBS Lett. 436, 179–184.