Chương 3 Nhu cầu, cung cấp, và thị trường pptx
Bạn đang xem bản rút gọn của tài liệu. Xem và tải ngay bản đầy đủ của tài liệu tại đây (109.61 KB, 12 trang )
Chapter 3
Demand, supply, and the market
David Begg, Stanley Fischer and Rudiger Dornbusch, Economics,
6th Edition, McGraw-Hill, 2000
Power Point presentation by Peter Smith
3.2
Some key terms
Market
–
a set of arrangements by which buyers and sellers
are in contact to exchange goods or services
Demand
–
the quantity of a good buyers wish to purchase at
each conceivable price
Supply
–
the quantity of a good sellers wish to sell at each
conceivable price
Equilibrium price
–
price at which quantity supplied = quantity
demanded
3.3
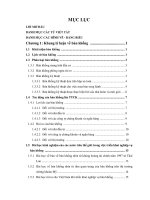
The Demand curve shows the relation
between price and quantity demanded
holding other things constant
“Other things”
include:
–
the price of related
goods
–
consumer incomes
–
consumer
preferences
Changes in these
other things affect the
position of the
demand curve
D
Quantity
Price
3.4
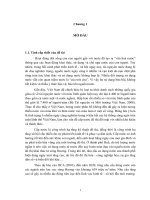
The Supply curve shows the relation
between price and quantity supplied holding
other things constant
“Other things”
include:
–
technology
–
input costs
–
government
regulations
Changes in these
other things affect the
position of the
demand curve
Quantity
Price
S
3.5
Market equilibrium
Market equilibrium is
at E
0
where quantity
demanded equals
quantity supplied
–
with price P
0
and
quantity Q
0
D
0
D
0
S
S
Q
0
P
0 E
0
P
r
i
c
e
Quantity
3.6
Market equilibrium
If price were above P
0
there would be excess
supply
–
producers wish to
supply more than
consumers wish to
demand
D
0
D
0
S
S
Q
0
P
0 E
0
P
r
i
c
e
Quantity
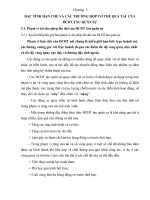
3.7
A shift in demand
D
0
D
0
S
S
Q
0
P
0
E
0
P
r
i
c
e
Quantity
If the price of a substitute
good increases
more will be demanded at
each price
D
1
D
1
The demand curve shifts
from D
0
D
0
to D
1
D
1.
E
1
Q
1
P
1
The market moves to a
new equilibrium at E
1
.
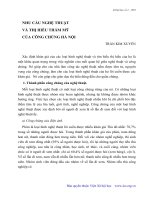
3.8
A shift in supply
D
D
Q
0
P
0
E
0
P
r
i
c
e
Quantity
Suppose safety
regulations are tightened,
increasing producers’ costs
S
0
S
0
S
1
S
1
The supply curve
shifts to S
1
S
1
If price stayed at P
0
there
would be excess demand
Q
1
P
1
E
2
So the market moves to a
new equilibrium at E
2
.
3.9
Two ways in which demand may increase
(1) A movement
along the demand
curve from A to B
represents
consumer reaction
to a price change
this could follow a
supply shift
A
B
P
0
P
1
Q
0 Q
1
Quantity
P
r
i
c
e
D
3.10
Two ways in which demand may increase
(2) A movement of
the demand curve
from D
0
to D
1
leads to an increase in
demand at each price
e.g. at P
0
quantity
demanded increases
from Q
0
to Q
1
A
B
P
0
Q
0
Q
1
C
D
0
D
1
Quantity
P
r
i
c
e
3.11
A market in disequilibrium
Suppose a disastrous
harvest moves the
supply curve to SS
government may try to
protect the poor, setting
a price ceiling at P
1
which is below P
0
, the
equilibrium price level
RATIONING is needed to
cope with the resulting
excess demand
Quantity
P
r
i
c
e
P
0
Q
0
Q
1
D
S
S
P
1
E
A B
P
2
3.12
What, How and For Whom
The market:
–
decides how much of a good should be
produced
by finding the price at which the quantity demanded
equals the quantity supplied
–
tells us for whom the goods are produced
those consumers willing to pay the equilibrium price
–
determines what goods are being produced
there may be goods for which no consumer is
prepared to pay a price at which firms would be
willing to supply