Wrox Professional Crystal Reports for Visual Studio NET Second Edition phần 4 pdf
Bạn đang xem bản rút gọn của tài liệu. Xem và tải ngay bản đầy đủ của tài liệu tại đây (1.82 MB, 38 trang )
Chapter 3
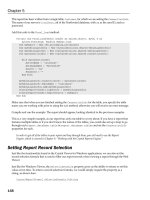
When you click OK to exit the Chart Expert, your Chart will be added to your Report Header. When you
see the report in the designer, a pie chart should now be displayed in the Report Header. This isn’t an
accurate drawing of your graph. In fact it is nothing like your graph; it is just a placeholder to show
where in the report the graph will be positioned. If you preview the graph in a Windows form, it will
look something like Figure 3-34.
Another option to increase readability would be to make the chart larger. The chart object inserted into
your report is just like any other object in that it can be resized to fit your needs; you could even resize
the graph to take up the entire first page if that suits the needs of the report.
If you have a graph or chart inserted into your report, you can control the content by right-clicking
directly on top of the chart and selecting an option from the menu. The Chart Expert can be used to alter
the graph in the way that we have described so far in this section. You may have noticed that the Chart
Expert includes an option on the first tab labeled “Automatically set chart options.” If you uncheck this
box, two more tabs will appear, allowing you to control other aspects of the report, including the format
ting for the graph axes and the general settings (like color, marker size, and so on).
Under Format Chart are the Template, General, and Titles options, which also allow you to customize
the appearance of your chart. The options in all of these menus are context sensitive; for example, you
can perform different types of formatting to a pie chart than you can to a bar chart. These options are all
relatively simple, so we’ll leave it to you to explore the almost endless possibilities.
Figure 3-34
92
Designing Reports
Unfortunately, if you have used the retail version of Crystal Reports before, you will probably be won
dering what happened to the Chart Analyzer, which allows you to open the graph in another tabbed
window. Crystal Reports .NET does not include the full capabilities of the Chart Analyzer, so if you
really need to use some of the advanced formatting features for charts and graphs, you are going to
have to buy a retail copy of Crystal Reports.
Working with Subrepor ts
Within Crystal Reports .NET, multiple subreports can be combined into one main report, which allows
you to create information-rich reports from multiple sources and display this information side by side.
Both linked and unlinked subreports are available in the code download, found in the solution:
C:\CrystalReports\Chapter02\Demo\Chapter2.sln. Open and run this solution from Visual
Studio .NET and choose the report from the drop-down box at the top right of the window.
To run the unlinked report, you will need access to the Northwind sample database.
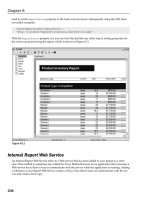
Subreports come in two varieties — unlinked and linked. Unlinked subreports allow you to insert subreports
that are totally unrelated to the main report content. In Figure 3-35, a sales graph has been inserted into an
employee listing report (included in the sample files as employee_listing_unlinked.rpt). Both of
these reports were developed independently and are from different tables and a different data source.
Figure 3-35
93
Chapter 3
The second type of report is the linked subreport. Linked subreports allow the passing of parameters and
variables between the main report and the subreport, which can be used to filter the subreport content.
The report shown in Figure 3-36 has a main report that is the same employee listing report, only this
time a linked subreport has been inserted showing a commission amount for each employee (included in
the sample files as employee_listing_linked.rpt). The commission report is a separate report, but it
is inserted into the details section and linked on the employee ID field.
Figure 3-36
For each employee, the subreport is run again, and the employee ID is used in record selection on the
subreport. When the page is printed, each instance of the subreport is printed next to the corresponding
employee, with only their details shown.
Inserting Subreports
To insert a subreport into your report, right-click a blank area of the report, and select Insert →
Subreport from the right-click menu, which will open the dialog shown in Figure 3-37.
You have three options for adding a new subreport: First, if the report you want to add is a report that
exists in your current project, you can use the drop-down list at the top of the dialog to select the report.
94
Designing Reports
Figure 3-37
Second, if you want to add an existing report that has been saved outside of your project, use the Choose
a report option and the Browse button to locate the report you want to add as a subreport.
And finally, if you want to create a subreport from scratch, select the Create a subreport option, enter a
name for the subreport, and click the Report Expert button to launch the Standard Expert, which we
looked at in Chapter 2, to create your report. The Standard Expert is shown in Figure 3-38.
Figure 3-38
95
Chapter 3
Once you have selected or created your report, click the Links tab to open the dialog shown in
Figure 3-39.
Figure 3-39
Using this dialog, you can create a linked subreport, where the subreport details will be filtered by a
field in your main report. To select a field from the main report, highlight the field and click the rightarrow to add it to the list of selected fields. Then, using the drop-down lists at the bottom of the page,
select the corresponding field in your subreport.
Remember, you don’t actually have to specify any links at all, but if you do not, the subreport will not
be filtered — that is, it will run for all records in the subreport, wherever you place it. If you place an
unlinked subreport in the details section of your main report, for example, it will run once for every
detail record.
When you are finished, click OK to return to the report designer; your subreport will be attached to the
tip of your cursor, and you can click to place it on your report. It will appear as a box with a border
around it and a label for the subreport name.
Changing Subreports
To change the subreport name that appears when you preview your report, right-click the subreport and
select Format from the right-click menu. Using the option on the Subreport property page, you can
change the Subreport Preview Caption by clicking the X+2 button and entering a new name enclosed in
double-quotes. Whenever the subreport name is shown (in the main report, in the tool text, on a design
tab for the subreport, and so on), this name will be used.
96
Designing Reports
Another common format change is the subreport border; Crystal Reports places a border around any
subreports you have inserted into a main report, and this is usually the first default formatting option
you will want to turn off. To change the border around a subreport, right-click the subreport and select
Format. From the Border tab in the Format Editor dialog, shown in Figure 3-40, you can change all four
of the Line Style drop-down boxes from Single to None.
Figure 3-40
Alternatively, if you want a border around your subreport, you can use the drop-down boxes and
options to select a line style (Single, Double, Dashed, Dotted) and color, as well a background color and
drop shadow. When you are finished editing the borders and colors for your subreport, click OK to
return to your report design.
Subreport links are usually set up when you first insert a subreport, but you can change subreport link
age as your needs and report structure change. You will need to locate the subreport you want to
change, right-click directly on top of it, and then select Change Subreport Links from the right-click
menu. This will open the Subreport Links dialog and allow you to change the links to your subreports.
Creating On-Demand Subreports
On-demand subreports have become a popular option with Crystal Reports developers; an on-demand
subreport included within a main report is not processed until required. Such a subreport can appear as
a link or even an element of a main report, but the subreport is not actually processed until the user
clicks the link or element, like the one shown in Figure 3-41.
97
Chapter 3
Figure 3-41
When the subreport is processed, it is opened in a separate preview tab and can be viewed and printed
independently. This is a great way to ensure efficient reporting; the details contained within a subreport
are not returned until a user requests them.
To create an on-demand subreport, you can insert either a linked or unlinked subreport. Once the subre
port has been inserted onto your report, you will need to set some options for on-demand reports.
Locate the subreport you want processed on demand, right-click directly on top of it, select Format, and
then select the Subreport tab, which will open the dialog shown in Figure 3-42.
There is only one setting required to process a subreport on demand, and that is the check box shown at
the top of the dialog. With this option enabled, a subreport will not be processed until the user clicks it.
The user may need a little prompting to understand what is going on. For this purpose, you can select
On-demand Subreport Caption by clicking the X+2 button. Using the Crystal Reports Formula Editor,
enter a caption for your on-demand subreport and enclose it in quotation marks. This text is what
the end user will see on the on-demand subreport link when previewing your main report. When you
are finished, click the Save and Close button in the upper left corner to exit the formula editor (see
Figure 3-43).
98
Designing Reports
Figure 3-42
Figure 3-43
99
Chapter 3
Saving and Reimporting Subreports
Subreports can be saved to a separate, independent report file and can also be reimported when the
main report is opened. Saving subreports to an external file allows you to break up main reports and
subreports so users can print the subreport independently or use it in other reports. To save a subreport,
right-click directly on top of the subreport object in your main report and select Save Subreport As.
Specify a file name and click OK, and your subreport will be saved to a separate file.
Reimporting subreports provides a creative way of using them. Using this facility, you can create a num
ber of reports that can serve both as subreports and as reports in their own right. This setting is available
for linked or unlinked subreports that have been inserted from an existing report file. To enable this set
ting, locate a subreport that has been inserted from an existing file, right-click directly on top of the subreport object, and select Format from the right-click menu.
The Subreport property page contains a Re-import When Opening check box. Enable this option, as
shown in Figure 3-44, and Crystal Reports will look in the last file location and attempt to reimport the
report file you originally used.
Figure 3-44
If the report file name or location has changed, Crystal Reports will display the error message and allow
you to select the correct file name or location for the subreport you want to import.
You can also force reimport at any time by right-clicking the subreport object and selecting Re-import
Subreport from the right-click menu.
100
Designing Reports
Working with Parameter Fields
Parameter fields enable you to create reports that could be used in a variety of ways, prompting the user
for all kinds of information, including values to be used with record selection, sort orders, report titles,
comments, and more. Parameter fields also give you a quick and easy way to create reports that can
serve many users and purposes.
Parameter fields can be used in your report in a number of different ways. The simplest use of a parame
ter field is when you want to display some text on your report. This could be the report title, a brief
explanation of the report, your name, or just about anything you could imagine where you need to add
some text to your report at runtime.
A second use for parameter fields is in conjunction with formulas: You may want to prompt the user for
the sales tax amount, which will then be calculated; a particular type of shipping (two-day, overnight,
and so on), which could then be used to calculate shipping cost; or even a discount amount when print
ing invoices.
The third and most popular use of parameter fields has to be record selection. By using parameter fields,
you can create a single report that can be sliced many different ways, depending on what values the user
enters for the parameter fields. These fields are then used in the record selection formula to determine
what data is brought back from the database.
Creating a Parameter Field
The first step in creating a parameter field is specifying a name for that field. Once you have created
your parameter field, Crystal Reports will enclose this field name in curly brackets, preceded by a ques
tion mark to indicate it is a parameter field ({?ParamFieldName}). You can also enter prompting text
that will appear whenever the Parameter Field dialog appears, as shown in Figure 3-45. Prompting text
should help the user understand what to enter in the value field of the dialog (for example, “Please enter
a state for this report.”).
By default, any parameter you create will have a default type of String, but there are actually seven dif
ferent field types you can use, including:
String
For entering alphanumeric text
Currency
For prompting users to enter an integer with two decimal places
Date
Used to enter a standard date, in the format Month/Day/Year
Date Time
For prompting for a date/time string, in the format
Month/Day/Year Hour/Minute/Second/AM
Time
For entering the time in the format Hour/Minute/Second/AM
Number
Used to enter a number with variable decimal places
Boolean
Used to prompt users for a true or false response
101
Chapter 3
Figure 3-45
Which field type you choose depends on how you are going to use the field in your report. Other
attributes that can be set when creating a parameter field include:
❑
Allow Multiple values — Allows you to enter a list of values for your parameter field
❑
Discrete — Allows you to enter a single value
❑
Range — Allows you to specify an inclusive range, using a start and value
❑
Discrete and Range — Allows a combination of the previous two attributes
Most of the attributes discussed here are optional; to create a parameter field, the only requirement is
that you give your parameter field a name and choose a field type.
102
Designing Reports
To create a simple parameter field to be used in your report, open the Field Explorer and right-click the
Parameter Fields node and select New from the right-click menu. Using the dialog shown in Figure 3-46,
type a name for your parameter field. In this example, we have named the parameter field “EnterState.”
Figure 3-46
Once you have dragged a parameter field onto your report, you will be prompted to enter a value for
the parameter the next time the report is previewed using the Windows report viewer, which we will
look at in the next chapter, and the generic parameter prompting dialog, as seen in another example in
Figure 3-47.
Next, enter any text you wish to appear when the user is prompted for information (for example,
“Please enter an employee ID for this report.”). Using the combo box labeled “Value type,” select a data
type for your parameter field.
Click OK to accept your changes. Your parameter field should now appear within the Field Explorer,
ready to be used on your report. To insert a parameter field you have created, you can simply drag it
from the Field Explorer onto your report design.
If you are using parameters with a Web application, you will need to set the parameter before you view
the report. Otherwise you will receive an error message.
After you have entered a value for your parameter field, that value will be displayed in the report pre
view until you refresh your report and specify you want to prompt for a new parameter value.
103
Chapter 3
Figure 3-47
Optimizing Repor t Performance
If you have worked with reporting applications before, there is a usually a bit of time spent on optimiz
ing report performance; users are not happy with reports that run for three minutes, let alone three
hours. Over the years, there have been significant enhancements within the Crystal Print Engine that
have improved performance and cut down on processing time, but the majority of poor report perfor
mance does not lie within the Report Designer but rather in how the report is designed and in the
underlying data.
For example, if you have a report that has been developed across an Oracle table that contains 500,000
rows of data, the report is going to take a while to run, regardless of whether you are using Crystal
Reports .NET or just submitting an SQL Statement from a PL/SQL command prompt. If you believe that
a report’s performance could be improved, ask your DBA or architect to review the tables, views, and
other data impedimenta that you are using in order to verify that you have used the correct primary and
foreign keys and that you have taken the most direct route to join tables in your report.
104
Designing Reports
Following from that, you also may want to take the SQL that Crystal Reports .NET generates (right-click
your report and select Database → Show SQL Query) and paste it into SQL*Plus Query Analyzer or any
other SQL query tool supported by your database platform to see how long it runs. Your DBA could also
provide suggestions on ways to improve the SQL statement generated, and you can then use the opti
mized SQL as the basis for your report.
With Crystal Reports .NET itself, there are a couple of options that can help with performance. To view
these options, right-click your report and select Report → Report Options.
There are two options in this dialog that can aid with performance: The first, Use Indexes or Server For
Speed, for use with databases that use indexes, will use the index on the database server to sort and
retrieve records faster than if the index was not used. The second option, Perform Grouping On Server,
for reports that have groups, will push the grouping back to the database server, provided that the
details within your report are suppressed. (We can’t show detailed records in the report because it
actually changes the SQL statement and uses a GROUP BY clause.)
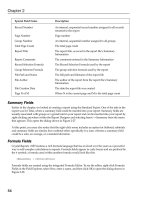
Summar y
This chapter ran through the laundry list of Crystal Reports features and functionality without even
stopping to take a breath! Most report designers will not use all of these features in a single report, but
hopefully this chapter will serve as a reference that you can turn to as you need to add different features
to your own reports.
So with a bit of report design under your belt, it’s time to take a look at actually integrating the reports
you have been creating with your own applications. In the next chapter we’ll pick up with that topic,
starting with integration for Windows applications.
105
Repor t Integration
for Windows-Based
Applications
With a bit of basic report design under our belts, it’s time to look at actually integrating reports
into your Windows-based applications. In the previous chapter, we looked at how to create reports
using some of the features within Crystal Reports .NET.
In this chapter, we are going to look at how to integrate and view those same reports from
Windows applications and how to customize our reports at run time using the rich object models
provided. We will cover:
❑
Determining the correct object model
❑
The CrystalDecisions.Windows.Forms namespace
❑
Using the Crystal Windows Forms Viewer
❑
Customizing the Windows Forms Viewer
❑
Passing information to the Windows Forms Viewer
Throughout the chapter, we will be looking at code examples to illustrate the use of various fea
tures, and by the end of the chapter, you should be familiar with the majority of report integration
concepts and be ready to apply them to your own application development.
Obtaining the Sample Files
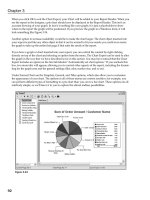
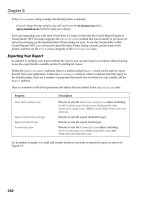
All of the projects we will work through in this chapter (like the custom viewer shown in Figure 4-1),
as well as the associated sample reports are available for download from www.wrox.com.
Chapter 4
Figure 4-1
As you go through the chapter, you will be able to actually look at the application we are creating and
other examples that illustrate points along the way.
Planning Your Application
Integrating reports is an easy way to add value to your application and can be an important component
of your application’s offering. Before we get started on actually integrating Crystal Reports .NET with
your Windows application, we need to do a little planning to make sure the integration goes smoothly.
First, we need to have a report (or suite of reports) to work with. In Chapter 2, “Getting Started with
Crystal Reports .NET,” we walked through the report planning and design process, so you should have
a start on the skills you need to design reports.
108
Report Integration for Windows-Based Applications
If you flipped straight to this chapter or haven’t gotten into designing your own reports yet, there are
some sample reports located in C:\program files\Visual Studio .Net 2003\Crystal Reports\
Samples\ that you can use to practice concepts from this chapter; alternatively, there are the sample
reports included in the download file as well.
We need to plan for how those reports will be delivered to users and the forms that will be required to
host them. Crystal Reports .NET uses a feature-rich report viewer that can be inserted onto a Windows
Form and used to view reports. The viewer itself has an extensive object model, allowing you to set the
source of the report, the appearance of the viewer itself, and what happens when different events fire.
Most applications can utilize a single Windows Form hosting the Crystal Report Viewer and simply pass
properties like the report source and viewer settings to this form. This lends itself to a number of cre
ative solutions for user personalization and settings. You could store viewer settings and preferences in a
table or XML file for each user (or group or role) and apply these settings when viewing a report.
In addition, you could also set specific record selection formulas for different groups of users, allowing
them access only to the data applicable to them. You could also create a custom user interface, allowing
users to set and retain parameter settings for future use, or even to keep their printing or export prefer
ences, such as frequently used e-mail addresses.
Ultimately, the report integration should be driven by the user’s requirements, but how these features
are delivered is up to you. As you go through the rest of the chapter, think about how the different cus
tomization features could be used in your development. If you are not at a point where you can integrate
these features into your application, all of the properties, methods, and events are grouped together by
function to make it easier to come back and look them up.
Exploring the Development Environment
Visual Studio .NET provides a rich integrated design environment for developing Windows and Web
applications, and there are a number of components and shortcuts to help us integrate Crystal Reports
into Windows applications.
To begin, in the toolbox under the Windows Forms section, you will find the CrystalReportViewer,
which we will be working with a little later. When you draw this viewer on a Windows Form, you can set
a number of properties and use the viewer to display a preview of your report, as shown in Figure 4-2.
In addition to the CrystalReportViewer, there is also a ReportDocument component available in the
components section of the toolbox. We use this component to add strongly typed and untyped reports to a
form, for use with the viewer mentioned earlier. (Don’t be too worried about it at the moment, as we’ll
cover that a little later in the chapter.)
109
Chapter 4
Figure 4-2
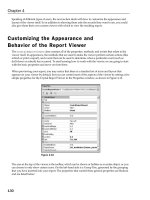
Finally, the majority of our report integration will take place in the code view of the form, as shown in
Figure 4-3.
All of the properties, methods, and events related to Crystal Reports object models and integration can
be set and modified through this view, as well as through the Properties window.
Starting a New Windows Application with VB .NET
To begin, we need to create a new Windows application using Visual Basic .NET. If you want, follow
along using the sample code available for this chapter; you will find a number of projects included that
correspond to the sections in this chapter. If you want to get down and get your hands dirty creating
your own project as we go along, then from within Visual Studio, select File → New → Project, and from
within Visual Basic Projects, select Windows Applications and specify a name, as shown in Figure 4-4
(in the sample code, we have called this project viewer_basic and we have saved it to
C:\Crystal.NET2003\Chapter04)
110
Report Integration for Windows-Based Applications
Figure 4-3
Figure 4-4
111
Chapter 4
Throughout the chapter, we will be using only one or two forms to demonstrate different integration
features; your own applications will probably have multiple forms and launch reports from any number
of them, but the same concepts can be applied.
Before we actually look at any code, we need to go back to the integration features that you want to
incorporate into your application and select the appropriate object model(s).
Determining the Correct Object Model
When working with Windows applications, you have two different object models to choose from,
depending on your particular needs. The first, contained within the Crystal Reports Windows Forms
Viewer object model (CrystalDecisions.Windows.Forms), contains all of the functionality required to
view a report in the Crystal Reports Windows Forms Viewer. It also includes the ability to set database
logon information, pass parameters and record selection, control the viewer’s appearance, and view
reports, including reports consumed from an XML Report Web Service.
Using this object model, you can satisfy most basic report integration requirements, but you have no
control over the report itself; you won’t be able to change the record selection for any subreports that
appear in your report, and you won’t have access to modify report elements, such as groups, and sorting
and formula fields.
For more information on working with groups and sorting check out Chapter 3, “Designing Reports.”
You also need to use the Crystal Reports Engine object model (CrystalDecisions.CrystalReports.
Engine) for complete control over your report and the objects and features contained within. Using the
Crystal Reports Engine, you are provided with a rich object model that can be used to modify even the
smallest elements of your report.
You will also need to use this object model if you are using ADO (.NET or Classic ADO) as the datasource for your report (which is covered in Chapter 7, “Working with .NET Data”).
It is important to note that the Crystal Reports Engine object model cannot stand alone; it provides no
way to view a report and relies on the Crystal Reports Windows Forms Viewer to actually view the
report. The functionality covered by the Report Engine is reviewed in Chapter 9, “Working with the
Crystal Reports Engine,” as well as examples of some of the most commonly used features.
Crystal Decisions recommends that you do not overlap these two object models and try to use properties
and methods from both at the same time. An example would be where you are setting a parameter field
value in the Report Engine object model; you wouldn’t also want to try to set a parameter field in the
same report using the Crystal Reports Windows Forms Viewer object model. Try to pick an object model
based on your requirements and stick with it throughout your application.
A good rule of thumb to apply when making a decision about which object model to use is that the
Report Viewer can be used with simple applications (preview, print, export) where you don’t need to
change the report’s design or elements within the report. If you need more granular control over the
report content, you are going to need to use the Report Engine in conjunction with the Report Viewer.
112
Report Integration for Windows-Based Applications
Understanding the Cr ystalDecisions.
Windows.Forms Namespace
The CrystalDecisions.Windows.Forms namespace consists of a number of classes that provide func
tionality specific to viewing reports. As you look through the classes below, you can easily map each
back to some function within the viewer itself. In the section immediately following, we are going to
look at each of these classes in depth and learn what can be done with each.
Class
Description
CrystalReportViewer
Contains the properties, methods,
and events relating to the Crystal
ReportViewer and viewing reports.
DrillEventArgs and DrillSubreportEventArgs
Provides data for the Drill and
DrillDownSubreport events on main
and subreports. Drill events fire when a
user drills down into a group or summary
on a particular report or subreport.
ExceptionEventArgs
Provides data for the HandleException
event. A HandleException event occurs
when there is an error or exception when
setting the report properties or viewing
the report. It is primarily used for trou
bleshooting and error messages.
NavigateEventArgs
Provides data for the Navigate event.
When a user navigates through the pages
of a report, the Navigate event fires each
time. This can be used to notify the users
when they have reached the last page, call
custom actions, and so on.
SearchEventArgs
Provides data for the Search event. The
CrystalReportViewer includes an inte
grated search function to search for values
within a report. The Search event fires
when a user searches for a value, and
could be used to trigger a search of another
report or other report descriptions.
ViewerEventArgs
Provides data for the Viewer events. The
Viewer event fires when some action has
occurred within the viewer itself (for
instance, when the report has been
loaded), and can be used to launch other
actions when the viewer loads.
Table continued on following page
113
Chapter 4
Class
Description
ZoomEventArgs
Provides data for the ViewZoom event.
The ViewZoom event fires when the zoom
is changed on the viewer, and can be used
to suggest the best resolution for a partic
ular report. Also, if you are showing two
reports in viewers side-by-side, it can be
used to synchronize the zoom factor
between the two.
Using the Cr ystal Repor t Viewer
for Windows Forms
For report files that exist externally to your application (for instance, as a standalone report file, created
with either this or a previous version of Crystal Reports), there is not much to creating a simple preview
form for your report.
In this example, we are going to use the viewer_basic project, which you created earlier. In the project,
there should be a default Form1 that we can use. Locate the CrystalReportViewer within the toolbox
and drag or draw the Report Viewer onto your form.
Once we have added the Report Viewer to our form, we now need to set the ReportSource property
to point to the existing report file. The sample files for this chapter include a sample report
(ch4_worldsales.rpt) that we can use. Using the property pages for the Crystal Report Viewer, set
the Report Source property to the location of this report file. For instance, if you have put the sample
files in your own personal directory, enter the full report file name and path,
(C:\CrystalReports\Chapter04\ch4_worldsales.rpt).
You can now run your application, and when you preview the form, your report will be displayed in the
Crystal Reports Viewer, as shown in Figure 4-5.
The viewer interacts with the Crystal Reports Print Engine, runs the report, and displays the results.
From your report preview, you can drill-down into the details, search for a value, print, and export (as
shown in Figure 4-6) without having to do any additional coding.
If you only have one or two reports that you want to integrate into your application and you don’t need
to customize any features at run time, this may be all you need. However, for applications that require a
more sophisticated integration with Crystal Reports .NET, you probably need to look a bit further.
114
Report Integration for Windows-Based Applications
Figure 4-5
Figure 4-6
115
Chapter 4
Adding a Report to Your Application
Still working in the same solution and project as before, we are going to add a Crystal Report to our
application. In the previous walkthrough, we looked at referencing a report that was external to our
application through setting the file path and name. Although this is one method of integrating Crystal
Reports, actually adding the report file itself to our project makes it easier to edit and integrate reports
into our application.
To add our World Sales Report to our project, select Project → Add Existing Item, which will open the
shown in Figure 4-7. Change the drop-down list to Show All Files and specify *.rpt for the file name to
filter the list to show only the available reports.
Figure 4-7
Once you have selected the ch4_worldsales.rpt report, click Open and this report will be added to
your project in the Solution Explorer.
As this report was added to your project, you may have noticed that in addition to the report, another
file with the same name as the report (except for a .vb extension) is also added, as shown in Figure 4-8.
This file is hidden until you select Show All Files from the Solution Explorer.
This additional file is the report source file and contains a report class specific to this report called
ReportDocument that is created automatically for you.
116