oil extraction and analysis phần 11 potx
Bạn đang xem bản rút gọn của tài liệu. Xem và tải ngay bản đầy đủ của tài liệu tại đây (1.57 MB, 48 trang )
Chapter 11
High-Resolution Nuclear Magnetic Resonance and
Near-Infrared Determination of Soybean Oil, Protein,
and Amino Acid Residues in Soybean Seeds
I.C. Baianu
a,b,c
, T. You
a,b
, D.M. Costescu
a,c
, P.R. Lozano
a,b
, V. Prisecaru
a,b
, and
R.L. Nelson
d
a
Department of Food Science and Human Nutrition,
b
AFC-Micro-Spectroscopy Facility,
c
Department of Nuclear, Plasma and Radiological Engineering, and
d
National Soybean
Laboratory, Crop Sciences Department, University of Illinois at Urbana-Champaign, IL 61801
Abstract
We present a detailed account of our high-resolution nuclear magnetic resonance
(HR-NMR) and near-infrared (NIR) calibration models, methodologies, and vali-
dation procedures, together with a large number of compositional analyses for soy-
bean seeds. NIR calibrations were developed based on both HR-NMR and analyti-
cal chemistry reference data for oil and 12 amino acid residues in mature soybeans
and soybean embryos. This is the first report of HR-NMR determinations of amino
acid profiles of proteins from whole soybean seeds, without protein extraction
from the seed. The best results for both oil and protein calibrations were obtained
with a partial least squares regression (PLS-1) analysis of our extensive NIR spec-
tral data, acquired with either a DA7000 Dual Diode Array (Si and InGaAs detec-
tors) instrument or with several Fourier transform NIR (FT-NIR) spectrometers
equipped with an integrating sphere/InGaAs detector accessory. To extend the
bulk soybean samples calibration models to the analysis of single soybean seeds,
we analyzed in detail the component NIR spectra of all major soybean constituents
through spectral deconvolutions for bulk, single, and powdered soybean seeds.
Baseline variations and light-scattering effects in the NIR spectra were corrected
by calculating the first-order derivatives of the spectra and the multiplicative scat-
tering correction (MSC), respectively. The single soybean seed NIR spectra are
broadly similar to those of bulk whole soybeans, with the exception of minor
peaks in single soybean NIR spectra in the region from 950 to 1000 nm. On the
basis of previous experience with bulk soybean NIR calibrations, the PLS-1 cali-
bration model that we developed for single soybean seed analysis was selected for
protein, oil, and moisture calibrations. To improve the reliability and robustness of
our calibrations with the PLS-1 model, we employed standard samples with a wide
range of soybean constituent compositions: from 34 to 55% for protein, from 11 to
22% for oil, and from 2 to 16% for moisture. Such calibrations are characterized
Copyright © 2004 AOCS Press
by low standard errors and high degrees of correlation for all major soybean con-
stituents. Moreover, we obtained highly resolved NIR chemical images for selected
regions of mature soybean embryos that allow for the quantitation of oil and pro-
tein components. Recent developments in high-resolution FT-NIR microspec-
troscopy extend the NIR sensitivity range to the picogram level, with submicron
spatial resolution in the component distribution throughout intact soybean seeds
and embryos. Such developments are potentially important for biotechnology
applications that require rapid and ultrasensitive analyses, such as those concerned
with high-content microarrays in genomics and proteomics research. Other important
applications of FT-NIR microspectroscopy are envisaged in biomedical research
aimed at cancer prevention, the early detection of tumors by NIR-fluorescence, and
identification of single cancer cells or single virus particles in vivo by superresolution
microscopy/microspectroscopy.
Introduction
Soybeans are the major source of plant protein and oil in the world. Commercial
soybean varieties usually contain ~40% protein and ~20% oil (on a dry weight %
basis). Although there remains a strong economic incentive to develop cultivars
with high protein and oil contents while maintaining a competitive yield, progress
has been slow. Effective breeding techniques require accurate, inexpensive, and
reliable soybean compositional analysis. Certain areas of breeding and selection
research would also benefit from single soybean seed analysis (1). Conventional
compositional analysis methods such as the Kjeldahl method for protein measure-
ment and the ether extraction method for oil fraction measurements are time-con-
suming, expensive, and impractical for measurements on large numbers of soybean
samples required for molecular genetic mapping and other selection and breeding
studies. In addition to problems such as low speed and high cost, wet-chemistry
methods are destructive and rather inaccurate for single-seed analysis, with the
notable exception of the extracted protein determination by the method of Lowry et
al. (2).
Emerging practical solutions to these problems are based on near-infrared
reflectance spectroscopy (NIRS). When adequately calibrated with reliable primary
data, NIRS generates accurate results and is less expensive than conventional or
wet-chemistry composition measurement methods such as those currently adopted
by the American Oil Chemists’ Society (AOCS). A wide range of grains and
oilseeds has been analyzed by NIRS techniques with varying degrees of success.
For soybeans, early reports showed that dispersive/filter-based near-infrared (NIR)
instruments can be utilized for the determination of protein, oil (3), and moisture
(4). However, in recent years, significant improvements in NIR instrument perfor-
mance were achieved through novel designs. A recent improvement in the design
of dispersive instruments allows for high spectral acquisition speeds through the
utilization of dual diode array NIR detectors, such as those commercially available
Copyright © 2004 AOCS Press
from Perten Instruments (Springfield, IL). The DA-7000 NIR spectrometer model
(made by Perten Instruments) employs a dual diode (Si/InGaAs) array detector, as
well as a stationary diffraction grating, and is capable of spectral collection speeds up
to 600 spectra/s (5) in the range from 400 to 1700 nm. In addition to the recent devel-
opment of diode array techniques for dispersive instruments, Fourier transform (FT)
technology is currently employed in NIR instruments to overcome most of the disad-
vantages of classical dispersive NIR instruments that employ moving gratings and
have low acquisition speed and limited NIR resolution. Commercial FT-NIR instru-
ments are available from manufacturers such as Thermo Nicolet (Madison,WI),
Perkin-Elmer (Shelton,CT) and Bruker (Madison,WI). The major advantages of FT-
NIR and dual diode array instruments over moving grating dispersive instruments are
their higher spectral resolution, higher and uniform wavelength accuracy, and also
high speed of spectral acquisition/data collection. High spectral resolution is important
because it facilitates long-term calibration robustness and improved separation of the
sample constituents; it may also reduce the total number of samples required for cali-
bration development because of the higher spectral information content compared
with the other NIR instrument designs. High wavelength accuracy is critical when a
calibration developed on a specific NIR instrument must be transferred to another
instrument and when separation of minor component constituents is desired.
Wavelength accuracy is also important for signal averaging, which is essential for
samples with a low signal-to-noise ratio (S/N), as is the case of single seeds.
Although most NIRS applications are currently focused on bulk sample analysis,
some recent studies on transmission instruments attempted preliminary estimates of
single-seed composition, such as the moisture measurement of single soybean seeds
with a Shimadzu W-160 dual-beam spectrometer (6) and the oil measurement of sin-
gle corn kernels with an Infratec model 1255 spectrometer (7). These preliminary
reports indicated the potential of NIRS for single-seed analysis. In addition to trans-
mission instruments, NIR reflectance instruments were also applied recently to single-
seed analysis, such as an attempt to generate color classifications (8) and an attempt to
perform computational averaging of single wheat kernel spectra for compositional
analysis (9). Although some progress with single-seed analysis by NIR has already
been reported, the potential advantages of novel NIR instrument designs such as the
dual diode array and FT techniques have not yet been fully exploited. To take advan-
tage of novel instrument designs, both a dual diode array instrument (DA-7000 by
Perten Instruments) and an FT instrument (Spectrum One NTS, manufactured by
Perkin-Elmer) were calibrated for both bulk and single soybean seed compositional
analysis. In recent studies, we developed accurate, reliable, and robust NIR calibra-
tions for both bulk and single-seed composition analyses that facilitate novel breed-
ing/selection techniques and improve breeding efficiency.
On the other hand, previous NIRS attempts at calibrations for amino acid
residues of soybean proteins in bulk soybean seeds and powdered soybean seeds
suffered until recently from two major drawbacks: the employment of primary
methods involving extensive extraction and acid hydrolysis of soybean proteins
Copyright © 2004 AOCS Press
from soybean seeds, and the low spectral resolution of the NIR spectra of soybean
proteins and their amino acid residues. A radically different approach that circum-
vents such problems is afforded by high-resolution carbon-13 (
13
C) NMR quantita-
tive analysis of soybean protein peaks corresponding to specific
13
C sites of select-
ed amino acid residues of unhydrolyzed and unmodified soybean proteins in either
powdered or intact soybean seeds. Both the advantages and limitations of our
novel approach to amino acid profiling and protein compositional analysis of soy-
bean seeds will be discussed, and the possible extension of this approach to devel-
oping NIRS calibrations based on the high-resolution NMR primary data will be
outlined briefly. A comparison will also be presented between the results obtained
with our novel NMR approach for amino acid profiles of soybean seed proteins
and the corresponding data obtained through soybean protein extraction, derivati-
zation, and acid hydrolysis, followed by ion exchange chromatography and high-
performance liquid chromatography (HPLC).
An attempt will be made to present a concise overview of our recent NIR and
NMR methodologies and compositional measurements for a wide range of selected
soybean accessions, including over 20,000 developmental soybean lines and 2000
exotic soybean germplasm accessions from the USDA Soybean Germplasm
Collection at the National Soybean Research Laboratory at UIUC (l.
uiuc.edu).
Principles of Spectroscopic Quantitative Analyses
To achieve a successful quantitative compositional analysis by spectroscopic tech-
niques, one requires a clear understanding of the underlying spectroscopic principles.
A purely statistical approach, without such a basic understanding, is more likely to
result in spurious numerical data sets that do not correspond to physical reality.
Principles of NIR Spectroscopy
IR/NIR absorption spectra occur because chemical bonds within molecules can
vibrate and many molecular groups can rotate, thus generating series of different
energy levels between which rapid, IR (or NIR)-induced transitions can occur.
According to standard quantum mechanics, the vibro-rotational energy levels of a
molecule can be approximately calculated with the following equation:
E
NIR
= E
rot
+ E
vib
+ E
anh
= j(j + 1)Bhc + [1 ( x(n + 1/2)]hv [1]
where j is the rotation quantum number 0, 1, 2, 3, ; n is the vibration quantum
number 0, 1, 2, 3, ; E represents the energy eigenvalues; and x is the unharmonic
constant.
The mid- and far-IR induced transitions occur mainly between neighboring
energy levels (∆n = ±1). Such transitions are normally referred to as fundamental
transitions. Absorptions caused by fundamental transitions of most molecules
Copyright © 2004 AOCS Press
occur in the mid- and far-IR range of wavelengths (>2500 nm). In addition to the
fundamental transitions, molecules can also be excited from the 0 energy level to
energy levels beyond the first energy level (∆n = ±2, ±3) with lower probabilities,
following Boltzmann statistics. Such transitions are referred to as overtones.
Absorptions caused by overtones of chemical bonds with low reduced mass (such
as the O–H, N–H or C–H bond) take place in the NIR region (typical wavelengths
are between 700 and 2500 nm). Therefore, the resulting NIR spectra of liquids or
solids appear fairly broad and have quite low resolution compared with mid-IR
spectra, but have higher band separation than visible absorption, or fluorescence
spectra that correspond to electronic transitions in molecules. In addition to over-
tones, NIR transitions corresponding to (or localized at) different chemical bonds
can couple and produce a combination band of such fundamental transitions. NIR
absorption corresponding to combination bands of specific chemical bonds with
low reduced mass (such as, O–H, N–H and C–H) also take place in the NIR region
(10,11). When the sample to be measured is exposed to a beam of NIR light, the
beam interacts with the sample in a variety of modes, such as absorption, reflec-
tion, transmission, scattering, refraction and diffraction. From an analytical stand-
point, the light absorption is the important process because it is directly related to
constituent concentrations, as described by the Lambert-Beer’s law:
A = ε ⋅ L ⋅ C [2]
where A is the “true” absorbance, ε is the extinction coefficient of the analyte that
absorbs, L is path length of light through the analyzed sample, and C is the analyte
concentration. The “true” absorbance of a sample, however, is often quite difficult
to measure directly without first applying appropriate corrections for the other light
interactions that occur within the sample, especially in inhomogeneous solid or tur-
bid, liquid samples. In practice, the absorption is often calculated indirectly from
the measurement of the reflectance (R), (as A = log 1/R) because reflectance can be
readily measured even for thick samples, with the exception of those complex sam-
ples that possess a composite structure, such as thick, multiple layers of different
composition. The calculated absorbance is usually referred to as the “apparent
absorbance,” and it can be significantly affected by specular reflection and light
scattering even in the case of thin samples. Because of light scattering and specular
reflection effects, spectral preprocessing and corrections are always required to
obtain reliable NIR quantitative determinations of composition for samples as
complex as whole seeds or intact soybean embryos.
Principles of Nuclear Magnetic Resonance Spectroscopy
High-resolution nuclear magnetic resonance (HR-NMR) spectroscopy is a power-
ful tool for both qualitative and quantitative analysis of foods and biological sys-
tems (12). NMR measures the resonant absorption of radio-frequency (rf) waves
by the nuclear spins present in a macroscopic sample when the latter is placed in a
Copyright © 2004 AOCS Press
strong and uniform/constant magnetic field, H
0
. The magnetic moments µ of the
nuclei present in the sample interact with such a strong, external magnetic field,
and the magnetic interaction energy is simply:
E
M
= –µ⋅ H
0
[3]
The magnetic moments of the nuclei were shown to be able to take only certain
discrete values, that is, they are quantized and proportional to the total angular
moments, J:
µ = γJ, with J = (h/2π)I [4]
where γ is the giromagnetic ratio characteristic of each type of nucleus, and I is a
dimensionless angular momentum operator whose eigenvalues are called “spin num-
ber,” or simply “spin,” an intrinsic quantum mechanical property of a nucleus that is
observed only when there is an external magnetic field present, and when the spin
number is different from zero. The I-operator component along the NMR probe coil
axis, x, is I
x
and it has m allowed values that are called its eigenvalues, or spin values.
Such allowed m values have the form I, (I – 1), 0, –I). Therefore, the nuclear spin
energy levels derived from Equations 3 and 4 are:
E
m
= –m γ(h/2π)H
0
[5]
or in frequency (ν) units:
hν = γ(h/2π)H
0
[6]
where m = I, (I – 1), , (–I).
Allowed NMR transitions induced by resonant rf irradiation in the presence of a
constant external magnetic field H
0
will occur only for:
∆m = ±1 [7]
The external magnetic field H
0
polarizes the nuclear spins so that at thermal equilibri-
um, there is an excess of nuclear magnetic moments precessing, or rotating at a con-
stant rate, around the direction of the external magnetic field. The net result is a small,
macroscopic magnetization of the sample that precesses around the magnetic field
direction, z. A resonant rf pulse will tilt this precession axis and will also induce tran-
sitions between the energy levels that satisfy Equation 6 (i.e., single quantum transi-
tions). Such transitions can be observed as NMR absorption peaks in the correspond-
ing NMR spectrum. The pulsed NMR signal, which is acquired in the time domain,
has been called the free induction decay (FID) because it is the result of a voltage
induced by the nuclear spin magnetization of the sample in the coil of the NMR probe
as a result of the fact that the precessing magnetization produces a variable magnetic
Copyright © 2004 AOCS Press
flux through the NMR probe coil, which alternates in phase with the precessing mag-
netization (13). The FID signal decays with time as the nuclear spins lose phase coher-
ence during their precession around the external magnetic field axis (along the z-direc-
tion). The FID is then digitized at a series of points in time that are arranged at regular,
small intervals, and it is stored in digital form in dedicated computer memory.
Increasing the number of digitization points proportionally increases the spectral reso-
lution of the NMR absorption spectrum when the computer transforms the digitized
FID signal by fast Fourier transformation (FFT).
Because the various types of chemical bonds or chemical groups present in a
material sample correspond to different electron density distributions surrounding the
nuclear spins of the atoms involved, such nuclear spins experience different degrees
of shielding from the external magnetic field, which is caused by the specific elec-
tron densities involved in chemical bonds or groups. As a result, the nuclear spins
from distinct chemical groups resonate at different radio frequencies, corresponding
to the different degrees of shielding of such nuclear spins from the external magnetic
field by the surrounding electron orbitals. Therefore, a number of such distinct NMR
absorption peaks are observed that differ through their specific resonance frequencies
by a value defined as the “chemical shift,” proportional to the amount of electron
orbital shielding surrounding each nuclear spin present. Various chemical groups will
thus exhibit a number of characteristic resonance peaks with chemical shifts specific
to those chemical groups. For convenient comparison of HR-NMR spectra obtained
with different instruments utilizing magnets of different strengths, the chemical shift
is defined as the ratio of the local magnetic field present at the observed nucleus to
the full strength of the external, uniform and constant magnetic field. Because the
NMR measurements are usually expressed in frequency units, this definition of the
chemical shift, δ, can be also expressed as:
δ = (ν
Loc
– ν
ST
)/ν
ST
[8]
where ν
Loc
is the nuclear spin resonance frequency of the nucleus in the sample
and ν
ST
is the resonance frequency for a known standard chosen as a reference,
such as tetra-methylsilane (CH
3
)
4
- Si, for example, which is the selected standard
for both
1
H and
13
C NMR. This definition makes the chemical shift independent of
the strength of the external magnetic field utilized by the HR-NMR instrument and
allows for a direct comparison between spectra obtained with very different HR-
NMR instruments. Very detailed, precise theoretical treatments of the NMR
absorption and related processes are available in “standard” textbooks (14,15).
Simplified, instrument- or application-oriented textbooks (16,17) and reviews
(12,18) are also available that facilitate the effective use of a wide variety of such
chemically selective (and sophisticated) HR-NMR techniques by the interested
analytical chemists, physical chemists, organic chemists, biochemists, or research
scientists in other applied fields. As in the case of NIR spectroscopy, quantitative
analyses can be performed nondestructively, quickly and routinely. The most widely
Copyright © 2004 AOCS Press
employed HR-NMR techniques for quantitative analyses are based on the fact that
the areas under the NMR absorption peaks corresponding to a specific component
are directly proportional to the concentration of that component in the sample. Two
of the most widely detected nuclei in NMR experiments are
1
H and
13
C.
13
C is a
nuclear isotope of carbon that is naturally present (but with a relatively low abun-
dance of ~1%) in fatty acids, lipids, and amino acids in soybean seeds. Compared
with the NMR of the naturally abundant
1
H, the
13
C NMR has relatively low sensi-
tivity because of both its 1% natural abundance and its lower resonance frequency
(one fourth of the
1
H resonance frequency). Furthermore, in static solids, there is a
substantial line broadening caused by the chemical shift anisotropy (CSA) and by
magnetic dipolar interactions. In liquids, very rapid molecular tumbling averages the
chemical shift anisotropies, resulting in HR-NMR spectra with very sharp and well-
resolved peaks. In static solids, chemical shift anisotropies remain as “chemically
intrinsic” features that can disguise valuable compositional information that could
otherwise be extracted from the isotropic chemical shifts. As a result, the
13
C NMR
spectra of static solid powders are both broad and unresolved. Consequently, for the
investigation of soybean solid samples, one must employ high-resolution NMR tech-
niques specially designed for solids that overcome the low sensitivity and line-broad-
ening problems. These methods, jointly labeled as “solid-state” NMR (SS-NMR)
techniques, are employed to minimize first-order anisotropic nuclear interactions and
to increase the S/N either by rapid sample spinning in the external magnetic field
and/or by employing special rf pulse sequences that considerably reduce magnetic
dipolar interactions. Some of the more “popular” techniques in this SS-NMR group
among biochemists, analytical/organic chemists and physical chemists are the fol-
lowing:
• The magic angle spinning (MAS) technique in which the whole sample is spun at
an angle of 54° 44′ with respect to the external magnetic field, and at a rate equal
to or greater than the dipolar line width expressed in frequency units.
• Multiple-pulse sequences (MPS) employed as composite pulse sequences that
achieve homonuclear and/or heteronuclear decoupling.
• Cross-polarization (CP) achieves a transfer of spin-polarization from the abun-
dant nuclear spin population (for example,
1
H) to the rare and lower gyromag-
netic ratio (e.g.,
13
C) nuclear spin population, thus enhancing the S/N for the
rare nucleus.
Experimentation
NIR Instrumentation
Because sample absorption data are difficult to measure directly, they are mea-
sured indirectly through reflection or transmission. NIR can be employed, howev-
er, in either the reflectance mode or the transmission mode. NIR reflectance instru-
ments measure the amount of NIR radiation reflected from the sample at different
Copyright © 2004 AOCS Press
wavelengths. NIR transmission (NIT) instruments, on the other hand, measure the
amount of NIR radiation transmitted through the sample at different wavelengths.
Based on the mechanism of collecting optical data at different wavelengths, NIR
instruments can also be categorized as follows: interference filter instruments,
moving diffraction grating instruments, fixed grating instruments, acousto-optical
tunable filters (AOTF) instruments, diode array NIR (DA-NIR) instruments, and
interferometer-based instruments such as FT-NIR. Filter-based NIR instruments
are usually the most economical. The number and position of the filters are
designed and optimized for certain specific types of samples, and it is generally
difficult to expand such instruments to other sample types. Interference filter-based
NIR instruments work primarily in the transmission mode, such as the Zeltex,
(ZX800 and the ZX50 model) instruments (manufactured by Zeltex, Hagerstown,
MD, ). The major limitation of such interference filter-based
instruments is that spectra are collected at only a few preselected wavelengths that
are designed and optimized only for the major component analysis of bulk grain
and oilseed samples. For the analysis of minor components such as isoflavones,
more flexible and powerful NIR instruments such as the DA-NIR or the Fourier
transform NIR (FT-NIR) instruments are required.
To collect spectral data for a large set of different wavelengths, NIR radiation
can be dispersed through diffraction gratings so that signals with different wave-
lengths are separated, and the detector can detect signals at an individual wavelength.
In the conventional configuration in which a single detector is used, the diffraction
grating system has to be rotated gradually to project onto the detector signals of dif-
ferent wavelengths. Such systems are usually referred to as moving grating systems.
A major limitation of such moving grating systems is that the diffraction grating con-
tains a moving part, which makes it difficult to obtain reproducible scans and also
negatively affects the wavelength accuracy. Novel dispersive NIR instruments solve
this problem by employing multiple detectors, such as diode array detectors, to detect
NIR signals at different wavelengths simultaneously. In such instruments, the NIR
radiation can still be dispersed through diffraction gratings. However, signals at dif-
ferent wavelengths are projected onto a stationary array of detectors, and the signals
are detected simultaneously for different wavelengths. For this reason, it is no longer
necessary to move the diffraction grating system. Such instruments are referred to as
stationary grating systems. Because no moving grating is involved, reproducibility
and wavelength accuracy/uniformity throughout the spectral range are markedly
improved. Furthermore, the spectral acquisition speed is also improved dramatically
because spectral data at different wavelengths are collected in parallel by such sta-
tionary grating systems, as opposed to the sequential data collection by instruments
operating with moving gratings/monochromators. Typically a moving grating sys-
tem takes ~30 s to scan an NIR spectrum at moderate resolution (i.e., 3 nm),
whereas a diode-array stationary grating instrument is capable of acquiring hun-
dreds of NIR spectra in just 1 s (19) at comparable resolution throughout the entire
NIR spectrum.
Copyright © 2004 AOCS Press
NIR Spectra Preprocessing
NIR quantitation using Lambert-Beer’s law (Eq. 2) requires absorbance data to be
used for the concentration calculation. However, most NIR instruments do not
measure absorbance directly. Instead, they measure NIR reflectance from, or trans-
mittance through the sample. The measured reflectance or transmittance data are
then converted to absorbance data, which are normally referred to as apparent
absorbance, to be differentiated from the “true” absorbance. The apparent
absorbance can be significantly affected by a variety of effects, such as specular
reflection, light scattering, or baseline shifts. To improve the accuracy and reliabil-
ity of NIR calibrations, NIR spectra usually have to be corrected for such effects
before calibration model development. In fact, it was reported that light scattering
and baseline shifts may introduce more spectral variations than do the constituent
contents (20). Because a calibration is the mapping between the spectral data and
the constituent contents, the regression and calculations involved in the calibration
development will be dominated by light scattering and specular reflection effects,
instead of constituent content variations, if light scattering and specular reflection
effects are not corrected first. As a result, any calibration obtained without spectral
preprocessing is likely to be inaccurate, unreliable, or both (21).
Specular reflection effects can appear as a nonlinear baseline shift across the
entire NIR spectrum. A semi-empirical approach for correcting the baseline shifts
caused by specular reflection involves the definition of a set of user-selected base-
line points. A baseline curve is then defined by such selected points through fitting
a spline function to the points. The procedure is readily implemented with the
Perkin-Elmer “SpectrumONE” program in a user-interactive mode that also allows
for the subtraction of the fitted spline function/baseline curve from the NIR raw
spectrum of the sample. An algorithm for derivative calculations begins with a
least-squares linear regression of a polynomial of degree k over at least (k + 1) data
points. The derivatives of an NIR spectrum are then calculated as the derivatives of
a best-fitted polynomial. The Savitzky-Golay algorithm was proven to be very
effective and the S/N is preserved in the calculated derivative spectrum.
In addition to baseline shift effects caused by the specular reflection, the elec-
tronic noise, and the detector variations, light scattering is another important
source of spectral variation. According to modern quantum electrodynamics theory
(22), as well as Rayleigh’s simplified theory of light scattering (23), when a beam
of light interacts with molecules in a material, the incident light beam is partially
scattered by such molecules in addition to being partially absorbed. The
absorbance is linearly related to the concentrations of various components in the
sample, according to Equation 2. On the other hand, light scattering is caused
mainly by sample inhomogeneities, (e.g., the difference of scattering coefficients
between different parts of the same sample), such as those caused by pores, a dis-
tribution of particle sizes and matrix “texture.” The scattering coefficient is
inversely proportional to the particle size of the sample, and can also be affected
by variations in the packing density from sample to sample (24,25). According to
Copyright © 2004 AOCS Press
the Kubelka-Munk theory, light scattering affects the apparent absorbance in a
multiplicative manner. Therefore, light-scattering effects cannot be effectively cor-
rected through simple, linear correction algorithms (26). To correct for multiplica-
tive light-scattering effects, Geladi et al. (27) proposed a semi-empirical approach
called the multiplicative scattering correction (MSC); it is currently the most popu-
lar method for preprocessing NIR spectra (28). MSC begins by calculating the
average spectrum of the whole set of standard samples, and then attempts to deter-
mine the multiplicative parameter (scale factor) as well as the additive parameter
(shift factor) for each spectrum through a linear regression of the sample spectrum
against the mean spectrum. In some applications, the MSC approach was very
effective for correcting spectral variations caused by light scattering; as a result of
MSC, both the accuracy and reliability of NIR analysis were significantly
improved compared with calibrations based on “raw” (uncorrected) spectra. The
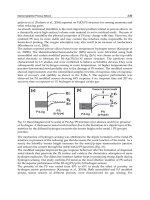
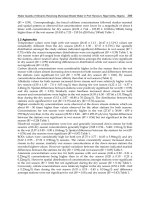
effects of MSC applied to raw NIR spectra of single soybeans are illustrated in
Figures 11.1 and 11.2, and are quite substantial for both dual diode array (Fig.
11.1B) and FT-NIR spectra of soybeans (Fig. 11.2B).
NIR Calibration Models
After careful selection of the standard samples and accurate measurements of the
composition of the standard samples for reference values, NIR spectra can be col-
lected for such standard samples with state-of-the-art NIR instruments. With prop-
er spectral preprocessing to correct for specular reflection and light-scattering
effects, the corrected NIR spectra of the standard samples can then be employed
for calibration development to predict unknown samples. Calibrations are devel-
oped through regressions of the NIR spectral data against the reference values of
constituent concentrations; in practice, this has been done primarily through
regressions of apparent absorbance data against the sample concentration data.
NIR instruments measure optical data such as reflectance from, or transmit-
tance through samples. The reflectance and transmittance data are usually convert-
ed into apparent absorbance. To predict the contents of components to be measured
from the optical data, a calibration must first be developed. After adequate spectral
data preprocessing, the calibration can be developed through regression of the cor-
rected NIR spectral data against the reference constituent contents. As shown in
the previous section on the principles of NIR, most “optical” spectroscopy quanti-
tative analysis methods, including NIR, are based on Lambert-Beer’s law, which is
recast here into a form that specifies explicitly the quantities that are wavelength
dependent:
a
λ
= ε
λ
⋅ l ⋅ c [9]
where a
λ
is the absorbance at wavelength λ, c is the concentration of the compo-
nent (analyte) to be measured, ε
λ
is the absorptivity of the component at the specif-
ic wavelength λ, and l is the path length. Utilizing Equation 9, a direct approach to
Copyright © 2004 AOCS Press
soybean NIR protein calibrations might attempt a univariate (linear) regression of
the measured absorbance at an appropriately selected wavelength against the pro-
tein content of the standard soybean samples. However, because the NIR spectra of
soybeans are very complex and each absorbance band often contains peaks from
several different components, it remains difficult, if not impossible, to select any
specific wavelength that would be “sufficiently” free of interference from other
Wavelength, nm
Wavelength, nm
Apparent absorbanceApparent absorbance
Fig. 11.1. Overlay plot of DA-NIR spectra of single soybean seeds obtained with the
Perten DA-7000 instrument. (A) Before MSC; (B) after MSC. (All measurements were
carried out in quadruplicate.)
A
B
Copyright © 2004 AOCS Press
components to allow reliable calibration development. One can solve this problem
by taking advantage of another part of Lambert-Beer’s law which simply states
that the absorbance values of multiple components are additive at any given wave-
length. Consequently, an improved calibration model can be specified as:
a
λ
= ε
iλ
⋅ l ⋅ c
i
+ ε
jλ
⋅ l ⋅ c
j
+
+ ε
zλ
⋅ l ⋅ c
z
[10]
Wavenumbers (cm
–1
)
Wavenumbers (cm
–1
)
Apparent absorbance
Apparent absorbance
Fig. 11.2. Overlay plot of FT-NIR spectra of single soybean seeds obtained with the
Perkin-Elmer Spectrum ONE instrument. (A) Before MSC; (B) after MSC. (All measure-
ments were carried out in quadruplicate.)
A
B
Copyright © 2004 AOCS Press
where a
λ
and l have the same meaning as in the previous equation, ε
iλ
is the
absorptivity, c
i
is the concentration of component i, ε
jλ
and c
j
are defined as before
for component j, and so on, for all of the components present in the sample. With
this model, one has to measure the absorbance for at least two different wave-
lengths if there are two interfering components to be measured, and a multivariate
regression procedure would have to be employed. Unfortunately, even such a mul-
tivariate model is of little practical use for NIR calibration development. The major
drawback of such a model is that it would require knowledge of the complete com-
position (concentration of every component) in the calibration samples, whereas in
most situations one may be interested only in certain components.
One solution to this problem is obtained either by rearranging Lambert-Beer’s
equations as follows:
c = a
λ
/(ε
λ
⋅ l) [11]
or by combining the absorptivity coefficient (ε) and the path length (l) into a single
constant, so that it takes the simpler form:
c = p
λ
⋅ a
λ
[12]
For complex samples such as soybean seeds, where most major components do
interfere with each other, absorbance data obtained at more than one wavelength
are often utilized in practice, and the above model is extended to all such selected
wavelengths:
c = a
λ1
p
λ1
+ a
λ2
p
λ2
+ + a
λm
p
λm
[13]
The above model is known as the inverse least squares (ILS), or the multiple linear
regression (MLR) model, and is widely applied in conjunction with filter-based
NIR instruments that collect spectral data at only a few preselected wavelengths.
For either DA-NIR or FT-NIR instruments, which collect spectral data for hun-
dreds of different wavelengths, it is impractical to apply such an MLR model
directly to all of the acquired data points throughout the entire spectral range
because such a procedure would require the calculation of a total of m regression
parameters (usually several hundreds or thousands) with such an MLR model; this
would, therefore, require that a minimum set of m standard samples (several hun-
dreds to thousands) be available for the calibration training set. One solution to this
potentially severe problem would be to apply the MLR model to only a small num-
ber of spectral data at preselected wavelengths, but such number must not exceed
the number of standard samples employed for calibration because otherwise there
would be some undetermined variables. The preselection of such wavelengths is
critical to building an accurate and robust calibration, but it is also quite difficult to
accomplish. One may know which wavelength regions should be included from the
Copyright © 2004 AOCS Press
corresponding spectra of the pure components. The selection of the exact wave-
lengths for calibration from such regions can still be difficult because most modern
instruments have high, or very high resolution; therefore, even in a narrow spectral
region, there will be a large number of points present.
Another approach is to specify the most important region(s), based either on
the pure-component spectra or the deconvolved spectra of the standard samples.
Then, one could utilize a computer algorithm to select the rest of the wavelengths
for the calculation, such as in the case of the stepwise multiple linear regression
(SMLR) procedure provided by the TQ Analysis software package (Thermo
Nicolet). Even with the SMLR approach, if the number of data points included in
the model is not carefully selected, overfitting may readily occur (that is, the cali-
bration model would have utilized too many factors); as a result, the calibration may
fit the standard samples perfectly, but it will fail to predict samples that are not in the
calibration training set. An improved, advanced approach utilizes a statistical factor
analysis method, which leads to two other directly related NIR calibration models:
the principal component regression model (PCR) and the partial least squares
model (PLS). Both the PCA/PCR and the PLS model are based on factor analysis,
which was developed to solve problems that have many factors; such factors may
also happen to be highly colinear when the MLR is overfitting. The principle on
which both PCR and PLS are based stems from the observation that although there are
usually many different variations that make up a spectrum (such as interconstituent
interactions, instrument variations, or differences in sample handling), after proper
data pretreatments (such as baseline corrections, light-scattering corrections, e.g.,
MSC), the largest variations remaining in the calibration set would be due only to
the chemical composition variations of the standard samples. The main purpose of
both PCR and PLS is then to calculate a set of “variation spectra,” which repre-
sents only the variations caused by composition. Such calculated “variation spectra”
are sometimes called loading vectors, principal components, or more frequently, fac-
tors. The calculation of such spectra usually involves an iterative process that manip-
ulates n-samples of proper numerical values called “eigenvectors”; for this reason,
PCR and PLS algorithms are also called “eigenvector methods.” Once the factors
are calculated, they are utilized instead of the raw spectra for building the calibra-
tion model; therefore, the possibility of overfitting can be minimized by choosing
the correct number of factors. Although the concepts of PLS and PCR are similar,
the approaches to the calculation of the factors (loading vectors) are quite different.
The PCR algorithm calculates the factors independently of the concentration infor-
mation, whereas the PLS algorithm utilizes both the concentration and spectral
information of the calibration set to calculate the factors.
In general, the PLS method is considered to be more reliable than PCR. In
addition to the numerical calculation of regression parameters for the calibration,
the PLS algorithm also provides qualitative information for model validation,
through the first loading vector, which is usually a first-order approximation to the
pure-component spectrum (29,30). Although PLS is an advanced multivariate regres-
Copyright © 2004 AOCS Press
sion algorithm and has been widely applied for NIR calibration development, care
still must be taken when applying PLS to NIR data of complex samples such as
soybeans. Unlike MLR, which usually requires manually selecting the wavelengths
or spectral regions for the calculation, PLS has the intrinsic ability to automatically
build calibration models over the entire spectral range, thus eliminating the
requirements of either manual selection of wavelengths or spectral regions.
Although this feature might be an advantage for most types of samples, it may lead
to a severe limitation of the results obtained with the PLS in the special case of
samples that happen to have a very high degree of correlation between two or more
component concentrations. In such special cases, the first-order loading vectors of
the two correlated components may look similar, and the calibration would remain
unreliable regardless of the algorithm(s), models, or method(s) employed for cali-
bration. In special cases, one might be able to minimize this problem by manually
selecting for the PLS calculation those spectral regions in which the pure-compo-
nent absorption dominates (an approach reminiscent of MLR).
The computations of PLS and PCR are usually carried out with professional
chemometrics software. There are currently several chemometrics software programs
available for calibration development with PLS and PCR, such as the ThermoGalactic
Graphic Relation Array Management System (GRAMS/32) (Salem, NH, www.galac-
tic.com), ThermoNicolet TQ Analyst (www.nicolet.com), Perkin-Elmer Quant+
(www.perkin-elmer.com), and Bruker OPUS (www.bruker.com). The GRAMS/32
software package is a professional spectroscopic analysis software package that sup-
ports light scattering corrections as well as PLS and PCR regression algorithms. The
calibration results, including correlation plots, loading spectra, and SECV plots, can be
exported to Microsoft Office subprograms such as Excel. It can also be expanded by
allowing the user to write special programs in the Array Basic programming language.
The TQ Analysis software package, on the other hand, provides several calibration
features that are user friendly. It supports light-scattering corrections (MSC), as well as
spectral smoothing, and also includes the options of CLS, MLR, PCR, and PLS regres-
sion analyses. Even though the TQ program is not as expandable as GRAMS/32, it is
specifically designed and optimized for FT-NIR instruments. In our NIRS and FT-NIR
studies, both the GRAMS/32 and the TQ Analyst were routinely employed.
NMR Techniques for Oil Determination in Soybean
Simple One-Pulse (1PULSE) High-Resolution NMR. The simple, 1PULSE
1
H
NMR method provides a direct means for measuring the oil content in somatic
soybean embryos and soybean oil samples. This method uses only one radio fre-
quency (rf) pulse during each acquisition cycle (Fig. 11.3). The rf pulse excites all
1
H nuclei in a sample, and a characteristic
1
H NMR time-domain signal is
observed. The single pulse employed by this method has a defined width that max-
imizes the initial amplitude of the NMR signal; this pulse width is the time interval
during which the resonant rf pulse of average power pw is applied to the sample,
Copyright © 2004 AOCS Press
resulting in a 90° flip of the nuclear spin magnetization from the direction of the
constant, external magnetic field.
The hydrogen nucleus (
1
H), with a spin of 1/2, is usually selected for NMR
measurements because it is the most abundant isotope present in natural biomateri-
als. The rf pulse selected for HR-NMR has a characteristic resonance frequency,
which is proportional to the magnetic field strength employed by the instrument. In
our measurements, a Varian U-400 spectrometer model was employed, and the
applied rf pulse was at the
1
H resonance frequency of 400 MHz, in an external
magnetic field of 9.4 T.
In the case of our high-resolution NMR studies of oil in mature soybean seeds
and embryos, the number of selected points was 65,536. The FFT of an FID pro-
duces an HR-NMR spectrum that represents the variation of the NMR absorption
intensity with the nuclear spin resonance frequency. To avoid the possibility of rf
saturation, nuclear spins must be allowed to relax (that is, without any additional rf
excitation being applied) for a significant interval of time called delay time, or d
2
,
until the next 90° rf pulse is applied. For a low-viscosity liquid that does not con-
tain either paramagnetic or ferromagnetic species, the length of time required for
the nuclear spin relaxation to occur is at least on the order of the reciprocal of the
half-height linewidth for the sharpest observed absorption peak in the HR-NMR
spectrum of the liquid. For typical HR-NMR studies, the line broadening (lb) is
selected to be less than ~0.2 Hz, and therefore the delay time, d
2
, required for
nuclear spin relaxation, is typically on the order of 5 s or longer. To compensate
for the very weak NMR absorption signal of oil from the soybean seed or embryo
samples, the S/N in the oil spectra was improved more than 20-fold through the
accumulation of at least 400 transients, whereas the gain parameter of the rf pream-
plifier and receiver was held constant during all HR-NMR acquisitions.
Low-Resolution NMR for Oil Determination in Seeds: AOCS Recommended
Method Ai 3–75 for Oil Content. The time-domain pulsed NMR method is an
AOCS recommended standard method (31) for rapid and simultaneous determina-
tions of oil and moisture contents of oilseeds. This method can accurately measure
Fig. 11.3. Simple one-
pulse sequence for high-
resolution NMR analysis
of oil.
Copyright © 2004 AOCS Press
oilseed samples with <10% moisture. Drying is stated to be necessary for the high-
er moisture samples. The method usually involves the following steps:
1. Place the test sample into the magnetic field of the NMR spectrometer.
2. Apply an intense 90° rf pulse to excite all of the hydrogen nuclear spins.
3. Record the FID after the 90° rf pulse. The maximum amplitude of the FID sig-
nal is proportional to the total number of protons from the water and oil phases
of the sample.
4. Apply a second, 180°, refocusing rf pulse to produce a spin-echo signal when
only the signal from the oil phase contributes to the FID.
5. Calculate the difference between the two component signal amplitudes, one of
which is proportional to the oil, whereas the other is proportional to the mois-
ture content. Then, convert the measured signal intensity from water and oil
into percentages of oil or moisture content with an established calibration.
This method was applied to soybean and sunflower seed analysis and was
reported to have only 0.6% error for oil determination. The calibrations employed
to relate the FID signal to oil and moisture percentages are critical for the accuracy
and reliability of this method. For best performance, the calibration samples should
be homogenous, free from impurities, and of the same type as the test samples; this
is so because different types of oilseeds may have different fatty acid profiles,
which would result in different time dependences for the FID amplitude. It is rec-
ommended that the oil content of calibration standards be determined with the ref-
erence method described in AOCS Ai 3–75.
1PDNA
13
C SS-NMR Technique for Oil Content Determination in Soybean
Flours. Soybean flours can be directly measured for oil content determination by
employing a composite, 1PDNA pulse sequence (Fig. 11.4). Solid-state
13
C NMR
spectra were recorded with a General Electric, GN300WB model, FT-NMR instru-
ment, operating with a 7.05 T, wide-bore superconducting magnet. The pencil-
shaped CP-MAS probe allowed for the insertion of a 7.5 mm diameter rotor made
of zirconium. The NMR pencil probe components are as shown in Figure 11.5. The
same NMR probe is employed for experiments that require spinning the rotor at
Fig. 11.4. The 1PDNA pulse
sequence employed in
13
C
SS-NMR experiments of oil
content determination in
soybean flours.
Copyright © 2004 AOCS Press
high-speed rates, with the rotor axis at the magic angle (54° 44′) with respect to the
external magnetic field (z) direction. The maximum spinning rate of the rotor was
~6 kHz with all of our samples and was simply achieved with nitrogen gas from
the building supply. The active volume in the coil could be filled with ~300 mg of
sample. Considering the fact that the gyromagnetic ratio for
13
C is only one fourth
that for
1
H, the center frequency for the
13
C NMR spectrum in the 7.05 T super-
conducting magnetic field of the GN300WB spectrometer was ~75 MHz.
The VACP
13
C SS-NMR Technique for Measurements of Protein Content in
Soybean Flours. The variable amplitude cross-polarization (VACP) experiment is
performed by applying a pulse sequence that transfers polarization from the
1
H to
13
C nuclear spins, in the presence of sample spinning at the magic angle with
respect to the external magnetic field (Fig. 11.6). The artificially imposed, fast
sample spinning averages out the
13
C chemical shift anisotropy. The purpose of the
VACP NMR pulse sequence is to enhance the
13
C NMR signal through cross-
polarization from
1
H to the neighboring
13
C nuclear spins. The pencil probe for
solids was employed in the General Electric GN300WB (7.04 T) spectrometer to
measure 300-mg samples of soybean flours without any additional sample prepara-
tion. The number of transients selected in this case was 1600 for each soybean
flour sample, thus allowing for a 40-fold improvement in S/N.
Liquid-State
13
C NMR Measurements of Protein Content and Amino Acid
Residues in Hydrated Soybean Flour Gels. Solid sample composition informa-
tion that could be provided by the averaged, isotropic chemical shift isotropy (CSI)
is hidden by the very broad bands present in static and rigid solids that possess
large chemical shift anisotropy (CSA). In liquids, rapid molecular tumbling aver-
ages out anisotropies; therefore, NMR spectroscopists often employ liquid solu-
tions to acquire high-resolution NMR spectra. Nevertheless, it is often the case that
highly hydrated concentrated samples, such as hydrated gels, still exhibit higher
resolution
13
C NMR spectra than those obtained with the help of various SS-NMR
Fig. 11.5. Diagram of the pencil probe employed in a General Electric, GN300WB
model, FT-NMR spectrometer, with a zirconium rotor sleeve, Kel-f drive tip, Teflon
front spacer, and end cap.
Active sample volume
Copyright © 2004 AOCS Press
techniques, by virtue of the segmental mobility in high-molecular-weight biopoly-
mers in those sample regions that are highly hydrated as in soft gels of various
hydrated biopolymers (32).
Protein Content and Amino Acid Profile Determination with the WALTZ-16,
1
H Decoupling Sequence for
13
C Liquid-State NMR of Highly Hydrated
Soybean Flour Gels and Doughs. The WALTZ-16
1
H decoupling pulse
sequence for
13
C NMR is a composite pulse sequence that employs
1
H broadband
decoupling, as well as refocusing of the heteronuclear interactions by applying a
refocusing 180° pulse to the
13
C nuclear spins (Fig. 11.7). To determine the protein
Fig. 11.6. The VACP NMR pulse sequence employed in our
13
C SS-NMR measure-
ments of protein content in soybean seed flours.
Fig. 11.7. The WALTZ-16 decoupling pulse sequence for liquid-state
13
C NMR.
Copyright © 2004 AOCS Press
content and amino acid profiles of soybean seeds, we employed a Varian UI-600
spectrometer that operates at 150 MHz resonance frequency for
13
C NMR in a 14.1
T external magnetic field. Samples of soybean flour gels of various dilutions in
D
2
O at pH ~11.2 were carefully placed in a 10-mm probe for solutions. Spectra
were recorded with 10,000 transients, with a
13
C pulse width of 8.0 µs; the recycle
delay employed was 4.0 s and the acquisition time was 0.62 s. The selected spec-
tral width was 52.8 kHz (~350 ppm).
Standard Methods for Soybean Compositional Analysis
Understanding the limitations and assumptions involved in standard methods is
essential for generating high-quality calibrations; any large and unexplained varia-
tions in the content of any of the components in the standard samples can result in
large errors of prediction for the constituents of interest. Therefore, the analytical
methods for oil, protein, and moisture determination will be discussed briefly as
they have been employed for the purpose of NIR calibrations for these major soy-
bean seed components.
Oil Determination. Compared with protein determination methods, the oil deter-
mination method most commonly employed is relatively straightforward. Both oil
and fats belong to the class of lipids, which by definition is a group of substances
generally soluble in organic solvent and insoluble in water. Oil refers to lipids that
are liquid at room temperature whereas “fat” refers to the lipids that are solid at
room temperature. Because oil consists of a mixture of hydrophobic molecules that
are soluble in organic solvent and insoluble in water, the total oil content of a sam-
ple can be determined by organic solvent extraction.
Based on the extraction operation, the organic solvent extraction method can
be categorized as a continuous solvent extraction method, a semicontinuous sol-
vent extraction method, or a discontinuous solvent extraction method. The semi-
continuous extraction method is most widely employed in analytical laboratories
and it normally utilizes a Soxhlet distiller or similar devices. The AOCS official
method (Ac 3–44) for oil determination of soybean samples is the semi-continuous
method.
The AOCS official method specifies petroleum ether as the solvent to extract
oil from ground soybean meal in a Butt-type extraction apparatus such as a Soxhlet
distiller. The basic operation involves the following steps: (i) Weigh 2 g of ground
sample and enclose the sample in filter paper; (ii) place the sample in the Butt tube
device and extract the sample with petroleum ether for 5 h; (iii) evaporate the
petroleum ether on a steam bath or in a water bath; and (iv) weigh the mass of the
extracted oil. The oil content of the sample can be calculated as the percentage of
extracted oil over the total mass of the sample. To obtain accurate and reliable
results, it is important that the powder sample be fine enough because the particle
size of the ground soybean affects the extraction level. In addition, the moisture
Copyright © 2004 AOCS Press
content of the sample is also important. If the moisture in the sample is too high
(>10%), the sample may also require a drying pretreatment.
Protein Analysis
Various techniques were utilized to determine the protein content in soybeans.
However, each one has its advantages or drawbacks, and therefore they should be
considered as complementary to each other. The Kjeldahl method is one of the widely
employed methods for measuring organic nitrogen content in grains, and it is also the
official method for protein analysis recommended by the AOCS (Ac 4–91). The total
organic nitrogen of the sample is calculated and converted into the percentage of pro-
tein by multiplying by a predefined constant. However, the digestion process requires
some catalysts to increase speed and it is affected by changes in temperature.
The Biuret method is also employed to determine protein content for relatively
large samples. It is considered by many researchers to be more accurate than the
Kjeldahl method for protein measurements because it utilizes the reaction between the
peptide bond and copper ions; on the other hand, Kjeldahl quantitates only the total
nitrogen, and cannot distinguish between protein and non-protein nitrogen. The Biuret
method does have relatively low sensitivity, and it requires calibration with known
protein concentration standards. A related method to Biuret is the Lowry method,
which is perhaps the most widely applied method for determination of protein content
in solutions. It combines the Biuret reaction with the reduction of the Folin-Ciocalteau
phenol reagent (phosphomolybdic-phosphotungstic acid) by aromatic amino acids
tyrosine and tryptophan residues in the proteins. The Lowry method has very high
sensitivity; however, the color reaction may vary with different proteins to a greater
extent than with the Biuret method. Ohnishi and Barr made a modification of the
Lowry method in their procedure, thus combining the advantages of the Biuret
method with those of the Lowry method, and also resolving the limitations of the lat-
ter (33). Their procedure is the basis for the current Sigma Chemical (St. Louis, MO)
microprotein determination procedure No. 690. This procedure has also been
employed in our laboratory for protein determination and was calibrated with soybean
protein standards of known purity and composition.
High-Performance Liquid Chromatography Analysis of
Derivatized Amino Acids from Hydrolyzed Proteins
A method that is often preferred by analytical laboratories to generate “standard”
amino acid profiles of proteins is HPLC of hydrolyzed proteins. However, this method
does not allow for the measurement of tryptophan (Trp), glutamine (Gln), and
asparagine (Asn) residues. Only values of Glx = Gln + Glu and Asx = Asp + Asn can
be reported with this method because the acid hydrolysis converts all Gln into Glu
(glutamic acid), and all Asn into Asp (aspartic acid). Before actual HPLC measure-
ment, the remaining 18 amino acid residues are derivatized with special fluorochrome
reagents, such as the AccQ-Fluor reagent (6-aminoquinolyl-N-hydroxysuccinimidyl
^
Copyright © 2004 AOCS Press
carbamate) in a borate buffer (Waters, Milford, MA). After obtaining linear HPLC
standard plots for the 18 amino acid residues that are contained in acid hydrolyzates of
proteins, one can proceed to attempt NIR calibrations based on such partial HPLC data
for the same group of protein hydrolyzates. This approach was recently attempted with
soybean samples and a brief summary of NIR calibrations was reported (34) for amino
acid profiles of ground soybean samples measured with the dispersive NIRS Model
6500 instrument (NIRS Systems, Silver Springs, MD) operated in the reflection
mode. The only major drawback of this approach, apart from the Gln and Asn con-
version to the acid forms, is the relatively large errors introduced by the acid hydrol-
ysis for several of the more labile amino acid residues, thus limiting the usefulness of
the approach to perhaps 10 of the 18 amino acid residues that are being separated by
HPLC.
Moisture Determination Methods
Moisture is probably the most widely analyzed component for food products. There
are, however, several precautions that should be taken to obtain accurate and repro-
ducible moisture measurements. Water in food products and oilseeds can be dynami-
cally distributed over at least three different types of water populations, i.e., free,
adsorbed, and trapped. Most moisture determination methods determine the amount of
water in food products by measuring the difference of mass before and after removing
water from the sample, in most cases by drying the sample for extended periods of
time at temperatures close to the boiling point of water. Because not all of the water
populations present in a food product or an oilseed can be readily removed by drying
at a specific temperature, drying methods for moisture determination are susceptible to
inconsistency. The most widely employed moisture determination method for grains
and oilseeds is the oven drying method. For oven drying, the sample is heated under
specified conditions and the weight loss is measured to calculate the moisture content
of the sample. Drying conditions, such as the type and condition of the oven, and the
time and temperature of drying, can significantly affect the results. In the ASAE stan-
dard method (ASAE S352.2) for soybean moisture determination, it is required that 15
g of whole, unground soybean seeds be dried at 103°C for 72 h. To determine the
moisture content of low-moisture products, the Karl Fischer titration method could
also be applied. This chemical method is based on the fundamental reaction involving
the reduction of iodine by SO
2
in the presence of water. However, its rate of success
with several oilseeds, such as corn and soybean seeds, has been rather low.
Results
Validation of the NIR Calibrations for Protein and Oil Measurements
in Mature Soybean Seeds: Bulk and Single-Seed Calibrations
After appropriate spectral corrections for light-scattering effects and baseline
shifts, the DA-NIR and FT-NIR spectra of the standard samples were employed for
Copyright © 2004 AOCS Press
calibration development. For both DA-NIR and FT-NIR instruments, calibrations were
developed based on the PLS-1 model and they were validated with the corresponding
deconvoluted spectra. The number of factors for the PLS-1 models was optimized by
cross validation; the prediction errors of the calibration models were also estimated by
employing cross validation. The correlation coefficients (R) and standard error of cross
validation (SECV) of the DA-NIR calibration for protein and oil measurements are
presented in Figures 11.8–11.11 for the FT-NIR instrument, and in Figures
11.12–11.15 for the DA-NIR instrument. In addition, the calibration results are also
presented in Tables 11.1 and 11.2. From Figures 11.8–11.11 and Table 11.1, one can
see that the SECV values for protein and oil analysis for both bulk soybean samples
and single-seed soybean samples are fairly low. For bulk sample analysis, the SECV
value is quite low, ~0.1% for both protein and oil calibrations. For the single-seed
analysis, the SECV value for protein analysis is 1.1% and that for oil is 0.5%. From
Figures 11.8–11.11 and Table 11.1, one may note that very accurate results can be
obtained with the FT-NIR instrument. The SECV values for protein and the oil FT-
NIR analysis of bulk samples were similar to the results obtained with the DA-NIR
instrument, whereas for single-seed analysis, the FT-NIR instrument seemed to be
more accurate. This is as expected, and it is easily explained by the fact that FT-NIR
instruments utilize an integrating sphere accessory and a narrow beam, which is appro-
priate for single-seed analysis.
Oil and Protein Determination in Mature Soybeans
Using NMR Techniques
Decoupling Sequence for
13
C Liquid-State NMR of Highly Hydrated Soybean
Flour Gels and Doughs. The
1
H decoupled
13
C NMR spectra of gel samples of
Fig. 11.8. Standard protein values vs. calculated values by FT-NIR calibrations for single
seed soybean analysis. (All measurements were carried out in quadruplicate.) R = 0.999
and RMS = 0.31.
Copyright © 2004 AOCS Press
soybean flour, protein isolate, and oil that were recorded with the WALTZ-16
1
H
decoupling pulse sequence are presented in Figures 11.16–11.18. It was previously
reported for soybean proteins (35–37) that the region of interest for soybean pro-
tein content determination is located in spectral region 4, between 173 and 181
ppm, as shown in Figure 11.16. Indeed, we found the
13
C NMR peaks of 18 amino
Fig. 11.9. Standard oil values vs. calculated values by FT-NIR calibrations for single seed
soybean analysis. (All measurements were carried out in quadruplicate.) R = 0.999 and
RMS = 0.15.
Fig. 11.10. Standard protein values vs. calculated values by FT-NIR calibrations for
bulk soybean sample analysis. (All measurements were carried out in quadruplicate.)
R = 0.999 and RMS = 0.26.
Copyright © 2004 AOCS Press