Báo cáo lâm nghiệp: "Macronutrients in tree stems and foliage: a comparative study of six temperate forest species planted at the same sites" pps
Bạn đang xem bản rút gọn của tài liệu. Xem và tải ngay bản đầy đủ của tài liệu tại đây (707.03 KB, 10 trang )
489
Ann. For. Sci. 61 (2004) 489–498
© INRA, EDP Sciences, 2004
DOI: 10.1051/forest:2004043
Original article
Macronutrients in tree stems and foliage: a comparative study
of six temperate forest species planted at the same sites
Anna HAGEN-THORN
a
*, K stutis ARMOLAITIS
b
, Ingeborg CALLESEN
c
, Ingrid STJERNQUIST
a
a
Lund University, Department of plant Ecology and Systematics, Ecology Building, 223 62 Lund, Sweden
b
Lithuanian Forest Research Institute, Liepø 1, Girionys, 4312, Lithuania
c
Danish Forest and Landscape Research Institute, Hørsholm Kongevej 11, 2970 Hørsholm, Denmark
(Received 21 July 2003; accepted 19 December 2003)
Abstract – Common European tree species (oak, ash, beech, birch, lime and spruce) planted in adjacent stands on six sites were compared in
terms of macronutrient concentrations in foliar and stem wood (including bark) biomass. The nutrient concentrations in both biomass
compartments were much more dependent on species than on site although soil conditions differed between the sites. Differences between
species regarding stem wood nutrient concentrations only partly corresponded to the differences in species foliage. The concentrations in spruce
were considerably lower than in deciduous species, except P in foliage, and Ca in both stem wood and foliar biomass. Differences were also
observed between the deciduous species both regarding foliar and stem wood nutrient concentrations. The differences should be considered
when modelling nutrient circulation in forest stands and when evaluating the long-term sustainability of forest management.
nutrient / hardwood / Norway spruce / stemwood / foliage
Résumé – Éléments minéraux dans le tronc et le feuillage : une étude comparative de six essences tempérées plantées sur les mêmes
sites. Les essences européennes communes (chêne, frêne, hêtre, bouleau, tilleul et épicéa commun) plantées dans des parcelles adjacentes sur
six sites ont été comparées en termes de concentrations en macro-éléments minéraux dans la biomasse foliaire et dans le tronc (écorce y
compris). Ces concentrations dépendaient plus de l'espèce que du site, bien que les conditions de sol étaient différentes entre les sites. Les
différences entre les espèces observées dans le bois de tige ne correspondaient que partiellement à celles observées dans le feuillage. L’épicéa
commun était plus pauvre en éléments minéraux que les feuillus excepté concernant le P dans le feuillage, et le Ca dans le tronc ainsi que dans
la biomasse foliaire. Des différences de concentrations minérales ont également été observées entre les espèces de feuillus dans le bois ainsi
que dans le feuillage. Ces différences devraient être considérées pour la modélisation de la circulation des éléments minéraux dans les
peuplements forestiers et dans l’évaluation des aménagements forestiers dans le cadre d’une gestion durable.
nutriment / feuillu / épicéa commun / bois de tige / feuillage
e
1. INTRODUCTION
Nutrient concentrations in different compartments of tree
biomass are commonly used for evaluation of plant nutrient sta-
tus, soil nutrient availability and as indicators of forest health
[14, 26, 47, 53]. Biomass and nutrient concentrations in differ-
ent tree compartments are used for estimation of tree nutrient
uptake and nutrient removal by harvest, and are thus crucial for
understanding of nutrient circulation in forest ecosystems and
in the assessment of the sustainability of forest management
[23, 50].
Review studies and large-scale foliar chemistry surveys
show wide ranges of foliar nutrient concentrations and nutrient
ratios in forest trees [11, 47, 51]. The wide ranges of nutrient
concentrations hardly reveal particular differences between
species, as the nutrient concentrations presented in those stud-
ies are the result of empirical generalisation of many investi-
gations regardless of the time of sampling, climate conditions,
soil type etc. Additionally, factors that influence species distri-
bution may influence the results of inter-species comparisons,
if some species are more frequently found on more fertile soils
than the others.
Comparative studies of several species growing on the same
soils allow a better understanding of differences between spe-
cies under similar nutrient conditions. Studies of this kind have
most often dealt with coniferous species, including one or, at
most, two deciduous species [2, 3, 12, 19, 33, 38, 46]. While
nutrient concentrations in coniferous species, and Norway
* Corresponding author:
490 A. Hagen-Thorn et al.
spruce in particular, have been extensively studied, European
deciduous temperate forest species have received considerably
less attention in this respect.
The aim of this study was to compare foliar and wood nutri-
ent concentrations in common European tree species (Quercus
robur L., Tilia cordata Mill., Betula pendula Roth., Fraxinus
excelsior L., Fagus sylvatica L. and Picea abies (L.) Karst.)
planted in adjacent stands on the same soils. The study was
focused on deciduous species, but Norway spruce was also
included for comparison due to the fact that nutritional aspects
of this species in relation to soil condition have been well stud-
ied [25, 29, 42, 48, 49].
Nutrient concentration in plant biomass is the result of the
balance between nutrient uptake, plant growth and nutrient re-
translocation and loss. These processes are likely to be influ-
enced both by plant genomes and soil fertility, as well as other
environmental conditions. The relative importance of site and
species as factors determining nutrient concentrations in plant
biomass may differ depending on nutrient element and biomass
fraction. Foliar nutrient concentrations are most often used for
the evaluation of plant nutrient status and, according to Augusto
et al. [6], are more sensitive to soil nutrient conditions than
nutrient concentrations in stem biomass. Despite the fact that
good correlations are rarely observed between nutrient concen-
trations in plant biomass and non-fertilized forest soils, most
often Ca, and sometimes also Mg and N, are the macroelements
that show a consistent relationship [4, 7, 34, 35].
Nutrient concentrations and nutrient allocation between dif-
ferent plant tissues and biomass compartments are primarily
determined by their functions, as various physiological processes
require nutrient elements to different extents [30]. Stem biomass
usually has the lowest concentrations of elements compared
with other aboveground biomass compartments [6, 38, 44, 52].
The distribution of nutrients between different compartments
can, however, also be species dependent, reflecting ecological
differences between species. The differences between species
regarding nutrient concentrations in foliage may not correspond
to the differences in stem wood nutrient concentrations [3, 46].
Thus, the following specific hypotheses were tested in our
study: (i) foliar nutrient concentrations differ between species,
not only between Norway spruce and deciduous species, but
also within the deciduous species group; (ii) stem wood nutrient
concentrations also differ between species, but not necessarily
in the same way as foliar nutrient concentrations. We also hypoth-
esised that, within the gradient of soil conditions included in our
study, the nutrient concentrations in plant biomass would be
more dependent on species than on site.
2. MATERIALS AND METHODS
2.1. Site description
Plots with six different tree species: Quercus robur L., Tilia cor-
data Mill., Fraxinus excelsior L., Betula pendula Roth., Fagus sylva-
tica L. and Picea abies L. Karst, at six sites in three European countries
were studied. At each site, three to six plots (of about 400 m
2
) con-
taining different species planted at the same time, in adjacent or closely
situated stands, were investigated (Tab. I). Three Lithuanian sites were
situated along the shores of the artificial lake “Kauno marios” in south-
ern Lithuania (54° 45’–54° 53’ N, 24° 04’–24° 09’ E). The soils at
these sites have developed on limnoglacial deposits with soil types
ranging from Haplic Arenosols (site LT-1) to types intermediate
between Eutric Cambisols and Dystric or Eutric Planosols (sites LT-2
and LT-3) [20]. On the Swedish site (SE-1) at Snapparp (56° 32’ N,
12° 58’ E), soils had developed on sand deposits of presumably aeolian
origin and were classified as Haplic Arenosols [20].
The two Danish sites differed considerably in soil characteristics
(Tab. II). The soil at the first site (DK-1), which was situated in Jut-
land, near Kragelund (56° 10’ N, 9° 23’ E), had developed on medium
sandy till and was classified as Haplic Alisol [20]. The soil at the other
Danish site (DK-2) at Odsherred (55° 51’ N, 11° 41’ E) had developed
on a nutrient-rich loamy Weichsel till and was classified as Haplic
Luvisol [20]. This site has been forested for at least 200 years, in con-
trast to the other five sites, which were previously used for agricultural
purposes prior to forest planting in 1958–1967 (Tab. I).
2.2. Sampling, analysis and data treatment
Sampling at each site was preceded by visual evaluation of homo-
geneity of relief and soil conditions, which were further confirmed by
analysis of soil chemistry and texture. Mineral soils down to 30 cm
depth were sampled within each plot at 20 systematically distributed
points and separated into three 10 cm thick layers. The samples were
Table I. Plantation year and wood production on each plot.
Site
Plantation
year
Stem wood production
3
, m
3
/ha
Ash Beech Birch Lime Oak Spruce
DK-1 1960 49 327 142 302 203 450
DK-2 1973–1974 222 –
2
186 231 197 –
2
LT-1 1958–1959 194 –
2
515 353
1
275 306
LT-2 1958–1959 313 –
2
–
2
426
1
332 –
2
LT-3 1960 214 497 326 403 207 337
SE-1 1967 –
2
216 –
2
325 349 –
2
1
At these sites lime was growing with a 30% admixture of oak (Q. robur. L). Values in the table give the total wood volume on the site, for both spe-
cies together.
2
“–” Indicates that there was no suitable plot with this species at the site.
3
Includes last 10 years’ thinnings.
Macronutrients in temperate forest trees 491
mixed in the field to make one combined sample per plot for each layer.
The samples from the 10–20 cm layer were used for texture analyses
[29], while the samples from 0–10 and 20–30 cm layers were used for
assessment of soil chemistry. Total nitrogen was determined using the
Kjeldahl method, and a CR 12; Leco carbon determinator instrument
was used for the measurement of total soil carbon. Concentrations of
extractable nutrients were determined using ICP-AES (Optima) after
equilibrium extraction of a 20 g (dry weight) soil sample in 100 mL
0.1 M acid Na-EDTA (pH 4.6) for P, and in 100 mL of a 0.1 M solution
of BaCl
2
for all other elements. General characteristics of the soil nutri-
ent conditions in topsoil at each site are presented in Table II.
Tree heights and diameters at breast height (DBH) were measured
and used for calculation of the basal area and standing tree volume at
each plot. Four trees with diameters approaching the mean stand DBH
were randomly chosen for biomass sampling. The samples from these
trees were mixed in the field to provide a composite sample for each
biomass fraction for each plot. Leaves and needles were sampled in
the second half of August 2000 in Sweden and Lithuania and at the
beginning of September 2000 in Denmark at the DK-2 site. At the other
Danish site (DK-1) leaves were sampled at the end of August 2001.
Leaf samples were collected from the upper third of the crown. Current
year and 1-year-old spruce needles were sampled from the 7th branch
from the top. Wood cores (including bark) were taken from the same
trees at DBH from four different sides of the trunk on Lithuanian sites
and from two opposite sides at the Danish and Swedish sites.
Leave samples and wood core samples, including bark, were dried
to constant weight at 40 °C, homogenised and analysed for nutrient
elements. For ash leaves the leaflets were separated from the other leaf
parts and the two fractions were weighed and analysed separately.
Nutrient concentrations in the whole ash leaves were calculated based
on nutrient concentrations of these two fractions and weight relation
between them on each plot. Nitrogen in plant samples was analysed
by the Kjeldahl method. Other macronutrients were analysed using
ICP-AES after 1 g plant material was digested in 25 mL concentrated
HNO
3
on hot plates. The results of soil and plant material analysis were
corrected for the difference in water content between 40 °C and 80 °C.
Nutrient concentrations in leaves and wood biomass were analysed
by analysis of the variances (ANOVA) with species and site as factors.
Only the main effects were analysed. The Tukey – Kramer procedure
(a variant of Tukey HSD for unbalanced models [32]) was used in
order to determine significant differences between species. For those
elements that showed statistically unequal variances between species
(N, K in stem wood and Ca-to-N ratio in the foliage), Tamhane 2T test
was used instead (SPSS software, version 11).
All nutrient ratios, with the exception of Ca-to-N ratio, were subjected
to arcsine transformation [45] in order to fit the ANOVA assumption
of normally distributed residuals. All statistical analysis was per-
formed with SPSS, v.11 software.
3. RESULTS
The differences between species regarding nutrient concen-
trations were not the same in different parts of the biomass for
most of the elements and species studied. For N and S, however,
the differences between the species in foliar and stemwood bio-
mass were rather similar with the exception of ash, which had
the highest N concentration in stemwood, but not in the leaves
(Tab. IV).
Species proved to be a more important factor than site in
determining nutrient concentrations in both leaf and stem wood
biomass (Tab. III). Site was significant only for foliar concen-
trations of N and Ca (only when spruce was included in the anal-
ysis), and for stem wood concentrations of P and N.
Nutrient concentrations in mineral topsoils (0–30 cm depth)
were, in contrast to nutrient concentrations in the biomass, sig-
nificantly different at the studied sites, but not between species.
Only for nitrogen was species of importance in influencing the
soil nutrient concentration (Tab. III).
3.1. Foliar nutrient concentrations
Concentrations of macronutrients in leaves differed depend-
ing on species and element (Tab. IV). N concentrations in
spruce needles were about half those in deciduous species.
Foliar N concentrations in lime, oak and beech were not sig-
nificantly different but lime leaves showed the highest N con-
centration of all species at all sites, with the exception of DK-1
where oak showed the highest concentration (Fig. 1A). Birch
leaves showed a significantly lower N concentration than lime,
but higher than ash. Ash leaves had the lowest N concentration
among the deciduous species, mainly due to the fact that N con-
centrations in its petioles and rachides were less than one third
of that in the leaflets. The nitrogen concentration in ash leaflets
was, on average, similar to the N concentration in other decid-
uous species, but showed a higher variation between the sites.
There was no significant difference in foliar P concentrations
between the species. However, the P/N ratio, was significantly
Table II. Mean (± SE) topsoil characteristics at each site. Soil texture was determined at 10–20 cm depth. Other parameters of mineral soil
were analyzed both at 0–10 cm and 20–30 cm depth and average values between these two layers were calculated for each plot.
Site Clay Silt Sand CEC
a
pH Base
b
N C P K Ca Mg
% % % mmol(+)/kg (BaCl
2
) saturation, % mg/g mg/g µg/g µg/g µg/g µg/g
DK-1 3.2 (0.2) 11.8 (1.7) 85.0 (1.7) 15.9 (1.8) 3.9 (0.0) 37.2 (6.7) 0.80 (0.08) 13.5 (1.5) 13.3 (1.5) 16.9 (2.4) 96 (28) 16.6 (4.1)
DK-2 8.7 (0.9) 26.2 (6.2) 65.1 (7.0) 45.4 (2.2) 3.6 (0.1) 49.4 (5.8) 2.43 (0.24) 36.5 (3.0) 32.9 (3.2) 51.6 (4.8) 383 (66) 48.7 (6.2)
LT-1 4.7 (0.4) 17.8 (2.9) 77.5 (3.3) 22.0 (1.9) 4.0 (0.1) 55.8 (7.9) 0.93 (0.11) 14.7 (2.0) 19.7 (5.4) 27.7 (4.7) 225 (40) 26.3 (5.2)
LT- 2 10.1 (1.6) 44.7 (0.5) 45.2 (1.2) 43.5 (7.0) 4.0 (0.0) 84.2 (4.4) 1.21 (0.16) 17.4 (1.7) 11.7 (0.9) 61.5 (9.8) 582 (119) 86.5 (21.6)
LT-3 7.8 (0.7) 39.2 (1.6) 52.9 (1.6) 33.7 (2.5) 4.1 (0.1) 69.9 (7.3) 1.09 (0.05) 16.9 (1.0) 14.1 (1.8) 44.3 (5.8) 406 (64) 48.8 (8.3)
SE-1 5.3 (0.4) 14.9 (1.9) 79.8 (2.3) 39.9 (1.8) 3.9 (0.0) 73.0 (1.9) 1.90 (0.19) 29.7 (3.9) 34.8 (1.9) 46.6 (1.3) 459 (14) 51.0 (1.0)
a
Cation exchange capacity was determined as the sum of the extractable amounts of H
+
, Na
+
, K
+
, Ca
+
, Mg
2+
, Al
3+
, Fe
3+
and Mn
2+
from the BaCl
2
extraction.
b
Base saturation was calculated as the ratio between the sum of extractable amount of base cations and the total cation exchange capacity of a
soil sample.
492 A. Hagen-Thorn et al.
higher in spruce than in beech, with other species being some-
where between (Fig. 2).
Lime showed higher K concentration in leaves than all other
species. Ash and oak had lower concentrations than lime, but
almost twice that of spruce. Beech and oak also had higher con-
centrations than spruce, but the differences were not significant
at 0.05 level (Tab. IV and Fig. 1C). In ash leaves, K was the
only element that showed a higher concentration in petioles and
rachides than in leaflets.
Foliar concentrations of Ca were highest in lime and ash.
Lime differed significantly from all other species but ash. Oak
and spruce exhibited the lowest foliar Ca concentrations. Spruce,
however, had much higher, and similar to beech and ash, Ca
concentration at the site LT-3 where the Ca concentration in the
soil was high.
Leaf concentrations of Mg were highest in ash and lowest
in spruce. Ash differed significantly from all the other tree spe-
cies with the exception of birch, which also showed a relatively
high concentration of Mg. Mg/N ratios in ash leaves were
higher than in leaves of all other species (Fig. 2).
S concentrations were highest in ash and lime leaves, inter-
mediate and very similar in beech, oak and birch, and lowest
in spruce. The high concentration of S in ash leaves was due
to high concentration in the leaflets, as the concentrations in leaf
petioles and rachides were about four times lower and about the
same as S concentrations in spruce needles. S/N ratios in different
Table III. P-values for the factors site and species in two-way ANOVAs. “ns” indicates that the values were not significant at 0.05 level, “–”
means no chemical analysis was performed for this element.
Concentrations in foliar biomass Concentrations in stem wood biomass Concentrations in mineral soil (0–30 cm)
All species Deciduous
species only
All species Deciduous
species only
All species Deciduous
species only
Factor Species Site Species Site Species Site Species Site Species Site Species Site
N 0.000 0.013 0.000 0.023 0.000 0.050 0.032 ns ns 0.000 0.047 0.000
P 0.012 ns 0.018 ns 0.000 0.000 0.000 0.001 ns 0.000 ns 0.000
K 0.000 ns 0.001 ns 0.000 ns 0.000 ns ns 0.000 ns 0.001
Ca 0.000 0.035 0.001 ns 0.000 ns 0.000 ns ns 0.000 ns 0.003
Mg 0.001 ns 0.003 ns 0.000 ns 0.000 ns ns 0.000 ns 0.003
S 0.000 ns 0.000 ns 0.000 ns 0.000 ns – – – –
Table IV. Nutrient concentrations in foliage and stem wood of different species. Means which differ significantly at 0.05 level are indicated by
different letters. Standard deviations of means are given in parentheses.
Species Foliar concentrations, mg/g Stem wood (including bark) concentrations, mg/g
NP K CaMgS NPKCaMgS
Ash 21.60 (4.17) 1.80 (0.61) 11.44 (2.83) 15.10 (2.34) 3.54 (1.03) 2.85 (0.40) 1.29 (0.06) 0.11 (0.03) 1.73 (0.29) 1.29 (0.19) 0.25 (0.03) 0.15 (0.01)
bns b bc cc cbccacdd
Beech 27.37 (2.27) 1.63 (0.06) 9.42 (1.39) 10.14 (4.41) 1.64 (0.37) 1.75 (0.16) 1.13 (0.00) 0.13 (0.04) 1.07 (0.12) 1.01 (0.05) 0.32 (0.06) 0.10 (0.00)
cd ns ab ab ab b b cd bc a d b
Birch 26.15 (2.62) 2.51 (0.56) 9.01 (0.95) 9.46 (1.73) 2.64 (0.42) 1.79 (0.18) 1.10 (0.13) 0.09 (0.01) 0.56 (0.08) 1.24 (0.34) 0.21 (0.06) 0.09 (0.01)
c ns ab ab bc b bc bc a a bc b
Lime 30.74 (2.24) 2.49 (0.51) 16.72 (2.98) 17.29 (5.12) 2.09 (0.51) 2.77 (0.23) 1.31 (0.22) 0.16 (0.03) 1.27 (0.17) 2.00 (0.24) 0.24 (0.04) 0.15 (0.01)
d ns c c abc bcdbcbcdd
Oak 29.17 (1.81) 2.40 (0.46) 11.63 (2.15) 8.48 (1.36) 1.71 (0.31) 1.70 (0.04) 1.27 (0.08) 0.09 (0.03) 1.00 (0.13) 1.45 (0.22) 0.12 (0.02) 0.12 (0.01)
cd ns b a ab b bc b b a ab c
Spruce 13.78 (1.21) 1.80 (0.07) 6.35 (1.04) 8.89 (4.96) 1.20 (0.39) 1.00 (0.13) 0.58 (0.06) 0.04 (0.01) 0.40 (0.13) 1.12 (0.24) 0.12 (0.01) 0.06 (0.01)
ans a a aa aaaaaa
Macronutrients in temperate forest trees 493
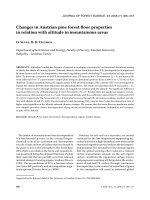
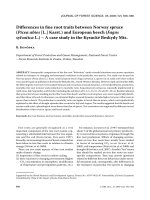
Figure 1. Foliar (A–C) and stem wood (D–F) concentrations of N, P and K in different species across the sites. The sites are arranged in order of increasing N concentration in the
soil. Different letters indicate significance at the 0.05 level in two-way ANOVA (as also shown in Tab. IV).
494 A. Hagen-Thorn et al.
parts of ash leaves were, however, higher than in all other spe-
cies. Lime foliage also had a relatively high S/N ratio, whereas
oak leaves had the lowest (Fig. 2).
3.2. Stem wood concentrations
The concentration of N in spruce stem wood was about half
that in the stem wood of deciduous species, and corresponded
to differences between needles and leaves. Unlike foliar N con-
centrations, ash stem wood had N concentrations similar to
those in other deciduous species. Beech had a slightly lower
stem wood N concentration than other deciduous species, and
was different from ash but not from other deciduous species
(Tab. IV and Fig. 1E).
In contrast to foliar P, stem wood P varied significantly
between the species. Lime had the highest P stem wood con-
centration at all sites, and the value was significantly different
from those of other species except beech. At the least fertile site
(DK-1) beech had, however, a lower concentration than ash and
oak, indicating an interaction between species and site factors
for this element and species. Spruce exhibited the lowest stem
wood P concentration across all sites (Fig. 1E and Tab. IV).
The concentration of K was highest in ash wood, followed by
lime, beech and oak. Birch stem wood showed a significantly
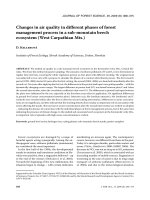
Figure 2. Nutrient-to-nitrogen ratios in foliage of different species. Means (± 1SD) are shown by dots in circles, crosses show medians. The
figure shows non-transformed ratios. Different letters indicate significant difference between means in two-way ANOVA after arcsine trans-
formation. Note the different scale on the Y-axes.
Macronutrients in temperate forest trees 495
lower K concentration than other deciduous species, and was
not different from spruce in this respect. Mg concentrations in
stem wood samples of the deciduous species did not reflect the
foliar Mg concentrations. Ash, which showed much higher Mg
concentrations in leaves than other species, had the same Mg con-
centration in stem wood samples as beech and lime. The Mg
concentration in oak stem wood was lower than in other decid-
uous species and was similar to that in spruce stem wood
(Tab. IV). Lime stem wood exhibited the highest Ca concen-
tration of all the species at all sites. The differences between
other species were not significant.
The differences in stem wood concentrations of S were
rather similar to the differences in foliar S concentrations. Ash
and lime showed the highest S concentrations in stem wood,
oak had a lower concentration, and birch and beech showed the
lowest concentrations among the deciduous species. Spruce had
lower stem wood concentration of S than all deciduous species.
4. DISCUSSION
Our data indicated that nutrient concentrations in the plant
biomass of the tree species studied were affected to a greater
extent by genetic differences between the species than by site
conditions. This is in correspondence with the previous inves-
tigations of forests in southern Sweden. In spruce forests in the
province of Scania, Ca was the only macroelement that showed
a good correlation between nutrient concentration in needles
and in soil [34, 35]. Studies of the southern Swedish beech for-
ests [4, 7] have shown that for Ca, Mg, Mn and N the nutrient
concentrations in buds and leaves were related to nutrient con-
centrations in the soil, but soil alone did not account for the
major part of the variation in leaf nutrient concentrations.
For a given species at a particular site, the methods of soil
analysis give only approximate estimates of actual nutrient
availability, which depends on many factors such as soil mois-
ture [8, 17] or mycorrhizal association [21]. The absence of
good correlations between nutrient concentrations in the soil
and in plant biomass for the majority of nutrient elements is also
a strong indication of species’ ability to keep nutrient concen-
trations in the biomass within a certain range, even on less fer-
tile soils.
In a review study on nutrient concentrations in Douglas fir,
Scots pine, Norway spruce and European beech, Augusto et al.
[6] drew a similar conclusion concerning nutrient concentra-
tions in above-ground biomass, which were found to be fairly
constant for adult stands of these species. This was especially
pronounced for stem wood biomass concentrations, while
foliar nutrient concentrations were more affected by environ-
mental conditions.
In our study, foliar concentrations of N in deciduous species,
have showed a positive dependency on N concentration in soil,
which was most pronounced for ash (Fig. 1), which showed the
lowest N concentrations at the least fertile Danish site (DK-1)
and two Lithuanian sites. At the Danish site the growth rate,
was also probably affected (Tab. I) although the other elements
could also have been limiting.
For those elements and species that showed significant dif-
ferences (Tab. IV), the possible interactions between site and
species were presumably much weaker than the effects of the
main factors. In cases when the differences were not consistent
across the sites no significant differences were found at the
p = 0.05 level (Fig. 1). Two particular cases must, however, be
mentioned. Oak, which showed a significantly lower P concen-
tration in the stem wood than beech, had a higher P concentra-
tion at the least fertile site, and spruce, which showed a signif-
icantly lower Ca concentration in the foliage than ash had a
similar Ca concentration to ash at the Ca-rich site. In these two
cases the lower number of plots for spruce and beech (n =3)
may have influenced the statistical results.
4.1. Foliar nutrient concentrations
The differences in foliar nutrient concentrations between
Norway spruce and the deciduous species were expected as dif-
ferences between deciduous and evergreen species have been
reported previously [1, 3, 46, 54]. The N concentrations in Nor-
way spruce needles are often 40–50% lower than N concentra-
tions in leaves of temperate deciduous species [3, 9, 10, 33, 43].
A review of the variation of foliar nutrient concentrations in
spruce, birch, beech and oak in Europe [43], demonstrated that
the same differences existed for K, Mg and Ca, resulting in sim-
ilar ratios of these elements to N for all four species, with the
exception of a higher Mg/N ratio in birch. The P/N ratio in
spruce foliage in the same study was, however, higher than that
in foliage of other species as the N concentration in spruce nee-
dles was lower, while the P concentration was roughly the same
as in the foliage of deciduous species. The same tendency
regarding the P/N ratio in spruce foliage compared with other spe-
cies was observed in our study and in a study on nutrient con-
centrations in spruce and beech along the European transect [10].
The Ca/N ratio in spruce needles was relatively high in our
study and also showed the biggest variation between the sites.
The concentration of Ca in forest trees can vary over a very wide
range [11, 47] depending on soil conditions [4, 7, 34, 35] as well
as plant water consumption [5, 24]. High concentration of Ca
in Norway spruce needles compared to the foliage of other
coniferous species and silver birch have been previously
reported for plantations on productive soils [3]. Our study dem-
onstrated that for some elements and species the nutrient con-
centrations in the foliar biomass were also different within the
deciduous species group. Lime leaves had the highest average
N concentration (30.7 mg/g) among deciduous species, though
the difference was significant only in comparison to birch and
ash leaves (Tab. IV). Kazda et al. [28] also reported a high
(33.2 mg/g) N concentration in lime leaves growing in a 120-
year-old nutrient-rich flood-plain forest in the Czech Republic,
while foliar N concentrations in oak were lower (24.7–28.5 mg/g).
The differences between foliar N concentrations in ash and
other species were mainly due to lower N concentrations in the
ash leaf petioles and rachides.
Concentrations of foliar P did not differ significantly between
species in our study. However, beech, ash and spruce tended to
have lower P concentrations than lime, oak and birch (Tab. IV).
In a review study [43] the range of P concentrations found in
leaves of birch trees was wider than in foliage of beech and oak;
birch often had a higher P concentration than other species and
P/N ratios in birch were also higher, whereas beech had slightly
496 A. Hagen-Thorn et al.
lower P concentrations than other species. In our study the P/N
ratio in beech leaves tended to be low compared to other species
but the difference was significant for spruce only.
Foliar concentrations of K and Ca were high in lime com-
pared to other deciduous species. Lime has previously been
reported to have high concentrations of these elements in the
litterfall [55] and to influence the soil base saturation in a pos-
itive way [22, 36, 39]. For Mg, however, it was not lime, but
birch and especially ash that showed the highest elemental con-
centration in foliage, and higher Mg/N ratios. Rosengren et al.
[43] also found a higher concentration of Mg in birch leaves
than in the leaves of beech, oak and spruce, as well as higher
Mg/N ratios.
Foliar nutrient concentrations at the same site can vary from
year to year depending primarily on weather conditions. How-
ever, a long-term comparative study in Denmark [9] showed
that the variation in foliar nutrient concentrations between years
was lower than the variation between species and locations. As
our sites were situated in different countries the variation in
weather was one of the constituents of site as a factor. More-
over, most of the differences observed in the absolute concen-
trations were also reflected in nutrient-to-N ratios and nutrient
ratios are considered to be less variable than absolute nutrient
concentrations [29], although both should be taken into consid-
eration when evaluating nutrient requirements and deficiencies
in plant species [11].
4.2. Nutrients in the stem wood
Nutrient concentrations may vary within tree stems in both
the vertical and horizontal directions in different ways, depend-
ing on element and tree species [13, 15, 37, 41]. Bark usually
has higher nutrient concentrations than the rest of the stem [13,
40, 44, 52], while differences between heartwood and sapwood
seem to be more variable depending on species and nutrient ele-
ments [31].
The stemwood concentrations observed in our study repre-
sent the integrated inter-specific differences across all stem-
wood compartments at DBH level. At this level the formation
of heartwood and the possible differences between species in
nutrient resorption from senescing sapwood may strongly influ-
ence the total nutrient content of the sampled stemwood core.
Pedunculate oak is known to have a lower heartwood/sapwood
ratio for Ca and especially Mg than European beech [37] and
many other European tree species [31]. This is the most prob-
able explanation of the considerably lower Mg concentrations
in oak stemwood, than in other deciduous species, found in our
study. A study of Canadian hardwoods [13] revealed similar
low concentrations of Mg in the heartwood of red oak, as well
as lower nutrient stem content, compared with other American
hardwoods.
The concentration of Ca in oak stem wood in our study was
not lower than in other species (with the exception of lime). The
study of Canadian hardwoods referred to above [13] showed
that while the Ca concentration in the heartwood of red oak was
low; the concentration in bark was about twice that in beech.
If the same is true for European species, this may partly explain
why the Ca concentrations in oak and beech were similar in our
study, as the bark was included in the analysed samples.
Concentrations of Ca in the stemwood may depend on water
consumption [5], and the uptake of this element can be increased
by increasing transpiration rate [8]. Among the species we have
studied, lime had the highest Ca concentration in both foliar and
stem wood biomass, which may be related to higher water con-
sumption, due to the large area of lime foliage and high tran-
spiration rate of this species [28].
The differences in nutrient concentrations between spruce
and deciduous species were more prominent in stem wood than
in foliage. With the exception of low Mg in stemwood of oak
and low K in stemwood of birch, the concentrations of N, P,
K, Mg and S in spruce stem wood were, on average, about half
those in the deciduous species. Since Ca concentrations in
spruce were similar to concentrations in ash, beech, birch and
oak, but N concentrations in spruce were much lower than in
deciduous species, the Ca/N ratio in spruce stemwood was
high. Alriksson and Eriksson [3], on the other hand, found no
differences in N stem wood concentrations between spruce and
birch growing in the same soils, while another comparative
study [46] reported N and P concentrations in the stem wood
of spruce to be about half those in stem wood of red oak.
The differences in wood densities together with differences
in nutrient concentrations must be taken into account when esti-
mating the amount of nutrients in stem wood biomass. The den-
sity of ash, beech and oak wood is known to be rather similar,
while the density of birch and lime is lower, and Norway spruce
has the lowest wood density [16, 18]. The nutrient pools of Ca,
calculated from the mean concentrations observed in our study
and literature data on wood density [18], were, for instance,
similar for lime, oak and beech, while the Ca concentration in
lime stem wood was higher than in oak or beech.
Species-related differences in nutrient concentrations and
amounts in different biomass compartments could be important
in the long-term perspective. From the point of view of nutrient
balance and the sustainability of forest management it would
be of special interest to make further studies of species that
exhibit higher nutrient concentrations in the leaves, and lower
nutrient concentrations in the stem wood, together with a lower
wood density. Higher foliar concentrations may lead to higher
nutrient fluxes to the soil surface improving the nutrient status
of the upper soil layer. At the same time, the wood harvesting
of such a species may remove lower amounts of nutrients from
the ecosystem.
Acknowledgments: This work was carried out within the SUFOR
project sponsored by MISTRA. The Swedish Institute supported the
joint Swedish-Lithuanian project. We would like to thank Gintaras
Kulbokas for his help in finding suitable sites in Lithuania and we are
grateful to all the forest owners for permission to use their plantations.
We would like to thank Per-Eric Isberg and Ola Olsson for answering
our statistical questions. We are grateful to Bengt Nihlgård for
valuable comments on the manuscript and would like to thank Helen
Sheppard for correcting the English.
REFERENCES
[1] Aerts R., Chapin III F.S., The mineral nutrition of wild plants
revised: a re-evaluation of processes and patterns, Adv. Ecol. Res.
30 (2000) 1–63.
Macronutrients in temperate forest trees 497
[2] Alban D.H., Perala D.A., Schlaegel B.E., Biomass and nutrient dis-
tribution in aspen, pine, and spruce stands on the same soil type in
Minnesota, Can. J. For. Res. 8 (1978) 290–299.
[3] Alriksson A., Eriksson H.M., Variation in mineral nutrient and C
distribution in the soil and vegetation compartments of five tempe-
rate tree species in NE Sweden, For. Ecol. Manage. 108 (1998)
261–273.
[4] Andersson M., Balsberg-Påhlsson A M., Falkengren-Grerup U.,
Tyler G., Environment and mineral nutrients of beech (Fagus syl-
vatica L.) in South Sweden, Flora 183 (1989) 405–441.
[5] Arthur M.A., Siccama T.G., Yanai R.D., Calcium and magnesium
in wood of northern hardwood forest species: relations to site cha-
racteristics, Can. J. For. Res. 29 (1999) 339–346.
[6] Augusto L., Ranger J., Ponette Q., Rapp M., Relationships between
forest tree species, stand production and stand nutrient amount,
Ann. For. Sci. 57 (2000) 313–324.
[7] Balsberg-Påhlsson A M., Mineral nutrients, carbohydrates and
phenolic compounds in leaves of beech (Fagus sylvatica L.) in
southern Sweden as related to environmental factors, Tree Physiol.
5 (1989) 485–495.
[8] Barber S. A., Soil nutrient bioavailability: a mechanistic approach,
John Wiley & Sons, 1995.
[9] Bastrup-Birk A., Hansen K., Helge R P., Jørgensen B.B., Mikkelsen
T., Piledaard K., Bille-Hansen J., Biomasse og produktion, in: Hansen
K. (Ed.), Næringsstofkredsløb i skove – ionbalanceprojektet, Fors-
kningsserien, FSL, 2003.
[10] Bauer G., Schulze E D., Mund M., Nutrient contents and concen-
trations in relation to growth of Picea abies and Fagus sylvatica
along a European transect, Tree Physiol. 17 (1997) 777–786.
[11] Bergmann W., Nutritional disorders of plants: development, visual
and analytical diagnosis, Fischer, Jena, Stuttgart, New York, 1992.
[12] Bockheim J.G., Leide J.E., Foliar nutrient dynamics and nutrient-
use efficiency of oak and pine on a low fertility soil in Wisconsin,
Can. J. For. Res. 2l (1991) 925–934.
[13] Boucher P., Côté B., Characterizing base-cation immobilization in
the stem of six hardwoods of eastern Canada, Ann. For. Sci. 59
(2002) 397–407.
[14] Cape J.N., Freer-Smith P.H., Paterson I.S., Parkinson J.A., Wolfenden
J., The nutritional status of Picea abies (L.) Karst. across Europe,
and implications for “forest decline”, Trees 4 (1990) 211–224.
[15] Colin-Belgrand M., Ranger J., d’Argouges S., Transferts internes
d’éléments nutritifs dans le bois de châtaignier (Castanea sativa
Miller): approche dynamique sur une chronoséquence de peuple-
ments. I. Distribution des éléments minéraux, Acta Oecol. 14 (1993)
653–680.
[16] Dinwoodie J.M., Timber: Its nature and behaviour, 2nd ed., E & FN
Spon, New York, 2000.
[17] Dunham R.J., Nye P.H., The influence of soil water content on the
uptake of ions by roots. III. Phosphate, potassium, calcium and
magnesium uptake and concentration gradient in soil, J. Appl. Ecol.
13 (1976) 967–984.
[18] Ekström H., Lövvirke – Tillgångar och industriell användning
(Hardwood – supplies and industrial utilization), The Swedish Uni-
versity of Agricultural Sciences, Rapport No. 197, Uppsala, ISBN
91-576-3273-1, 1987 (in Swedish with English abstract).
[19] Eriksson H.M., Rosén K., Nutrient distribution in a Swedish tree
species experiment, Plant Soil 164 (1994) 51–59.
[20] FAO/Unesco Soil Map of the World, Revised Legent, World
Resources Report 60, FAO, Rome, Reprinted as Technical Paper
20, ISRIC, Wageningen, 1989.
[21] George E., Marschner H., Nutrient and water uptake by roots of
forest trees, Z. Pflanzenernähr. Bodenkd. 159 (1996) 11–21.
[22] Hagen-Thorn A., Callesen I., Armolaitis K., Nihlgård B., The
impact of six European tree species on the chemistry of mineral top-
soil in forest plantations on former agricultural land, For. Ecol.
Manage 195 (2004) 373–384.
[23] Holmquist J., Thelin G., Rosengren U., Stjernquist I., Wallman P.,
Sverdrup H., Assessment of sustainability in the Asa Forest Park,
in: Sverdrup H., Stjernquist I. (Eds.), Developing principles and
models for sustainable forestry in Sweden, Kluwer Academic
Publishers, 2002, pp. 381–426.
[24] Gülpen M., Türk S., Fink S., Ca nutrition of conifers, Z. Pflanzener-
nähr. Bodenkd. 158 (1995) 519–527.
[25] Ingerslev M., Above ground biomass and nutrient distribution in a
limed and fertilized Norway spruce (Picea Abies) plantation. Part I.
Nutrient concentrations, For. Ecol. Manage. 119 (1998) 13–20.
[26] Innes J.L., Methods to estimate forest health, Silva Fenn. 27 (1993)
145–157.
[27] ISRIC/FAO-UN, Procedures for Soil Analysis, van Reeuwijk L.P.
(Ed.), Technical Paper 9, 5th ed., 1995.
[28] Kazda M., Salzer J., Reiter I., Photosynthetic capacity in relation to
nitrogen in the canopy of a Quercus robur, Fraxinus angustifolia
and Tilia cordata flood plain forest, Tree Physiol. 20 (2000) 1029–
1037.
[29] Linder S., Foliar analysis for detecting and correcting nutrient
imbalances in Norway spruce, Ecol. Bull. 44 (1995) 178–190.
[30] Marschner H., Mineral nutrition of higher plants, 2nd
ed., Acade-
mic press, 1995.
[31] Meerts P., Mineral nutrient concentrations in sapwood and hear-
twood: a literature review, Ann. For. Sci. 59 (2002) 713–722.
[32] Montgomery D.C., Design and analysis of experiments, 5th ed.,
John Wiley & Sons, 2001.
[33] Nihlgård B., Plant biomass primary production and distribution of
chemical elements in a beech and a planted spruce forest in South
Sweden, Oikos 23 (1972) 69–81.
[34] Nihlgård B., Markundersökningar 1993 på fasta skogsprovytor I
Skåne (Soil investigations 1993 on permanent forest observation
plots in Scania) Lund University, Rapport 16, 1996 (in Swedish
with English abstract).
[35] Nihlgård B., Rosengren-Brinck and Thelin, G., Barrkemi på
Skånska gran – och tallprovytor 1994 – relationer till markkemi och
tillväxt (Needle chemistry on Scanian spruce and pine plots 1994 –
relation to soil chemistry and growth) Lund University, Rapport
No. 17, 1997 (in Swedish with English abstract).
[36] Norden U., Influence of tree species on acidification and mineral
pools in deciduous forest soils of South Sweden, Water Air Soil
Pollut. 76 (1994) 363–381.
[37] Penninckx V., Glineur S., Gruber W., Herbauts J., Meerts P., Radial
variations in wood mineral element concentrations: a comparison
of beech and pedunculate oak from the Belgian Ardennes, Ann.
For. Sci. 58 (2001) 253–260.
[38] Perala D.A., Alban D.H., Biomass nutrient distribution and litterfall
in Populus tremuloides, Pinus spp. and Picea glauca stands on 2
different soils in Minnesota USA, Plant Soil 64 (1982) 177–192.
[39] Pigott C.D., Biological flora of the British Isles, J. Ecol. 79 (1991)
1147–1207.
[40] Ponette Q., Ranger J., Ottorini J-M., Ulrich E., Aboveground bio-
mass and nutrient content of five Douglas-fir stands in France, For.
Ecol. Manage. 142 (2001) 109–127.
[41] Rochon P., Paré D., Messier C., Development of an improved
model estimating the nutrient content of the bole for four boreal tree
species, Can. J. For. Res. 28 (1998) 37–43.
[42] Rosengren-Brinck U. and Nihlgård B., Nutritional status in needles
of Norway spruce in relation to water and nutrient supply, Ecol.
Bull. 44 (1995) 168–177.
[43] Rosengren U., Stjernquist I., Thelin G., Nitrogen and nutrient imba-
lance, in: Sverdrup H., Stjernquist I. (Eds.), Developing principles
and models for sustainable forestry in Sweden, Kluwer Academic
Publishers, 2002, pp. 236–245.
[44] Santa Regina I., Organic matter distribution and nutrient fluxes
within a sweet chestnut (Castanea sativa Mill.) stand of the Sierra
de Gata, Spain, Ann. For. Sci. 57 (2000) 691–700.
[45] Sokal R.R., Rolf F.J., Biometry: the principles and practice of sta-
tistics in biological research, 3d ed., W.H. Freeman and Company,
New York, 1995.
[46] Son Y., Gower S.T., Nitrogen and phosphorus distribution for five
plantation species in southwestern Wisconsin, For. Ecol. Manage,
53 (1992) 175–193.
498 A. Hagen-Thorn et al.
[47] Stefan K., Fürst A., Hacker R., Bartels, U., Forest Foliar Condition
in Europe – Results of large-scale foliar chemistry surveys (survey
1995 and data from previous years), EC-UN/EC, Austrian Federal
Research Centre, 1997, 207 p.
[48] Thelin G., Rosengren-Brinck U., Nihlgård B., and Barkman A.,
Trends in needle and soil chemistry of Norway spruce and Scots
pine stands in South Sweden 1985–1994, Environ. Pollut. 99
(1998) 149–158.
[49] Thelin G., Rosengren U., Callesen I., Ingeslev M., The nutrient sta-
tus of Norway spruce in pure and in mixed-species stands, For.
Ecol. Manage. 160 (2002) 115–125.
[50] Thelin G., Sverdrup H., Holmquist J., Rosengren U., Linden M.,
Assessing nutrient sustainability for single stands at Jämjö, in:
Sverdrup H., Stjernquist I. (Eds.), Developing principles and
models for sustainable forestry in Sweden, Kluwer Academic
Publishers, 2002, pp. 236–245.
[51] Van den Burg J., Foliar analysis for determination of tree nutrient
status – a compilation of literature data. Rijksinstituut voor onde-
rzoek in de bos – en landschapsbouw “De Dorschkamp”, Rapport
No. 414, Wageningen, 1985.
[52] Wang J.R., Zhong A.L., Simard S.W., Kimmins J.P., Aboveground
biomass and nutrient accumulation in an age sequence of paper
birch (Betula papyrifera) in the Interior Cedar Hemlock zone, Bri-
tish Colombia, For. Ecol. Manage. 83 (1996) 27–38.
[53] Zöttl H.W., Hüttl R.F., Nutrient supply and forest decline in
southern Germany, Water Air Soil Pollut. 31 (1986) 449–462.
[54] Ågren G.I., Ingestad T., Root: shoot ratio as a balance between
nitrogen productivity and photosynthesis, Plant Cell Environ. 10
(1987) 579–586.
[55] Yugai A.N., Effect of lime Tilia cordata trees on forest growing
soil properties, Izv. Timiryazev s/kh akad 0 (5) (1980) (Recd. 1981)
111–115 (in Russian with English abstract).
To access this journal online:
www.edpsciences.org