Aircraft Design: Synthesis and Analysis - part 2 pptx
Bạn đang xem bản rút gọn của tài liệu. Xem và tải ngay bản đầy đủ của tài liệu tại đây (8.82 MB, 53 trang )
● Design Requirements and Objectives
● Design Optimization
● The Role of Computational Methods in Aircraft Design
● Exercise 1: Design Requirements
Market Determination
The most current data is available from manufacturers and airlines. Links on this page take you to an
excellent market summary by Boeing and data from British Airways.
● Boeing Market Outlook
● Air Passenger Traffic Statistics (Worldwide)
● Traffic Forecasts (Worldwide)
● Passenger Traffic in the US Domestic Market
● Traffic Forecasts (US)
SCHEDULED AIR TRAFFIC
DEVELOPMENT OF WORLD* SCHEDULED AIR TRAFFIC 1970-1994
Calendar
year
International Total
Passengers
carried (m)
Index RPKs
(bn)
Index Passengers
carried (m)
Index RPKs
(bn)
Index
1970 75 100 162 100 383 100 460 100
1971 80 107 173 107 411 107 494 107
1972 88 117 206 127 450 117 560 122
1973 98 131 236 146 489 128 618 134
1974 102 136 250 154 515 134 656 143
1975 108 144 270 167 534 139 697 152
1976 118 157 302 186 576 150 764 166
1977 129 172 332 205 610 159 818 178
1978 143 191 385 238 679 177 936 203
1979 158 211 440 272 754 197 1,060 230
1980 163 217 466 288 748 195 1,089 237
1981 173 231 494 305 752 196 1,119 243
1982 170 227 497 307 765 200 1,142 248
1983 173 231 511 315 798 208 1,190 259
1984 184 245 555 343 847 221 1,277 278
1985 194 259 590 364 899 235 1,367 297
1986 198 264 603 372 960 251 1,452 316
1987 222 296 688 425 1,027 268 1,589 345
1988 243 324 761 470 1,082 283 1,705 371
1989 262 349 824 509 1,119 292 1,780 387
1990 280 373 893 551 1,165 304 1,894 412
1991 266 355 860 531 1,133 296 1,843 401
1992 302 403 982 606 1,152 301 1,929 419
1993 320 427 1,043 644 1,128 295 1,946 423
1994
(prelim)
340 453 1,136 701 1,203 314 2,086 453
* Including The Commonwealth of Independent States.
Source: ICAO
Click for On Holiday
British Airways
Industry
TRAFFIC FORECASTS
Industry forecasts indicate that demand will grow at a rate of some six per cent per annum
over the next ten years. The table below summarises the most recent traffic forecasts from
IATA, Airbus Industrie, Boeing, and McDonnell Douglas. IATA forecasts indicate that
Pacific markets will continue to be the most important growth markets in the world. South
East Asian markets are forecast to grow between 1994 and 1998 at an average growth of
9.3 per cent, with North East Asia at 9.5 per cent. North America and Europe are forecast
to grow at lower rates (some four per cent and 5.6 per cent respectively), but from a much
larger base.
Source Date of
Forecast
Forecast
Period
Measure Average
Annual
Growth (%)
IATA October 1994 1994-1998 International
scheduled
passengers
6.6
Airbus
Industrie
March 1995 1994-2004 Total world
RPKs
5.4
Boeing May 1995 1994-2005 International
RPKs
5.7
Total world
RPKs
5.5
McDonnell
Douglas
1994 1993-2013 Total world
scheduled
RPKs
5.7
Shortcuts
Go
Inside British Airways
Go
Back
to:
Industry
Home
Feedback
Site Guide
Aircraft Aerodynamics and Design Group
Welcome to the Aircraft Aerodynamics and Design Group, a research lab in Stanford University's Department of Aeronautics and
Astronautics. This server is an experimental in-house server. See our main home page at: .
The Aircraft Aerodynamics and Design Group at Stanford University is involved with research in applied aerodynamics and aircraft
design. Our work ranges from the development of computational and experimental methods for aerodynamic analysis to studies of
unconventional aircraft concepts and new architectures for multidisciplinary design optimization.
Our research group consists of about a dozen people including doctoral students, post-docs, and faculty. Our work is currently
supported by NASA Ames and Langley Research Centers, Boeing Commercial Airplane Group, and Lockheed-Martin. The
Flight
Research Laboratory is the part of our group involved with flight experiments. See this link for more detail.
If you are interested in this type of work and are associated with a potential sponsor, we'd like to hear from you. Some of the best
graduate students in the country may be able to help in your field and are currently looking for research support.
Last update 1/99
by
Ilan Kroo
Click for On Holiday
British Airways
Industry
SCHEDULED AIR TRAFFIC
North America forms the largest global market, accounting for some 43 per cent of
scheduled passengers carried worldwide, and 42 per cent of scheduled RPKs in 1993,
according to statistics from ICAO. After North America, Europe is the next largest market
in the industry, with 25 per cent of scheduled passengers and 26 per cent scheduled RPKs.
Development of scheduled air traffic of North American*
airlines 1976-1993
Calendar
year
International Total
Passengers
carried (m)
Index RPKs
(bn)
Index Passengers
carried (m)
Index RPKs
(bn)
Index
1976 22 100 60 100 241 100 314 100
1977 23 104.5 66 110.0 259 107.5 338 107.6
1978 25 113.6 78 130.0 293 121.6 393 125.2
1979 30 136.4 95 158.3 334 138.6 455 144.9
1980 31 140.9 99 165.0 317 131.5 445 141.7
1981 32 145.5 100 166.7 299 124.1 431 137.3
1982 30 136.4 98 163.3 303 125.7 442 140.8
1983 31 140.9 105 175.0 321 133.2 468 149.0
1984 34 154.5 118 196.7 352 146.1 513 163.4
1985 34 154.5 124 206.7 382 158.5 561 178.7
1986 36 163.6 125 208.3 431 178.8 622 198.1
1987 42 190.9 151 251.7 459 190.5 681 216.9
1988 48 218.2 180 300.0 475 197.1 726 231.2
1989 50 227.3 197 328.3 472 195.9 744 236.9
Shortcuts
Go
Inside British Airways
Go
1990 55 250.0 221 368.3 485 201.2 783 249.4
1991 51 231.8 212 353.3 469 194.6 760 242.0
1992 55 250.0 239 398.3 484 200.8 806 256.7
1993 57 259.1 245 408.3 487 202.1 814 259.2
* By region of carrier registration Source: ICAO
Back
to:
Industry
Home
Feedback
Site Guide
Click for Executive Club
British Airways
Industry
TRAFFIC FORECASTS
According to traffic forecasts produced by IATA and leading aircraft manufacturers,
demand for air travel in North America will grow at approximately four per cent per
annum over the next ten years. Whilst the mature North American market is forecast to
grow at a lower rate than the world average of some six per cent, in terms of incremental
traffic growth, it is expected to outperform the other five major world markets. The table
below summarises the most recent forecasts.
Source Date of
forecast
Forecast
period
Region Measure Average
annual
growth
(%)
IATA October 1994 1994 -
1998
Intra North
America
Passengers
carried
3.1
Boeing May 1995 1995 -
2010
US domestic RPKs 4.0
Mc
Donnell
Douglas
November 1994 1993 -
2013
US domestic
Intra North
America
RPKs
RPKs
4.0
4.1
Airbus
Industrie
May 1995 1995 -
2004
Intra North
America
RPKs 4.2
Back
to:
Industry
Home
Feedback
Site Guide
Shortcuts
Go
Inside British Airways
Go
Design Requirements and Objectives
One of the first steps in airplane design is the establishment of design requirements and objectives. These
are used to formally document the project goals, ensure that the final design meets the requirements, and
to aid in future product development. The specific DR&O's are based on customer requirements,
certification requirements, and company policy (often in the form of a design standards manual). They
have evolved from rather simple letters to very complex system engineering documents.
Early aircraft were developed in response to very simple requirements as demonstrated by the Army's
contract with the Wright brothers. The agreement shown below requests one (1) heavier than air flying
machine to be delivered in 6 1/2 months although even then fine print was included in the Signal Corps
Specification Number 486. (Click on the image below for a readable version.)
Twenty five years later, a letter from Transcontinental and Western Air brought about the birth of the DC-
1 through a page list of specifications shown below.
Today, complex sets of requirements and objectives include specification of airplane performance, safety,
reliability and maintainability, subsystems properties and performance, and others. Some of these are
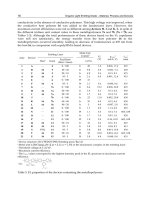
illustrated in the table below, based on a Boeing chart
Transport Aircraft Design Objectives and Constraints
Issue Civil Military
Dominant design criteria Economics and safety
Mission accomplishment and
survivability
Performance
Maximum economic cruise
Minimum off-design penalty
in wing design
Adequate range and response
Overall mission
accomplishment
Airfield environment
Moderate-to-long runways
Paved runway
High -level ATC and landing
aides
Adequate space for ground
maneuver and parking
Short-to-moderate runways
All types of runway surfaces
Often spartan ATC, etc.
Limited space available
System complexity and
mechanical design
Low maintenance- economic
issue
Low system cost
Safety and reliability
Long service life
Low maintenance- availability
issue
Acceptable system cost
Reliability and survivability
Damage tolerance
Government regulations and
community acceptance
Must be certifiable (FAA,
etc.)
Safety oriented
Low noise mandatory
Military standards
Performance and safety
Reliability oriented
Low noise desirable
Good neighbor in peace
Dectability in war
A list of some of the typical high-level design requirements for an example supersonic transport study
project are given in the table below.
Design Requirements for a Transpacific Supersonic Transport
Payload 300 passengers at 175 lbs. and 40 lbs. of baggage each.
Crew
2 pilots and 10 flight attendants at 175 lbs. and 30 lbs. of baggage
each.
Range Design range of 5,500 nm, followed by a 30 min. loiter
Cruise
Mach 2.5 at 65,000 ft. Outbound and inbound subsonic cruise legs
at Mach 0.95, 45,000 ft
Take-off and Landing
FAR 25 field length of 12,000 ft. Standard days, Wl
and
= 0.85 W
take-
off
Fuel JP-4
Materials Advanced aluminum where applicable
Themal Protection
As required, rely on passive systems when feasible, use active
systems only when necessary
Certification Base FAR 25, FAR 36 (noise requirements)
Many of the design requirements are specified by the relevant Federal Air Regulations (FAR's) in the
U.S. or the Joint Airworthiness Requirements (JAR's) in Europe. These regulations are divided into
portions that apply to commercial aircraft, general aviation, sailplanes, and even ultralight aircraft. The
applicable regulations for aircraft with which we will be dealing depend on the aircraft category and are
grouped as described in the tables below:
Aircraft Categories
Characteristic General Aviation Normal Transport
Maximum takeoff
weight, lb
<12,500 <12,500 Unrestricted
Number of engines > 0 > 1 > 1
Type of engine All Propeller Only All
Minimum crew:
Flight crew
Cabin attendants
One
None
Two
None for < 20 pax
Two
None for < 10 pax
Maximum number of
occupants
10 23 Unrestricted
Maximum operating
altitude, ft
25,000 25,000 Unrestricted
FAR Applicability
Regulations
Covering:
General Aviation Normal Transport
Airplane
airworthiness
standards
Part 23 Part 23 Part 25
Engine airworthiness
standards
Part 33 Part 33 Part 33
Propeller
airworthiness
standards
Part 35 Part 35 Part 35
Noise
Part 36
Appendix F
Part 36
Appendix F
Part 36
General operation and
flight rules
Part 91 Part 91 Part 91
Large aircraft / airline
operation
Part 121
Agricultural / Travel
clubs / Air taxi
Part 137 Part 135 Part 123
In addition to the regulatory requirements, the primary airplane design objectives include a specification
of the number of passengers or cargo capability, target cruise speeds, and ranges. These are often
established by extensive marketing studies of target city pairs, current market coverage and growth
trends, and customer input.
Optimization
This section is an overview of the design process - a more philosophical discussion before plunging into
the details of compressibility drag prediction, high-lift systems, etc The specific approach to the design
problem used here will be discussed later, but now we will step back and discuss the big picture of
aircraft design optimization.
Overview
You may have heard that a particular new airplane was designed on the computer. Just what this means
and what can or cannot be computed-aided is not obvious and while design and analysis methods are
being computerized to a greater degree than was possible earlier, there are great practical difficulties in
turning the design task entirely over to the computers.
The design process has, historically, ranged from sketches on napkins (Fig. 1) to trial, error, and natural
selection (Fig. 2), to sophisticated computer-aided design programs (Fig. 3).
Figure 1. Aircraft concepts can start with very rough sketches, as did the human powered airplane, the
Gossamer Condor.
Figure 2. Aircraft Design By Trial and Error
Figure 3. Computer-Aided Design of Aircraft
Because the process is so complex, involving hundreds or thousands of computer programs, many people
at many locations, it is difficult to manage and companies are continuing to try to improve on the
strategy. In the early days of airplane design, people did not do much computation. The design teams
tended to be small, managed by a single Chief Designer who knew about all of the design details and
could make all of the important decisions. Modern design projects are often so complex that the problem
has to be decomposed and each part of the problem tackled by a different team. The way in which these
teams should work together is still being debated by managers and researchers.
The goal of these processes, whatever form they take, is to design what is, in some sense, the best
airplane. To do this requires that we address three basic issues:
1. What do we mean by best?
2. How can we estimate the characteristics of designs so we can compare two designs in a quantitative
way?
3. How do we choose the design variables which yield an optimum?
The first of these questions is perhaps the most important one, for if we don't know what we are trying to
achieve, or if we select the wrong goal, it doesn't matter how good the analysis method may be, nor how
efficient is our optimization procedure. Nevertheless, this question is often not given sufficient attention
in many optimization studies.
Defining the Objective
If we were to examine advertisements for aircraft it might seem that the definition of the best aircraft is
very simple. Madison Ave. Aircraft Company sells the fastest, most efficient, quietest, most inexpensive
airplane with the shortest field length. Unfortunately such an airplane cannot exist. As Professor Bryson
puts it, "You can only make one thing best at a time." The most inexpensive airplane would surely not be
the fastest; the most efficient would not be the most comfortable. Similarly, the best aerodynamic design
is rather different from the best structural design, so that the best overall airplane is always a compromise
in some sense (see Fig 4.). The compromise can be made in a rational way if the right measure of
performance is used. Structural weight and lift to drag ratio, for example, become parts of a larger
equation. The left hand side of this equation is termed the figure of merit or objective and depends on the
intended application for the aircraft.
Figure 4. One can only make one thing best at a time.
Various quantities have been used for this purpose including those listed below. This list is applicable to
commercial transport aircraft and is in order of increasing sophistication. Many studies of new aircraft
currently use direct operating cost as a measure of performance. This quantity is a more representative
measure of the aircraft's performance than is a number such as gross weight since it is sensitive to fuel
costs and other important variables. While some estimate of fuel prices, depreciation rates, insurance,
labor rates, etc. must be made in order to compute direct operating cost, it is not necessary to estimate
airline traffic, fares, and other difficult-to-project variables which would be necessary for computing
numbers such as profit or return on investment.
Possible measures of performance:
1. Minimum empty weight
2. Minimum take-off weight (includes some measure of efficiency as fuel weight is included)
3. Minimum direct operating cost (a commonly-used measure)
4. Minimum total operating cost (a bit more difficult to estimate)
5. Minimum system cost over X years (life-cycle cost)
6. Maximum profit
7. Maximum return on investment
8. Maximum payload per $ (Sometimes used for military aircraft)
Analyses and Modeling
Once we have decided on the definition of "best" we must find a way of relating the "design variables" to
the goal. This process is shown schematically, below.
For aircraft design, this process is often extremely complex. The number of parameters needed to
completely specify a 747 is astronomical. So one uses a combination of approximation, experience, and
statistical information on similar aircraft to reduce the number of design variables to a manageable
number. This may range from 1 or 2 for back-of-the envelope feasibility studies to hundreds or even
thousands of variables in the case of computer-assisted optimization studies. Even when the situation is
simplified the model is usually very complicated and difficult. One generally must use a hierarchy of
analysis tools ranging from the most simple to some rather detailed methods.
Calculating the drag of even a simple wing is not just a matter of specifying span and area. Other
parameters of importance include: taper, sweep, Reynolds number, Mach number, C
L
or alpha, twist,
airfoil sections, load factor, distribution of bugs, etc.
This can be programmed and available as an analysis tool, but one must be very cautious. Which of these
variables is included in the model? What if the wing is operating at 100,000 Reynolds number? Has it
been compared with experiment in this regime?
As the design progresses, more information becomes available, and more refined analyses become part of
the design studies. The expertise of a designer, these days, involves knowing what needs to be computed
at what time and identifying the appropriate level of approximation in the analyses.
One of the most important, but least well understood parts of the design process is the conceptual design
phase. This involves deciding on just what parameters will be used to describe the design. Will this be a
flying wing? A twin-fuselage airplane? Often designers develop several competing concepts and try to
develop each in some detail. The final concept is "down-selected" and studied in more detail.
Design Iteration and Optimization
The last question which must be addressed seems the most straightforward but is full of subtlety and
potential pitfalls. There are several methods by which one chooses the design variables leading to the
"best" design. All of these require that many analyses be carried out-often thousands of times. This
requires that the model be simplified to the point that it is fast enough, but not to the point that it is
worthless. (Einstein's saying comes to mind here: "Things should be as simple as possible, but no
simpler.") When the design may be described by only a few parameters, the process is very simple. One
investigates several cases, and usually can easily see where the optimum occurs. (Even this may be
difficult if the computations are extremely time consuming and theories called 'design of experiments',
'response surfaces', and Taguchi methods are currently used to solve such problems.) When the number
of variables is more than a few, more formal optimization is required. Two approaches to optimization
are commonly used.
1) Analytic results: When the objective function can be represented analytically, it is sometimes possible
to construct derivatives with respect to the design variables and produce a set of simultaneous equations
to be solved for the optimum. The idea is that a necessary condition for an optimum (without constraints)
is: dJ / dxi = 0 for all i. This approach is very useful for fundamental studies, but requires great
simplification (often oversimplification). One can see how useful this is in example cases. Consider the
determination of the C
L
for maximum lift to drag ratio, L/D. If we write: C
D
= C
Dp
+ C
L
^2 / AR
and L/D = C
L
/ C
D
, then L/D is maximized when C
D
/C
L
is minimized
or (C
D
/C
L
)/C
L
= 0.
This implies that: 0 = (C
Dp
/C
L
+ C
L
/ AR) / C
L
= -C
Dp
/C
L
2
+ 1 / AR.
The result is that at maximum L/D: C
Dp
= C
L
2
/ AR. That is, the zero-lift drag is equal to the lift-
dependent drag. This simple result is very useful, but one must be careful that the analysis is applicable.
When the aspect ratio or C
Dp
is very high, the drag departs from the simple model at the computed
optimal C
L
. When the problem involves constraints, the derivative is not zero at the optimum, but a
similar analytic approach is possible by introducing Lagrange multipliers, λ. In such a case, when the
constraints are represented by g
i
= 0 the condition for an optimum is: d(J + λ
j
g
j
) / dx
i
= 0 and g
i
= 0.
2) Numerical optimization: In most aircraft design problems, the analysis involves iteration, table look-
ups, or complex computations that limit the application of such analytical results. In these cases, direct
search methods are employed. The following are schemes that have been used in aircraft design:
a. Grid searching: A structured approach to surveying the design space in which designs are evaluated at
points on a grid. The disadvantage with this approach is that as the number of variables increases, the
number of computations increases very quickly. If one evaluated designs with just five values of each
parameter, the number of computations would be 5n where n is the number of design variables. Note that
when n = 10, we require almost 10 million design evaluations.
b. Random searches: A less structured approach that does not require as many computations as the design
variables increase, is the random search. It also does not guarantee that the best solution will be found.
This method is sometimes used after some of the more sophisticated methods, described below, have
gotten stuck.
c. Nonlinear Simplex or Polytope Method: In this case, n+1 points are evaluated in an n-dimensional
design space. One moves in the direction of the best point until no improvement is found. At that point,
the distance between points is reduced and the method tries to refine the search direction. This method is
described in more detail in the book, "Numerical Recipes". It is very simple and robust, but very
inefficient when one must consider more than a few design variables. Nevertheless, it has been used in
aircraft optimization.
d. Gradient methods: These methods involve computation of the gradient of the objective function with
respect to the design variables. The gradient vector points in the direction of the steepest slope. Moving
in this direction changes the objective function most rapidly. Several forms of gradient methods are used.
The most simple of these is the method of steepest descents in which the design variables are changed to
move in the direction of the gradient. This method is usually modified to make it more robust and
efficient. Variants on this theme include the conjugate gradient method and quasi-Newton methods that
estimate values of the second derivatives (Hessian matrix) to improve the estimate of the best search
direction. Most of these methods use the gradient information to establish a search direction and then
perform a one- dimensional search in this direction.
So that's it. We just put it on the computer and press Return and out pops a 777, right?
Not really. Despite its obvious utility, numerical optimization seems to have been talked about a lot more
than it has been used. It certainly is talked about a great deal. Prof. Holt Ashley gave the AIAA Wright
Brothers Lecture in 1982. It was entitled, "On Making Things the Best Aeronautical Uses of
Optimization". For this lecture, he surveyed the relevant literature and found 4550 papers on optimal
control, 2142 on aerodynamic optimization, 1381 on structural optimization. A total of 8073 papers,
along with surveys, texts, etc But Ashley had a hard time finding a single case where this formal
procedure was employed by industry. In his paper he cites the results of an informal survey he conducted
on the uses of optimization.
Typical responses included:
· From an aeronautical engineer, experienced in civil and aeronautical structures, "One of the reasons that
I stopped work in optimization was my dismay that there were so very few applications."
· From a Dean of Engineering who has known the field for over a quarter century: "I do not recollect any
applications."
· From a foremost specialist on synthesis with aeroelastic constraints, "I am sorry, but I don't really have
any "
· From a recently-retired senior design engineer, describing events at his aerospace company, "For fifteen
years I beat my head against a stone wall The end was: formal optimization techniques were never
used in aircraft design (even to this day!). The company was forced to use them in its subsequent ICBM
and space programs."
A great deal has changed in the past decade, however, and optimization techniques are (only now)
starting to become a standard tool for engineering design. Why has it taken so long for these methods to
become well-used, and why, still, are the methods not used everywhere?
There are a host of reasons:
1) First, the analysis, itself, of a complete aircraft configuration is rather complex, even without the
optimization. Program size and complexity are such that only very well-documented and well-maintained
computer programs can be used. These programs are often written by many people (some of whom have
retired) over many years and it is very difficult for an individual to know what the program can and
cannot do. Many grandiose plans for completely integrated aircraft design systems have fallen by the
wayside because they quickly become unmanageable.
2) Any analysis makes certain approximations and leaves certain things out. Optimizers, however, may
not understand that certain considerations have been omitted. Optimizers are notorious for breaking
programs. They exploit any weakness in the analysis if that will lead to a "better" answer. Even when the
result appears reasonable, several difficult-to-quantify factors are often omitted: the compatibility with
future growth versions for instance, or the advantages associated with fleet commonality. Moreover,
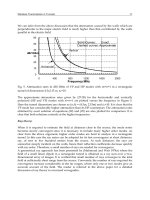
optimums are, by definition, flat, so that leaving something out of the objective can cause large
discrepancies in the answer - the optimum is never optimal. Some examples are shown in figures 5 and 6.
These are examples in which real-life testing, rather than reliance on simulation, is critical.
3) Ruts, creativity, and local minima: New technology changes the assumptions, constraints, experience.
An optimizer is limited to consider those designs that are described by the selected parameter set. Thus,
an optimizer and analysis that was written to design conventional structures may not know enough to
suggest the use of composites. An optimizer did not invent the idea of folding tips for a 777, nor would it
create winglets, canards, active controls, or laminar flow, unless the programmer anticipated this
possibility, or at least permitted the possibility, in the selection of design variables. (Figure 7.)
4) Noisy objective functions: When the analysis involves table look-ups or requires iterative intermediate
computations, the objective function can appear to vary in a non-smooth fashion. This causes difficulties
for many optimizers, especially those that require derivative information.
5) The dangers of sub-optimization: It is tempting to fix many design variables and select a few at a time
to optimize, then fix these and vary others. This is known as partial optimization or sub-optimization and,
while it makes each study more understandable, it can lead to wrong answers. One must be very careful
about the selection of design variables and avoid partial optimization.